
Finally, the start of the season we’ve all been waiting for. Throw out all the fast times from September, but apply all the lessons learned through the summer and fall. Regional week is here and with it comes the many projections and previews I’ll write.
Just as last year and throughout the season, I’m projecting these using race simulations. Through a season’s worth of speed ratings, one can determine a runner’s average rating and the variability of those ratings. Both those factors are then weighed towards more recent meets, which are then simulated thousands of times using a Monte Carlo analysis (also described by TullyRunners here). Over those thousands of race simulations, one can determine a team’s average place and average score, a runner’s average place, odds on winning, and odds on qualifying.
These are useful in cross country scenarios, where you have consistent runners and those who are a bit more up and down. For example:
| Tanner Time | Tanner Rating | Tanner Avg. | Tanner StDev. |
| 15:30 | 210 | ||
| 15:45 | 205 | ||
| 16:00 | 200 | ||
| 16:15 | 195 | ||
| 16:30 | 190 | 200 | 7.91 |
| MIXCSR Time | MIXCSR Rating | MIXCSR Avg. | MIXCSR StDev. |
| 16:09 | 197 | ||
| 16:12 | 196 | ||
| 16:15 | 195 | ||
| 16:18 | 194 | ||
| 16:21 | 193 | 195 | 1.58 |
Jacob at his best might be faster than I in four of the five races during the season. I’d almost never be All-State in Division 1, but he might contend for a top-5 spot or place 60th.
If we did 20 simulations, this is how it might turn out:
| Race | Tanner Avg. | Tanner StDev | Tanner Rating | MIXCSR Avg. | MIXCSR StDev | MIXCSR Rating |
| 1 | 200 | 7.9 | 202.1 | 195 | 1.6 | 195.6 |
| 2 | 200 | 7.9 | 196.2 | 195 | 1.6 | 194.1 |
| 3 | 200 | 7.9 | 190.0 | 195 | 1.6 | 199.2 |
| 4 | 200 | 7.9 | 193.4 | 195 | 1.6 | 192.5 |
| 5 | 200 | 7.9 | 206.8 | 195 | 1.6 | 195.7 |
| 6 | 200 | 7.9 | 201.8 | 195 | 1.6 | 196.1 |
| 7 | 200 | 7.9 | 171.6 | 195 | 1.6 | 194.9 |
| 8 | 200 | 7.9 | 189.2 | 195 | 1.6 | 195.9 |
| 9 | 200 | 7.9 | 205.5 | 195 | 1.6 | 197.0 |
| 10 | 200 | 7.9 | 203.8 | 195 | 1.6 | 192.6 |
| 11 | 200 | 7.9 | 192.3 | 195 | 1.6 | 196.5 |
| 12 | 200 | 7.9 | 196.9 | 195 | 1.6 | 196.4 |
| 13 | 200 | 7.9 | 198.5 | 195 | 1.6 | 195.6 |
| 14 | 200 | 7.9 | 203.2 | 195 | 1.6 | 194.1 |
| 15 | 200 | 7.9 | 193.9 | 195 | 1.6 | 192.6 |
| 16 | 200 | 7.9 | 199.3 | 195 | 1.6 | 193.2 |
| 17 | 200 | 7.9 | 208.7 | 195 | 1.6 | 194.2 |
| 18 | 200 | 7.9 | 213.7 | 195 | 1.6 | 194.6 |
| 19 | 200 | 7.9 | 212.6 | 195 | 1.6 | 197.1 |
| 20 | 200 | 7.9 | 206.3 | 195 | 1.6 | 193.9 |
I’d win four times, but I’d never have the ability to win a title like he had in Race 18. He’s usually All-State, but may cost his team a title through his effort in Race 7.
The simulations give the possibilities of those scenarios and all the various scoring scripts. A sixth girl that can pop off on any certain day, a reliable boy who always runs 17-flat, you name it. Hopefully, they better elucidate our contenders, qualifiers, and how these races play out over the weekend.
But always remember, races aren’t run on paper or on a computer. These projections are meant to better our sport, give more attention where little is given. Although I take pride in their accuracy, this endeavor would be quite boring if it were always perfect. I look forward to these being proven wrong and I expect to hear about it as well.

GIRLS
Ranked Teams
#4 Hillsdale Academy
#16 Pittsford
Projected Individual Qualifier Cutoff
20th Place
| Projected Place | Team | Avg. Place | Avg. Score | Win % | Qualify % |
| 1 | Hillsdale Academy | 1.0 | 34 | 95+ | 95+ |
| 2 | Pittsford | 2.0 | 53 | 95+ | |
| 3 | Addison | 3.0 | 77 | 95+ | |
| 4 | Adrian Lenawee Christian | 4.0 | 89 | ||
| 5 | Camden-Frontier | 5.0 | 106 |
| Projected Place | Grade | Name | Team | Avg. Place |
| 1 | 11 | Izzy Brooks | Adrian Lenawee Christian | 1.0 |
| 2 | 12 | Brooke Smith | Pittsford | 2.1 |
| 3 | 11 | Ella Walton | Hillsdale Academy | 4.3 |
| 4 | 10 | Ruth Brownlee | Hillsdale Academy | 4.8 |
| 5 | 11 | Ava Mallar | Pittsford | 5.1 |
| 6 | 11 | Stephanie Hernandez | Addison | 6.7 |
| 7 | 11 | Riley McCumber | Pittsford | 6.9 |
| 8 | 11 | Caroline Roberts | Hillsdale Academy | 8.9 |
| 9 | 10 | Abby Brownlee | Hillsdale Academy | 9.2 |
| 10 | 11 | Aubrey Appleman | Britton Deerfield | 10.8 |
| 11 | 12 | Leah Rorick | Morenci | 11.3 |
| 12 | 9 | Allie Miller | Hillsdale Academy | 11.7 |
| 13 | 9 | Grace Brownlee | Hillsdale Academy | 12.0 |
| 14 | 9 | Audrey Nehlsen | Hillsdale Academy | 13.3 |
| 15 | 11 | Priya Mericle | East Jackson | 14.4 |
| 16 | 10 | Emersyn Bachelder | Morenci | 14.4 |
| 17 | 9 | Lillian Jagielski | Pittsford | 17.1 |
| 18 | 9 | Kendalyn Perry | Addison | 18.8 |
| 19 | 11 | Taylor Lautermilch | Camden-Frontier | 19.5 |
| 20 | 10 | Grace Raymond | Petersburg-Summerfield | 20.8 |
| 21 | 10 | Ayla Hopkins | Camden-Frontier | 21.8 |
| 22 | 9 | Gigi Masters | Adrian Lenawee Christian | 23.7 |
| 23 | 11 | Allison Morris | Addison | 24.7 |
| 24 | 12 | Maggie Frost | Addison | 25.2 |
| 25 | 12 | Sayra Hernandez | Addison | 25.3 |
| 26 | 12 | Kariana Carpenter | Jackson Preparatory | 25.8 |
| 27 | 11 | Sophia Falater | Reading | 25.8 |
| 28 | 12 | Paige Santi | Reading | 27.5 |
| 29 | 12 | Faith Secor | Petersburg-Summerfield | 27.8 |
| 30 | 11 | Averil Miller | Camden-Frontier | 28.7 |

Any Intriguing Battles?
The top three teams seem set, but I might look to what Izzy Brooks can throw down or how Hillsdale Academy’s pack appears. The Colts have seven solid girls that could play a role next week. Izzy had a nice rebound from the Lenawee County race, winning the Class D meet at Shepherd in 19:16. With its gradual downhills, Jackson can run fast. If she goes for it, I wouldn’t be shocked to see another low-19 (or faster) performance.
BOYS
Ranked Teams
Boys
#1 Hillsdale Academy
#16 East Jackson
#25 Adrian Lenawee Christian
Projected Individual Qualifier Cutoff
20th Place
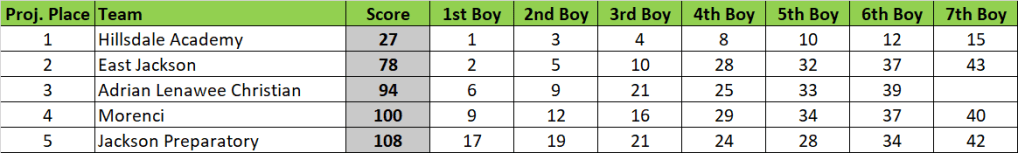
| Projected Place | Team | Avg. Place | Avg. Score | Win % | Qualify % |
| 1 | Hillsdale Academy | 1.0 | 27 | 95+ | 95+ |
| 2 | East Jackson | 2.1 | 78 | 95+ | |
| 3 | Adrian Lenawee Christian | 3.3 | 94 | 74 | |
| 4 | Morenci | 4.0 | 100 | 25 | |
| 5 | Jackson Preparatory | 4.7 | 108 | ||
| 6 | Britton Deerfield | 6.4 | 173 | ||
| 7 | Reading | 6.6 | 177 | ||
| 8 | Vandercook Lake | 8.0 | 204 | ||
| 9 | Addison | 9.0 | 229 |
| Projected Place | Grade | Name | Team | Avg. Place |
| 1 | 12 | Thomas Holm | Hillsdale Academy | 1.0 |
| 2 | 12 | Michael Allen | East Jackson | 2.4 |
| 3 | 10 | Grayson Rorick | Hillsdale Academy | 2.7 |
| 4 | 11 | Reece Poole | Hillsdale Academy | 4.4 |
| 5 | 12 | Javin Mericle | East Jackson | 4.6 |
| 6 | 11 | Joel Lange | Adrian Lenawee Christian | 6.9 |
| 7 | 12 | Nathan Daniels | Adrian Lenawee Christian | 8.4 |
| 8 | 10 | Henry Lindley | Hillsdale Academy | 9.1 |
| 9 | 12 | William Kennedy | East Jackson | 9.9 |
| 10 | 9 | Landon Wilkins | Morenci | 11.2 |
| 11 | 11 | Beau Shaffer | Morenci | 11.3 |
| 12 | 9 | Ryan Miller | Hillsdale Academy | 11.4 |
| 13 | 10 | James Rahe | Hillsdale Academy | 11.7 |
| 14 | 12 | Karol Schlueter | Hillsdale Academy | 13.7 |
| 15 | 11 | Zachary Martinez | Morenci | 14.9 |
| 16 | 11 | Jameson Watson | Britton Deerfield | 16.3 |
| 17 | 12 | Noah Blondke | Jackson Preparatory | 17.3 |
| 18 | 12 | Nathan Blondke | Jackson Preparatory | 18.5 |
| 19 | 11 | Diego BoCole | Jackson Preparatory | 20.4 |
| 20 | 12 | Kutter Vanaken | Reading | 20.7 |
| 21 | 10 | Dallas Swaenepoel | Vandercook Lake | 21.1 |
| 22 | 11 | Kaleb Richardson | Adrian Lenawee Christian | 23.2 |
| 23 | 10 | Pierson Cousino | Adrian Lenawee Christian | 23.7 |
| 24 | 10 | Corey Dubnicki | Jackson Preparatory | 25.4 |
| 25 | 9 | Noah Lucas | Addison | 26.0 |
| 26 | 11 | Ryan Good | Britton Deerfield | 28.1 |
| 27 | 10 | Brayden Wright | Reading | 30.5 |
| 28 | 11 | Logan Mishaw | Jackson Preparatory | 30.7 |
| 29 | 12 | Colton Raffensberger | East Jackson | 30.9 |
| 30 | 12 | Randy Reddick | East Jackson | 31.7 |
Any Intriguing Battles?
These last few weeks, we’ve got a few examples of the impending Adrian Lenawee Christian vs. Morenci matchup on the boys side. Lenawee Christian took the first two battles at the TCC Final and the Lenawee County Championship, while Morenci came through up at Class D this past weekend. Beau Schaffer easily had his best effort of the year, coming in before any ALC athlete. Could that be enough to lead the Bulldogs into the 3rd spot?
GIRLS
Ranked Teams
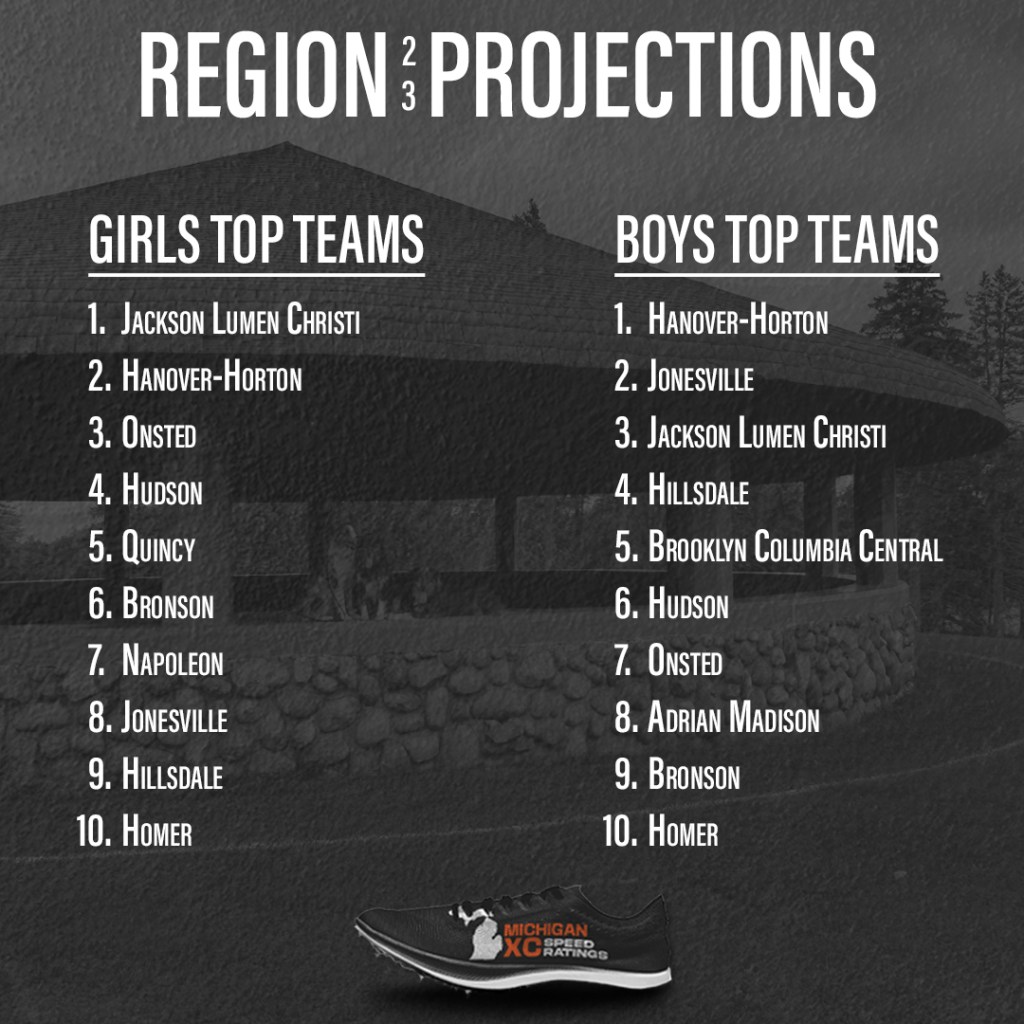
#1 Jackson Lumen Christi
#13 Hanover-Horton
#23 Onsted
Projected Individual Qualifier Cutoff
20th Place
| Projected Place | Team | Avg. Place | Avg. Score | Win % | Qualify % |
| 1 | Jackson Lumen Christi | 1.0 | 28 | 95+ | 95+ |
| 2 | Hanover-Horton | 2.0 | 70 | 95+ | |
| 3 | Onsted | 3.0 | 99 | 95+ | |
| 4 | Hudson | 4.4 | 142 | ||
| 5 | Quincy | 4.7 | 145 | ||
| 6 | Bronson | 6.3 | 172 | ||
| 7 | Napoleon | 6.6 | 175 | ||
| 8 | Jonesville | 8.3 | 214 | ||
| 9 | Hillsdale | 9.2 | 232 | ||
| 10 | Homer | 9.5 | 238 | ||
| 11 | Sand Creek | 11.2 | 277 | ||
| 12 | Michigan Center | 11.8 | 293 |
| Projected Place | Grade | Name | Team | Avg. Place |
| 1 | 12 | Madison Osterberg | Jackson Lumen Christi | 1.1 |
| 2 | 11 | Emmry Ross | Onsted | 1.9 |
| 3 | 9 | Samantha Schroeder | Jackson Lumen Christi | 3.1 |
| 4 | 12 | Olivia Perrine | Hanover-Horton | 4.8 |
| 5 | 10 | Macy Fazekas | Jackson Lumen Christi | 5.8 |
| 6 | 10 | Ashlynn Harris | Bronson | 7.1 |
| 7 | 12 | Sophia Reynolds | Hanover-Horton | 7.7 |
| 8 | 11 | Chloe Stalhood | Hillsdale | 8.4 |
| 9 | 11 | Layla Lopez | Jackson Lumen Christi | 8.8 |
| 10 | 11 | Ava Hathaway | Bronson | 9.0 |
| 11 | 12 | Sydney Fazekas | Jackson Lumen Christi | 9.7 |
| 12 | 11 | Thia Tello | Jackson Lumen Christi | 12.2 |
| 13 | 9 | Kendyl Musielewiez | Quincy | 13.1 |
| 14 | 12 | Julianna Debozy-Crawford | Hanover-Horton | 15.5 |
| 15 | 11 | Jayla Bright | Hudson | 16.6 |
| 16 | 9 | Brynlee Swihart | Hanover-Horton | 17.0 |
| 17 | 10 | Brookelyn Parker | Quincy | 17.4 |
| 18 | 11 | Allie England | Onsted | 17.6 |
| 19 | 10 | Raegan Brosamer | Onsted | 17.9 |
| 20 | 11 | Karly Page | Jonesville | 19.7 |
| 21 | 10 | Annabelle Czeiszperger | Hudson | 22.9 |
| 22 | 12 | Sadie Miller | Quincy | 23.5 |
| 23 | 10 | Sophie Patrick | Homer | 24.3 |
| 24 | 11 | Lauren McLain | Napoleon | 24.7 |
| 25 | 12 | Lily Mason | Hanover-Horton | 25.6 |
| 26 | 11 | Mia Sanchez | Jackson Lumen Christi | 26.6 |
| 27 | 10 | Makenzy Lindemann | Napoleon | 27.5 |
| 28 | 12 | Madelyn Norman | Napoleon | 28.7 |
| 29 | 9 | Izabel Raglow | Onsted | 28.8 |
| 30 | 11 | Pierce Pibbles | Hudson | 31.3 |

Any Intriguing Battles?
Not especially, as the top three girls teams appear to be heavy favorites to make it out. This region benefitted from the loss of Leslie, a school in the vicinity of Jackson that moved to Region 26. This opened the door for teams such as Onsted and Hanover-Horton to have a greater chance at qualifying.
BOYS
Ranked Teams
#4 Hanover-Horton
#8 Jonesville
#9 Jackson Lumen Christi
Projected Individual Qualifier Cutoff
18th Place
| Projected Place | Team | Avg. Place | Avg. Score | Win % | Qualify % |
| 1 | Hanover-Horton | 1.1 | 53 | 93 | 95+ |
| 2 | Jonesville | 2.4 | 71 | 7 | 95+ |
| 3 | Jackson Lumen Christi | 2.5 | 73 | 95+ | |
| 4 | Hillsdale | 4.2 | 152 | ||
| 5 | Brooklyn Columbia Central | 5.9 | 177 | ||
| 6 | Hudson | 6.0 | 178 | ||
| 7 | Onsted | 7.8 | 196 | ||
| 8 | Adrian Madison | 7.9 | 197 | ||
| 9 | Bronson | 8.1 | 199 | ||
| 10 | Homer | 9.5 | 214 | ||
| 11 | Napoleon | 11.2 | 239 | ||
| 12 | Sand Creek | 11.4 | 240 | ||
| 13 | Michigan Center | 13.0 | 349 | ||
| 14 | Quincy | 14.0 | 405 |
| Projected Place | Grade | Name | Team | Avg. Place |
| 1 | 11 | Isaiah Dinverno | Jackson Lumen Christi | 1.1 |
| 2 | 11 | Mitchell Hiatt | Onsted | 2.1 |
| 3 | 11 | Landen Boulis | Hanover-Horton | 4.3 |
| 4 | 12 | Evan Shepherd | Hanover-Horton | 4.6 |
| 5 | 12 | Gavin VanKampen | Jonesville | 5.2 |
| 6 | 12 | Nolan Grant | Hillsdale | 6.1 |
| 7 | 12 | Gannon Shore | Jackson Lumen Christi | 6.9 |
| 8 | 9 | Caleb Blonde | Jonesville | 7.3 |
| 9 | 12 | Alex Czeiszperger | Hudson | 9.3 |
| 10 | 10 | Zach Hassenzahl | Hanover-Horton | 11.4 |
| 11 | 10 | John Edler | Homer | 11.4 |
| 12 | 10 | Gibson Shore | Jackson Lumen Christi | 14.0 |
| 13 | 10 | Nicholas Fowler | Jonesville | 14.7 |
| 14 | 12 | Owen Brown | Hanover-Horton | 14.8 |
| 15 | 9 | Logan Youngman | Hillsdale | 15.4 |
| 16 | 12 | Kyler Pequet | Napoleon | 16.3 |
| 17 | 9 | Cooper Flick | Hanover-Horton | 18.3 |
| 18 | 11 | Jack Gorton | Brooklyn Columbia Central | 19.9 |
| 19 | 10 | Trenton Fetter | Adrian Madison | 19.9 |
| 20 | 11 | Isaac St. John | Hudson | 20.5 |
| 21 | 12 | David Fowler | Jonesville | 21.9 |
| 22 | 9 | Avery Morrow | Jackson Lumen Christi | 22.0 |
| 23 | 9 | Silas Daniels | Sand Creek | 24.9 |
| 24 | 9 | Collin Fucile | Jonesville | 25.2 |
| 25 | 10 | Paul McClure | Adrian Madison | 25.9 |
| 26 | 10 | Wyatt Vowell | Brooklyn Columbia Central | 26.7 |
| 27 | 11 | James Bayes | Onsted | 27.0 |
| 28 | Rocky Bolton | Jackson Lumen Christi | 29.4 | |
| 29 | 12 | Caleb Dickinson | Homer | 30.3 |
| 30 | 11 | Owen Lambarth | Brooklyn Columbia Central | 30.8 |

Any Intriguing Battles?
Another thing to add to the list of Michigan XC Maxims (St. Louis comes through at the end of the year, watch out for Pinckney at Portage, always believe in Sal’s Magic) is to always count on Hanover-Horton. Ranked outside the top-10 to begin the year, the Comets have been a steady presence in the upper echelon of the D3 rankings.But beware, Jonesville is living up to those rankings, winning the Cascades Conference thanks to a huge performance from David Fowler. Lingering a bit behind the two were the Lumen Christi boys, but I always feel like the LC teams live on the Sharp Park course.

2 thoughts on “2023 Regional Projections: Sharp Park Regional”