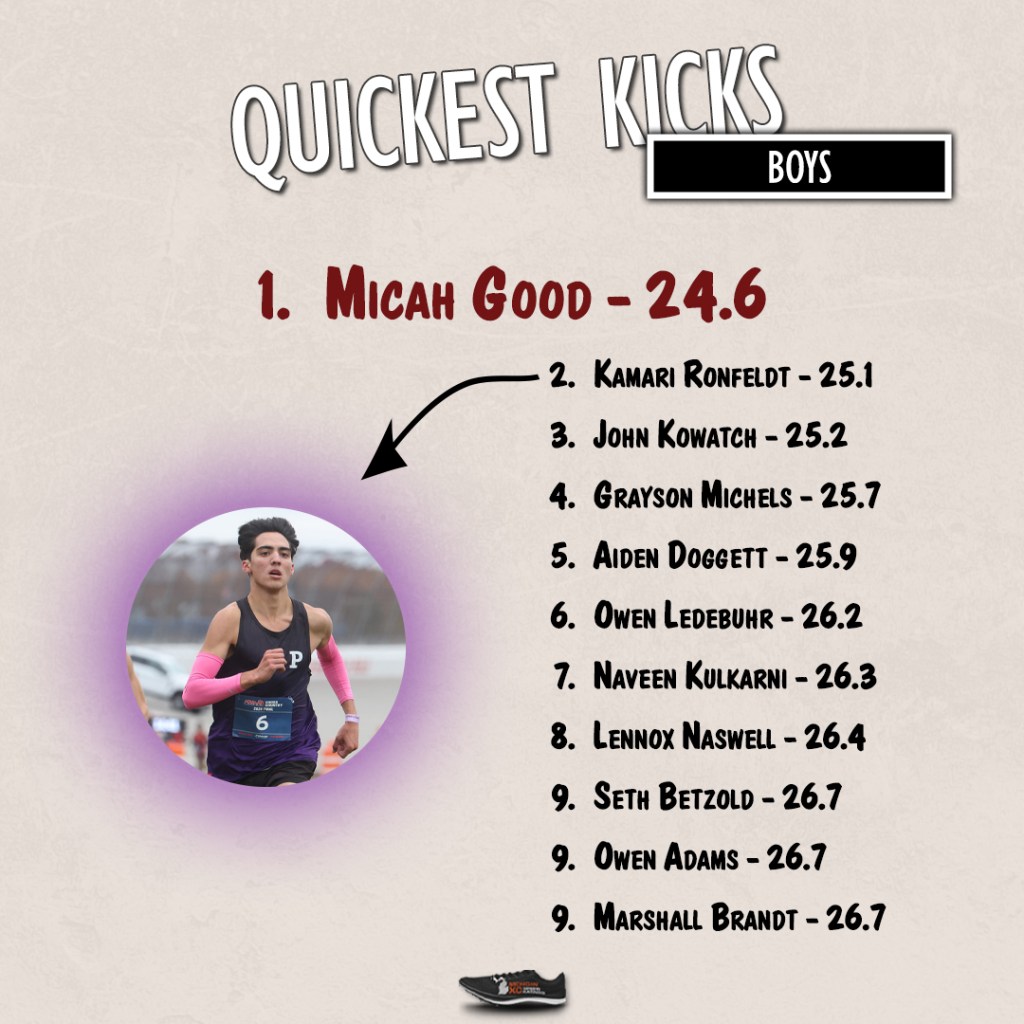
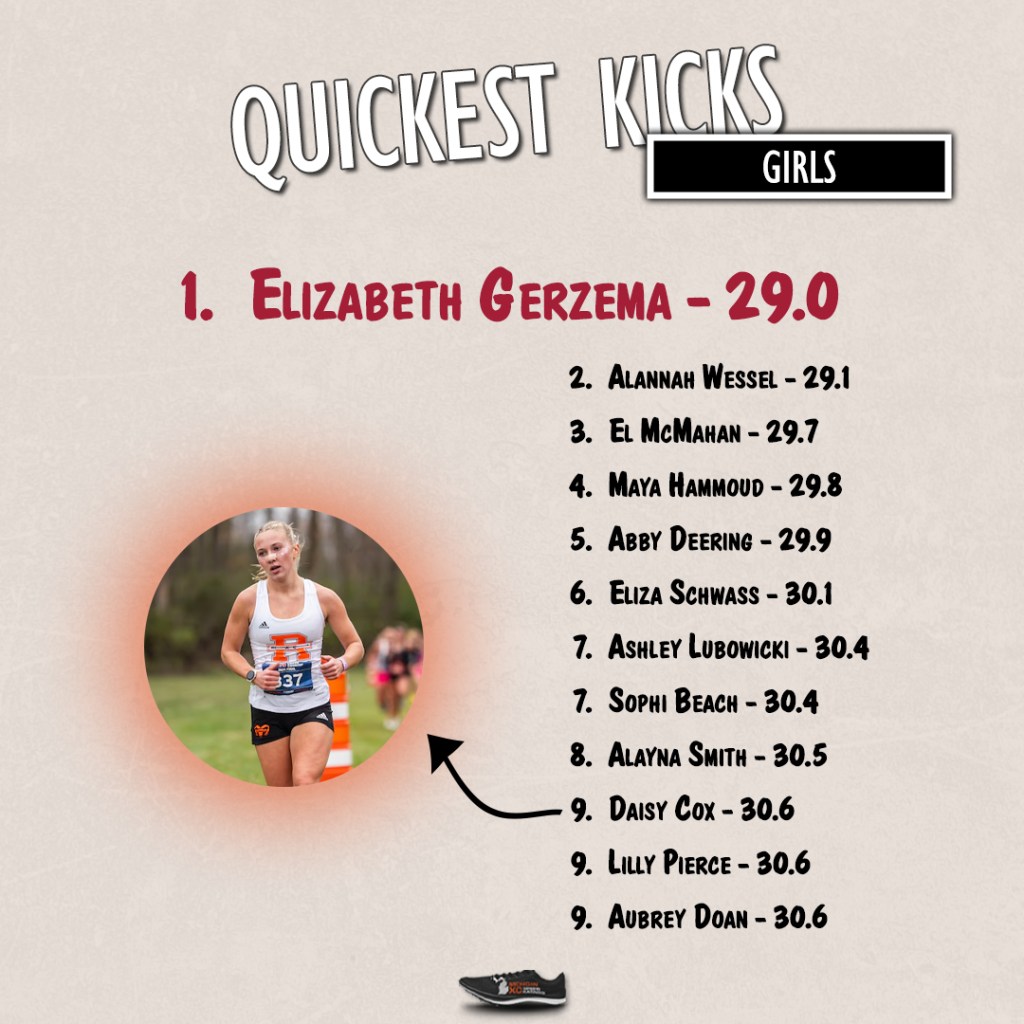
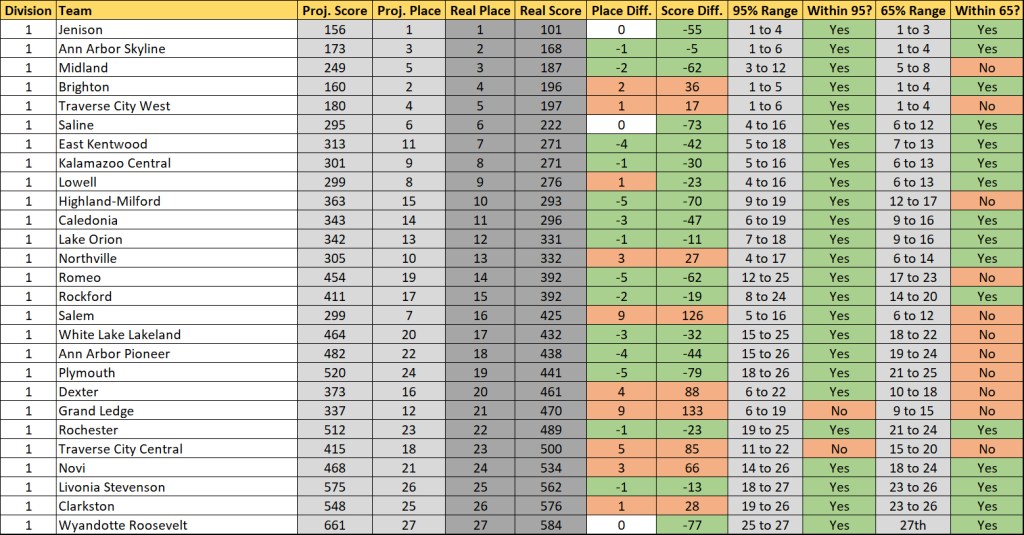
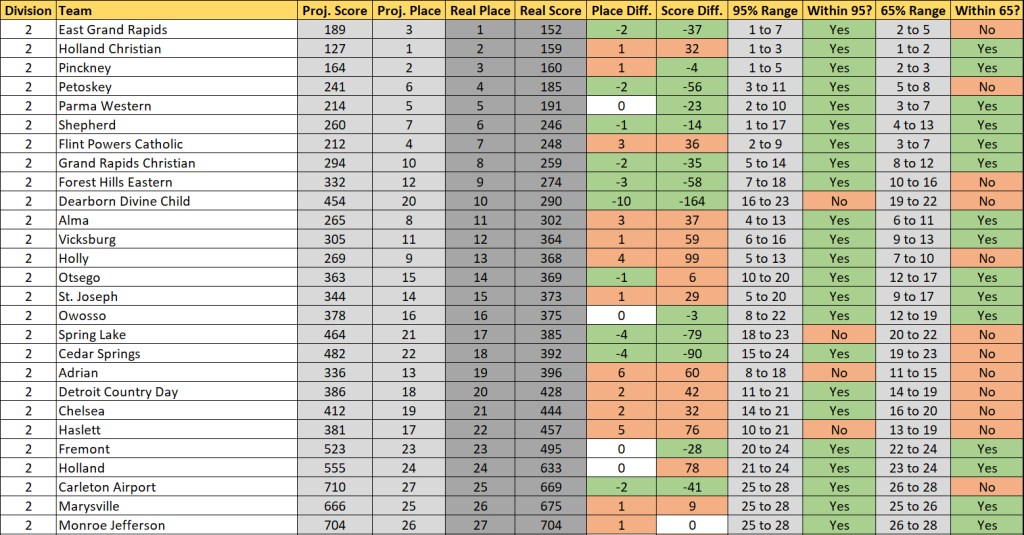
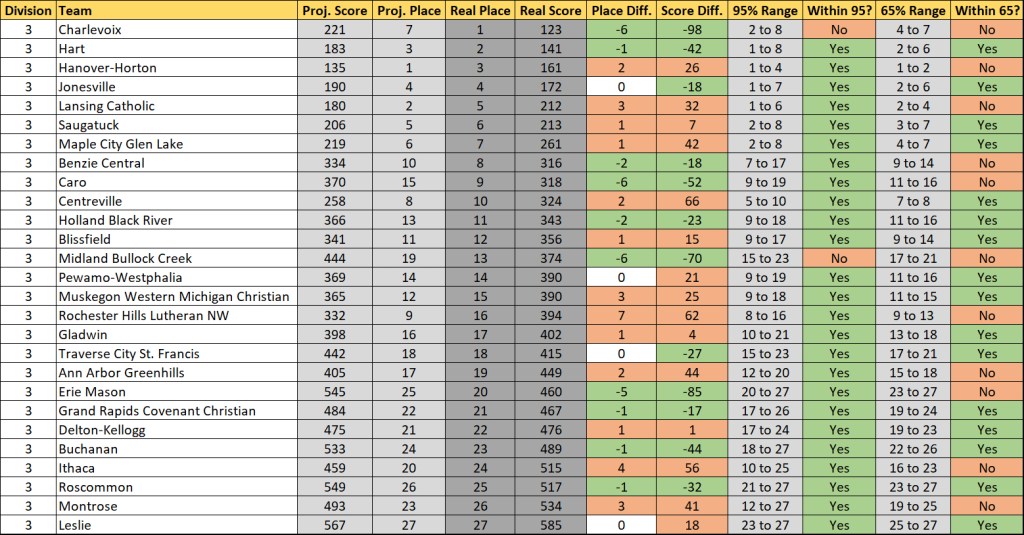
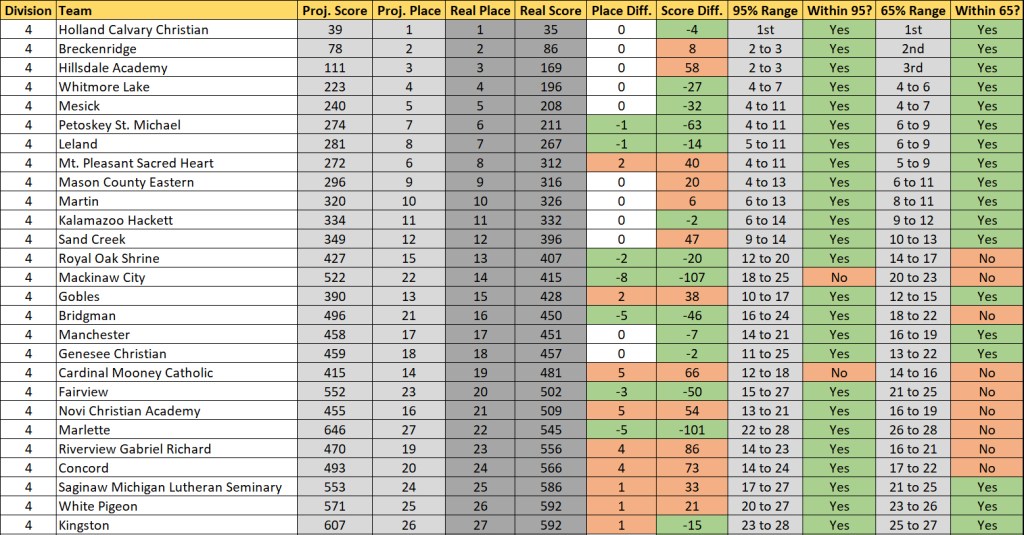
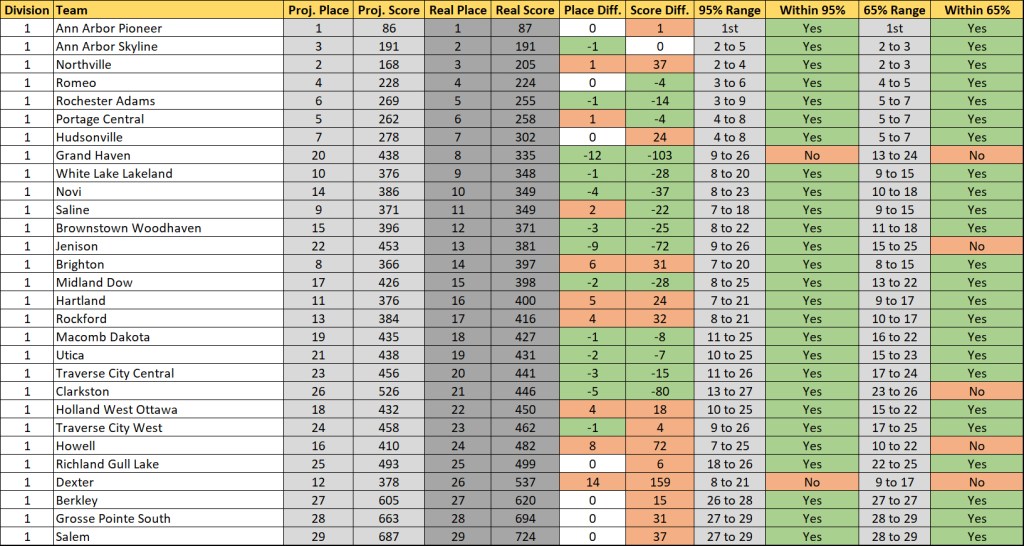
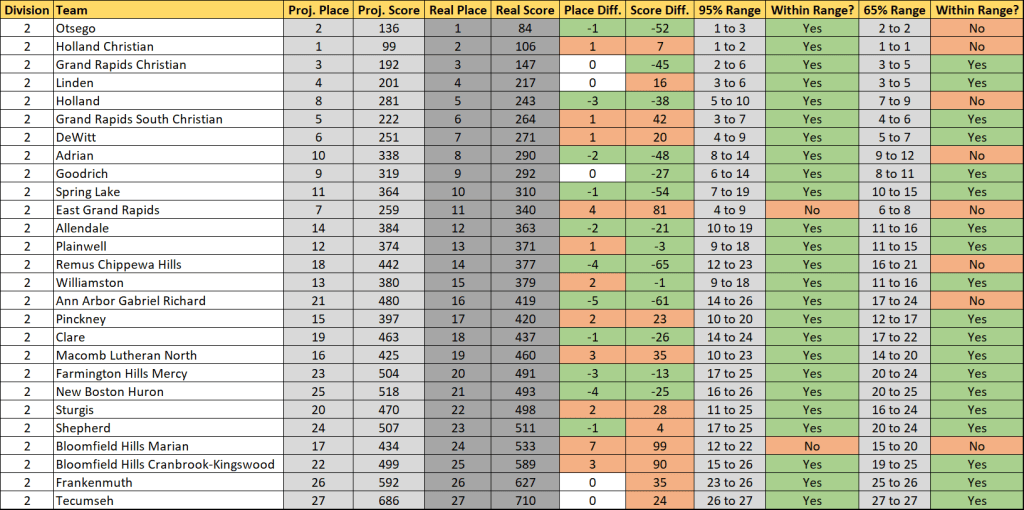
I thought I’d go about State Finals coverage in a different manner than years past. In recent years, I’ve done long, detailed posts about each division, each race. These would contain all the stats, ratings, and a lengthy writeup. This fall and winter will be a bit of a change. I’ll knock out all the random stats first, then dive into writeups about the winners. Hopefully this will be livelier and faster.
First was the Quickest Kicks, now Perfectly Paced. I took the average pace for each runner and noted each split, then added up the total difference between that average pace and the individual splits. Yes, I realize that the final kick has an impact on the overall pace. But I feel that running even-paced through three gives a greater chance for a runner to sprint to the line.
Top-10 on the graphics, top-50 on the charts.
Now that MITCA has come and passed, I’ll actually have free time to dedicate to writing and rating.
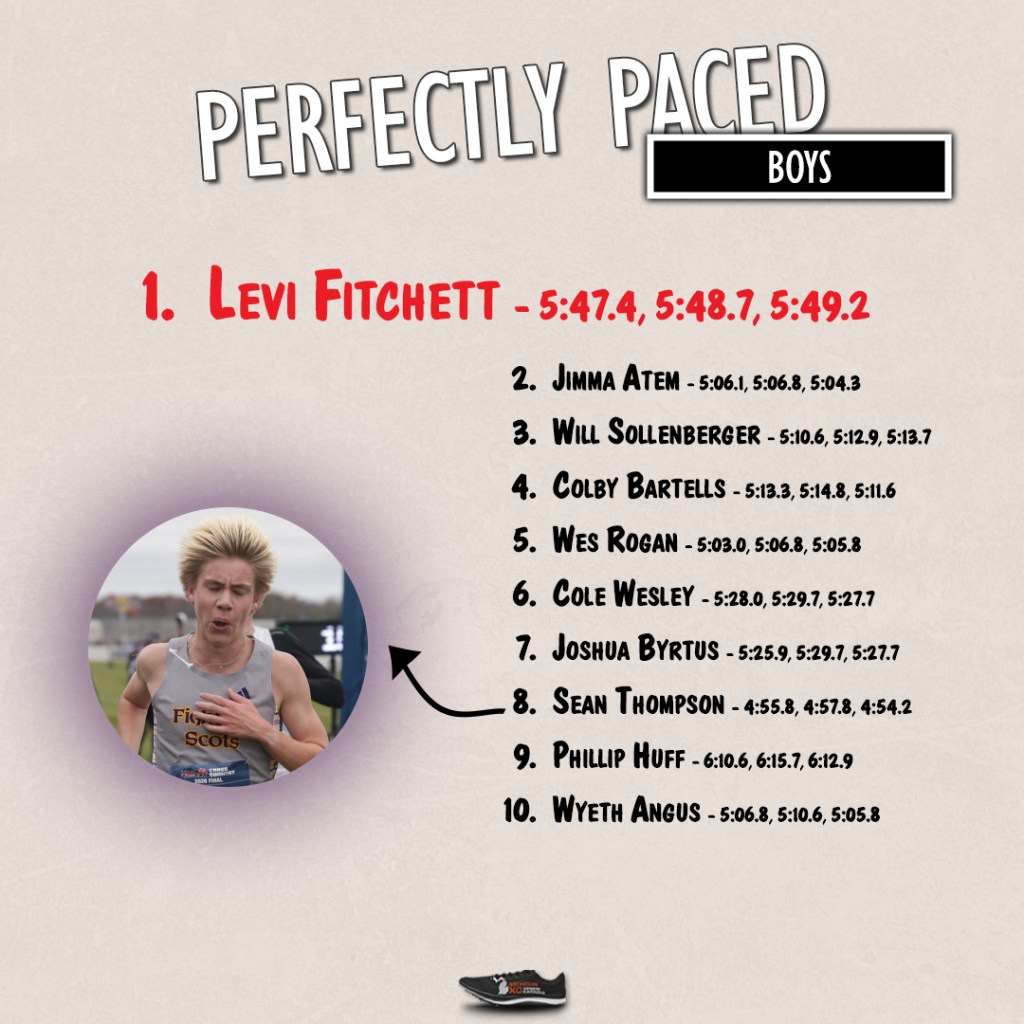
| Division | Grade | Name | Finish | Finish Pace | Team | 1st Mile | 2nd Mile | 3rd Mile | Total Diff. |
| 4 | 11 | Levi Fitchett | 18:00.8 | 5:47.9 | Dryden | 5:47.4 | 5:48.7 | 5:49.2 | 2.6 |
| 1 | 12 | Jimma Atem | 15:52.1 | 5:06.4 | East Kentwood | 5:06.1 | 5:06.8 | 5:04.3 | 2.8 |
| 1 | 10 | Will Sollenberger | 16:10.9 | 5:12.5 | Saline | 5:10.6 | 5:12.9 | 5:13.7 | 3.5 |
| 1 | 11 | Colby Bartells | 16:12.3 | 5:12.9 | Kalamazoo Central | 5:13.3 | 5:14.8 | 5:11.6 | 3.6 |
| 1 | 11 | Wes Rogan | 15:50.4 | 5:05.9 | Saline | 5:03.0 | 5:06.8 | 5:05.8 | 3.9 |
| 4 | 11 | Cole Wesley | 16:56.6 | 5:27.2 | Petoskey St. Michael | 5:28.0 | 5:29.7 | 5:27.9 | 4.0 |
| 2 | 11 | Joshua Byrtus | 16:56.3 | 5:27.1 | Holly | 5:25.9 | 5:29.7 | 5:27.7 | 4.4 |
| 1 | 11 | Sean Thompson | 15:15.2 | 4:54.6 | Caledonia | 4:55.8 | 4:57.8 | 4:54.2 | 4.8 |
| 4 | 8 | Phillip Huff | 19:18.5 | 6:12.9 | Genesee Christian | 6:10.6 | 6:15.7 | 6:12.9 | 5.1 |
| 2 | 12 | Wyeth Angus | 15:54.9 | 5:07.3 | Chelsea | 5:06.8 | 5:10.6 | 5:05.8 | 5.3 |
| 1 | 11 | Landon Seiloff | 16:33.3 | 5:19.7 | Lansing Waverly | 5:17.9 | 5:20.3 | 5:22.7 | 5.4 |
| 1 | 11 | Marcus Essling | 15:45.1 | 5:04.2 | Portage Central | 5:03.4 | 5:06.4 | 5:06.8 | 5.6 |
| 3 | 11 | Channing Rougeau | 16:36.4 | 5:20.7 | Jonesville | 5:19.4 | 5:24.2 | 5:21.7 | 5.8 |
| 1 | 12 | Jack Klein | 16:07.6 | 5:11.4 | Saline | 5:10.5 | 5:14.3 | 5:09.4 | 5.8 |
| 1 | 9 | Gabriel Kalinowski | 16:35.5 | 5:20.4 | Highland-Milford | 5:19.0 | 5:21.0 | 5:24.3 | 5.9 |
| 1 | 11 | Todd Tobin Jr | 15:35.3 | 5:01.0 | Highland-Milford | 5:00.6 | 5:05.0 | 5:02.8 | 6.2 |
| 2 | 11 | Ashton Fink | 15:30.7 | 4:59.5 | Grand Rapids Christian | 4:57.8 | 5:01.1 | 5:02.5 | 6.3 |
| 2 | 12 | Elias DeJong | 16:49.6 | 5:24.9 | Grand Rapids Christian | 5:25.5 | 5:29.8 | 5:26.1 | 6.6 |
| 3 | 11 | Silas Ackley | 16:12.0 | 5:12.8 | Hart | 5:10.8 | 5:16.5 | 5:14.5 | 7.4 |
| 2 | 11 | Cole Heikka | 15:50.0 | 5:05.8 | Holly | 5:10.3 | 5:07.4 | 5:04.5 | 7.4 |
| 1 | 11 | Bennett Snapper | 16:26.5 | 5:17.5 | Caledonia | 5:14.0 | 5:20.1 | 5:19.1 | 7.7 |
| 1 | 11 | Sebastian Azar | 16:15.2 | 5:13.9 | Anchor Bay | 5:11.0 | 5:18.9 | 5:14.2 | 8.2 |
| 3 | 12 | Atticus Boeve | 17:12.7 | 5:32.4 | Fennville | 5:31.3 | 5:37.9 | 5:30.5 | 8.5 |
| 1 | 12 | Max Carne | 16:13.7 | 5:13.4 | Ann Arbor Pioneer | 5:12.3 | 5:19.1 | 5:11.7 | 8.5 |
| 2 | 12 | Alex Ten Haken | 16:30.8 | 5:18.9 | Hudsonville Unity Christian | 5:16.3 | 5:22.1 | 5:21.7 | 8.6 |
| 2 | 12 | Broden Ladd | 15:51.7 | 5:06.3 | Holly | 5:08.2 | 5:02.9 | 5:10.4 | 9.4 |
| 1 | 12 | Braylon Morris | 16:47.4 | 5:24.2 | East Kentwood | 5:19.5 | 5:26.1 | 5:27.1 | 9.5 |
| 1 | 9 | Jack Klein | 16:10.4 | 5:12.3 | White Lake Lakeland | 5:10.0 | 5:16.7 | 5:15.2 | 9.6 |
| 2 | 12 | Reeve Oberman | 16:01.2 | 5:09.4 | Petoskey | 5:06.2 | 5:13.4 | 5:12.4 | 10.2 |
| 1 | 10 | Bryson Hassevoort | 15:59.3 | 5:08.8 | Zeeland West | 5:05.3 | 5:14.9 | 5:09.4 | 10.2 |
| 1 | 12 | Grant Feldpausch | 16:55.7 | 5:26.9 | Caledonia | 5:23.7 | 5:33.2 | 5:27.8 | 10.4 |
| 1 | 12 | Zach McGee | 15:58.8 | 5:08.6 | Lake Orion | 5:05.5 | 5:15.7 | 5:08.4 | 10.4 |
| 4 | 9 | Grady Hanes | 17:11.5 | 5:32.0 | Petoskey St. Michael | 5:28.2 | 5:36.9 | 5:33.7 | 10.4 |
| 1 | 12 | Cameron Varner | 16:34.5 | 5:20.1 | Temperance Bedford | 5:15.6 | 5:25.0 | 5:21.1 | 10.4 |
| 1 | 11 | Declan Duch | 16:11.0 | 5:12.5 | Jenison | 5:10.3 | 5:20.5 | 5:12.8 | 10.5 |
| 1 | 12 | Jack MacGregor | 15:04.5 | 4:51.1 | Howell | 4:46.1 | 4:55.6 | 4:52.2 | 10.6 |
| 3 | 11 | Timothy Wolff | 16:29.9 | 5:18.6 | Hart | 5:16.0 | 5:22.9 | 5:22.3 | 10.6 |
| 3 | 9 | Aidan Jorae | 18:12.1 | 5:51.5 | Ithaca | 5:48.6 | 5:53.0 | 5:57.7 | 10.6 |
| 1 | 11 | Graham Kusmierski | 16:11.7 | 5:12.7 | Grandville | 5:17.0 | 5:15.5 | 5:09.1 | 10.7 |
| 1 | 12 | Nick Martens | 16:36.5 | 5:20.7 | Dexter | 5:21.2 | 5:26.0 | 5:15.8 | 10.7 |
| 1 | 11 | Jake Potgeter | 16:28.4 | 5:18.1 | Caledonia | 5:14.3 | 5:22.7 | 5:20.4 | 10.7 |
| 4 | 11 | Peter Winn | 17:21.8 | 5:35.3 | Hillsdale Academy | 5:31.0 | 5:36.2 | 5:40.8 | 10.7 |
| 3 | 10 | Dutch Smith | 17:14.0 | 5:32.8 | Ithaca | 5:29.9 | 5:39.5 | 5:31.7 | 10.7 |
| 1 | 11 | Xavier Solgot | 14:59.4 | 4:49.5 | L’Anse Creuse North | 4:45.7 | 4:53.7 | 4:46.6 | 10.9 |
| 1 | 12 | Vern Clyne | 16:29.0 | 5:18.3 | Clarkston | 5:14.6 | 5:20.3 | 5:23.5 | 10.9 |
| 1 | 10 | Ripley Clor | 16:08.3 | 5:11.7 | Romeo | 5:07.2 | 5:17.3 | 5:12.5 | 10.9 |
| 1 | 12 | Samuel Baker | 14:54.0 | 4:47.7 | Kalamazoo Central | 4:46.2 | 4:53.6 | 4:44.1 | 11.0 |
| 1 | 12 | Brandon Cloud | 14:51.2 | 4:46.8 | Northville | 4:45.7 | 4:53.6 | 4:43.6 | 11.1 |
| 3 | 12 | William Ready | 16:05.7 | 5:10.8 | Traverse City St. Francis | 5:08.1 | 5:19.1 | 5:10.5 | 11.3 |
| 3 | 11 | Michael Allen | 16:30.7 | 5:18.9 | Montrose | 5:15.1 | 5:22.7 | 5:22.6 | 11.3 |
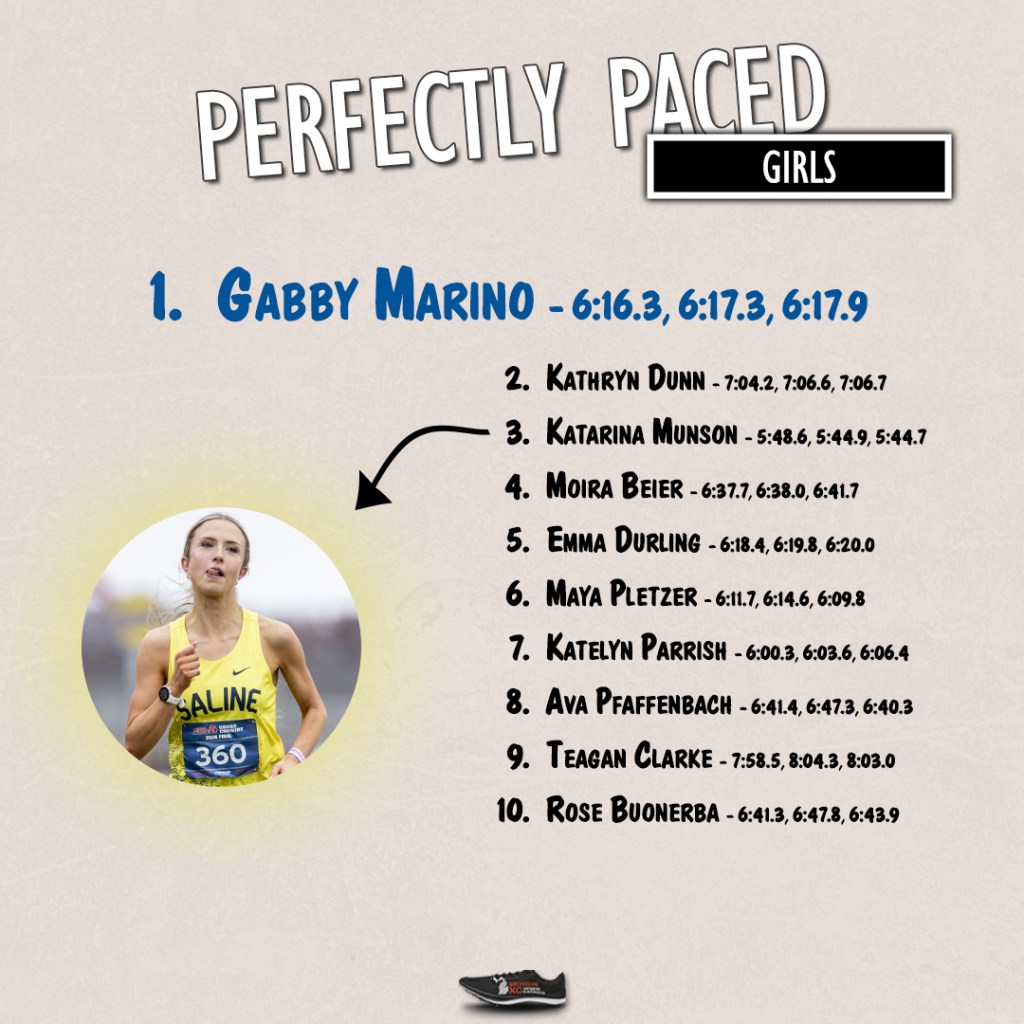
| Division | Grade | Name | Finish | Finish Pace | Team | 1st Mile | 2nd Mile | 3rd Mile | Total Diff. |
| 1 | 12 | Gabby Marino | 19:31.7 | 6:17.1 | White Lake Lakeland | 6:16.3 | 6:17.3 | 6:17.9 | 1.8 |
| 2 | 10 | Kathryn Dunn | 22:00.0 | 7:04.8 | Chelsea | 7:04.2 | 7:06.6 | 7:06.7 | 4.3 |
| 1 | 12 | Katarina Munson | 17:53.7 | 5:45.6 | Saline | 5:48.6 | 5:44.9 | 5:44.7 | 4.6 |
| 4 | 12 | Moira Beier | 20:35.2 | 6:37.6 | Hillsdale Academy | 6:37.7 | 6:38.0 | 6:41.7 | 4.7 |
| 2 | 10 | Emma Durling | 19:33.5 | 6:17.7 | Linden | 6:18.4 | 6:19.8 | 6:20.0 | 5.1 |
| 1 | 12 | Maya Pletzer | 19:13.5 | 6:11.3 | White Lake Lakeland | 6:11.7 | 6:14.6 | 6:09.8 | 5.2 |
| 1 | 12 | Katelyn Parrish | 18:45.5 | 6:02.2 | Farmington | 6:00.3 | 6:03.6 | 6:06.4 | 7.5 |
| 2 | 12 | Ava Pfaffenbach | 20:45.4 | 6:40.8 | Ann Arbor Gabriel Richard | 6:41.4 | 6:47.3 | 6:40.3 | 7.6 |
| 4 | 12 | Teagan Clarke | 24:55.0 | 8:01.2 | Manchester | 7:58.5 | 8:04.3 | 8:03.0 | 7.6 |
| 2 | 12 | Rose Buonerba | 20:51.2 | 6:42.7 | Ann Arbor Gabriel Richard | 6:41.3 | 6:47.8 | 6:43.9 | 7.7 |
| 2 | 9 | Cecelia Merrick | 19:26.0 | 6:15.3 | Gaylord | 6:13.6 | 6:17.9 | 6:18.7 | 7.7 |
| 1 | 11 | Kylie Brown | 19:23.6 | 6:14.5 | Utica | 6:12.2 | 6:19.2 | 6:15.3 | 7.8 |
| 1 | 11 | Alannah Wessel | 17:57.5 | 5:46.8 | Romeo | 5:49.1 | 5:49.8 | 5:49.5 | 8.0 |
| 2 | 10 | Brooklyn Takagishi | 19:45.6 | 6:21.6 | DeWitt | 6:23.5 | 6:26.6 | 6:20.5 | 8.0 |
| 1 | 12 | Genevieve Connolly | 19:23.1 | 6:14.3 | White Lake Lakeland | 6:11.6 | 6:14.9 | 6:19.2 | 8.2 |
| 1 | 10 | Claire Lawrence | 18:09.4 | 5:50.6 | Bloomfield Hills | 5:49.1 | 5:56.5 | 5:49.8 | 8.2 |
| 1 | 10 | Ruby Hoffmann | 18:44.2 | 6:01.8 | Hartland | 6:01.4 | 6:08.3 | 6:00.5 | 8.2 |
| 1 | 10 | Kylie Rennie | 19:30.8 | 6:16.8 | White Lake Lakeland | 6:20.3 | 6:20.7 | 6:15.7 | 8.5 |
| 2 | 11 | Danica Redes | 19:14.5 | 6:11.6 | Shepherd | 6:10.3 | 6:17.0 | 6:13.4 | 8.5 |
| 1 | 11 | Savannah Staton | 17:52.3 | 5:45.1 | Saline | 5:49.2 | 5:46.6 | 5:42.1 | 8.6 |
| 3 | 10 | Katherine Schafer | 19:48.7 | 6:22.6 | Pewamo-Westphalia | 6:22.2 | 6:26.2 | 6:27.5 | 8.9 |
| 1 | 12 | Avery DeGrendel | 18:27.7 | 5:56.5 | Clarkston | 5:53.7 | 6:02.6 | 5:56.6 | 9.0 |
| 2 | 10 | Conley Howard | 20:04.0 | 6:27.5 | Remus Chippewa Hills | 6:28.6 | 6:32.6 | 6:24.4 | 9.3 |
| 2 | 10 | Mia Hill | 20:16.2 | 6:31.4 | Allendale | 6:30.1 | 6:27.7 | 6:35.7 | 9.3 |
| 4 | 9 | Abigail Salamon | 24:09.3 | 7:46.5 | Southfield Christian | 7:44.9 | 7:53.8 | 7:45.8 | 9.6 |
| 1 | 10 | Emma Storey | 18:46.6 | 6:02.6 | Jenison | 5:59.6 | 6:08.4 | 6:03.5 | 9.7 |
| 2 | 9 | Kennedy Kolodica | 19:32.3 | 6:17.3 | Linden | 6:20.0 | 6:21.4 | 6:14.2 | 9.9 |
| 1 | 10 | Abby Deering | 18:45.8 | 6:02.3 | Rochester Adams | 6:05.5 | 6:08.7 | 6:01.7 | 10.2 |
| 1 | 12 | Claire Pikal | 19:50.6 | 6:23.2 | Waterford Kettering | 6:23.1 | 6:31.6 | 6:21.5 | 10.2 |
| 1 | 9 | Lara Souza | 19:25.8 | 6:15.2 | Portage Central | 6:13.3 | 6:23.2 | 6:14.8 | 10.3 |
| 1 | 11 | Claire Galas | 18:36.5 | 5:59.3 | Novi | 5:56.2 | 6:02.8 | 6:03.1 | 10.4 |
| 2 | 11 | Julia Bambach | 17:33.9 | 5:39.2 | Holly | 5:34.2 | 5:40.2 | 5:43.9 | 10.7 |
| 1 | 12 | Isla Tharp | 17:48.0 | 5:43.7 | Ann Arbor Skyline | 5:44.6 | 5:50.9 | 5:41.0 | 10.8 |
| 2 | 9 | Annabel Buggia | 17:57.5 | 5:46.8 | Williamston | 5:43.9 | 5:54.4 | 5:46.3 | 11.0 |
| 2 | 11 | Maggie Scholma | 19:24.5 | 6:14.8 | Grand Rapids Christian | 6:11.6 | 6:22.1 | 6:15.4 | 11.1 |
| 4 | 12 | Veronica Paga | 19:58.6 | 6:25.8 | Petoskey St. Michael | 6:22.2 | 6:25.9 | 6:33.3 | 11.2 |
| 2 | 12 | Alivia Ottinger | 18:18.2 | 5:53.5 | Goodrich | 5:50.4 | 5:58.3 | 5:56.8 | 11.2 |
| 2 | 9 | Quinn Killian | 20:02.7 | 6:27.1 | Remus Chippewa Hills | 6:24.6 | 6:35.4 | 6:27.6 | 11.3 |
| 4 | 9 | Norah Tracy | 20:43.4 | 6:40.2 | Hillsdale Academy | 6:37.1 | 6:41.8 | 6:46.8 | 11.3 |
| 1 | 12 | Morgan Scally | 18:24.0 | 5:55.3 | White Lake Lakeland | 5:54.4 | 6:02.9 | 5:52.5 | 11.3 |
| 1 | 10 | Gretchen Oyer | 19:49.0 | 6:22.7 | Traverse City Central | 6:22.7 | 6:31.6 | 6:19.8 | 11.8 |
| 2 | 9 | Quinn Drake | 20:06.7 | 6:28.4 | Clare | 6:24.4 | 6:32.0 | 6:32.6 | 11.8 |
| 1 | 10 | Tessa Albrecht | 19:06.9 | 6:09.1 | Zeeland West | 6:05.6 | 6:17.1 | 6:08.7 | 11.9 |
| 4 | 12 | Madison Smith | 20:50.4 | 6:42.4 | Grand Traverse Academy | 6:37.2 | 6:42.3 | 6:49.0 | 11.9 |
| 2 | 12 | Lillian Dewey | 18:53.6 | 6:04.9 | Hopkins | 6:02.5 | 6:13.5 | 6:05.8 | 11.9 |
| 2 | 11 | Rory Doepker | 20:34.7 | 6:37.4 | DeWitt | 6:35.3 | 6:45.9 | 6:39.2 | 12.4 |
| 2 | 11 | Emma Stotzel | 20:16.7 | 6:31.6 | Clare | 6:30.4 | 6:40.1 | 6:28.8 | 12.5 |
| 3 | 11 | Takoda Holicki | 19:57.7 | 6:25.5 | Montrose | 6:22.9 | 6:31.8 | 6:29.1 | 12.5 |
| 1 | 10 | Eliza Selcer | 18:48.8 | 6:03.3 | Ann Arbor Pioneer | 6:00.9 | 6:10.6 | 6:06.3 | 12.7 |
| 2 | 11 | Avery Engbers | 17:29.6 | 5:37.8 | Holland Christian | 5:31.8 | 5:43.4 | 5:39.0 | 12.8 |