The goal for this summer’s preview is to be a bit more thorough and coherent. Usually I’m rushed and racing to get out content before the season begins, but I swear this year will be different! I’m starting a little earlier, I already performed a ton of the dirty work over the winter, and am as motivated as ever.
Anyhow, the plan is this:
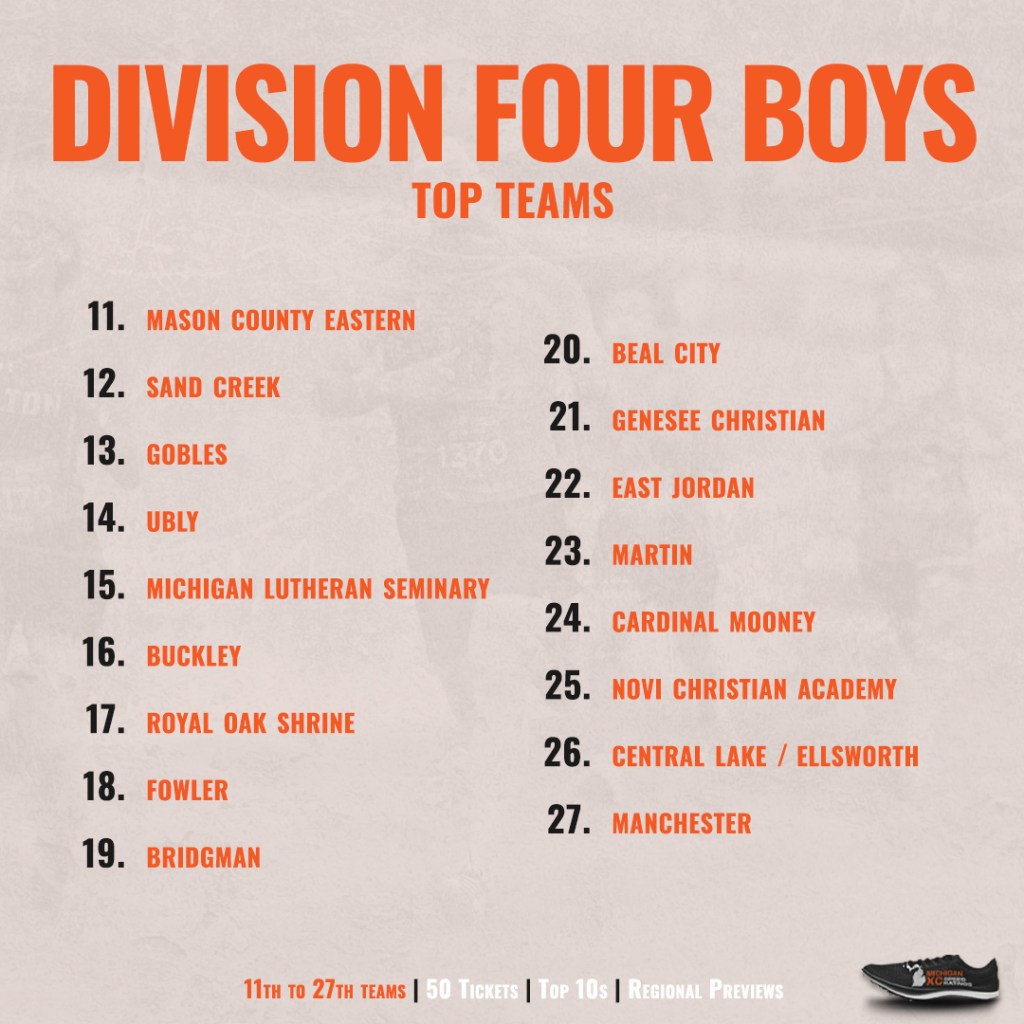
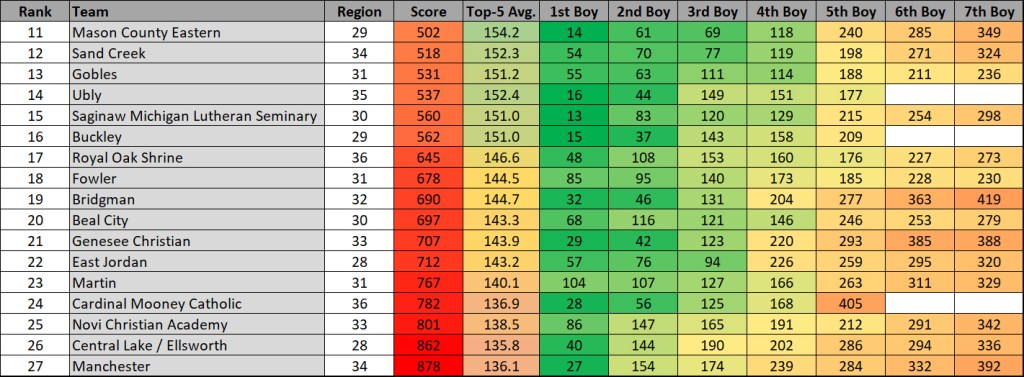
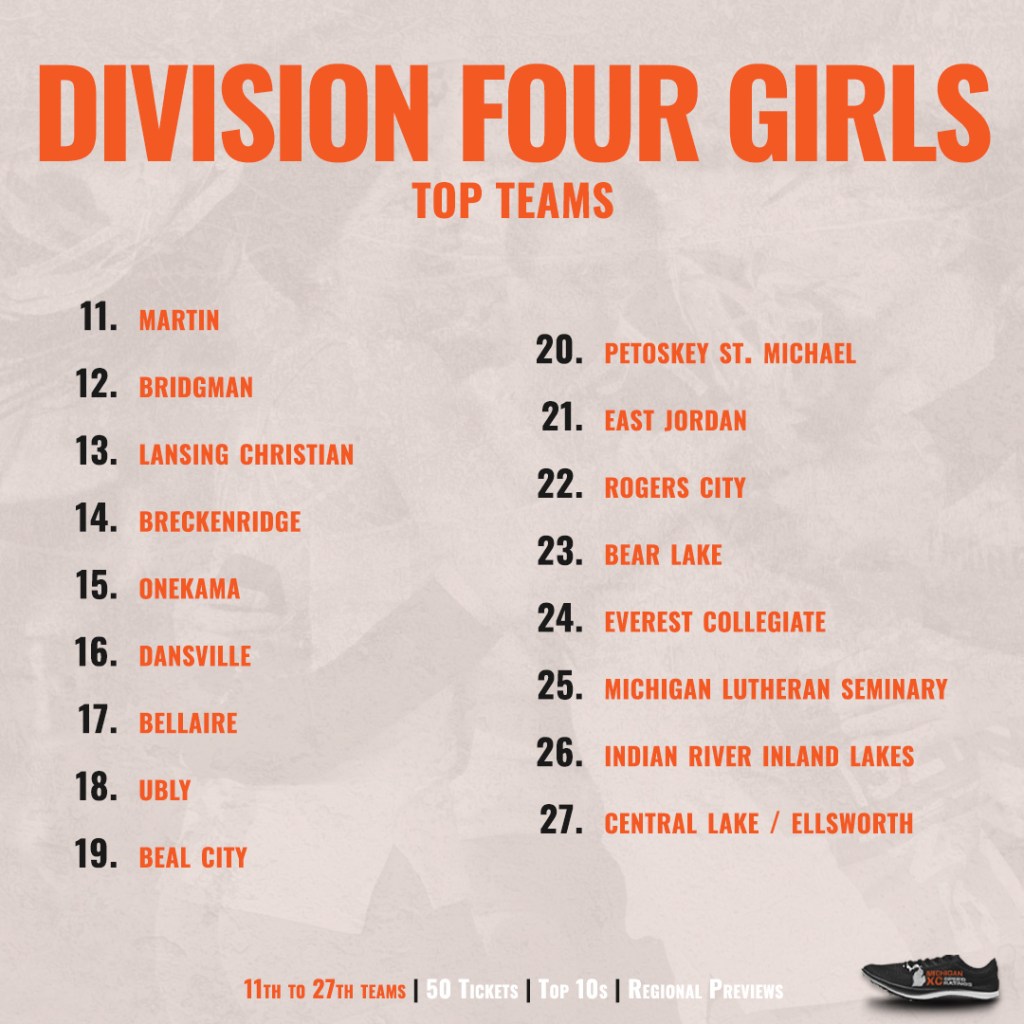
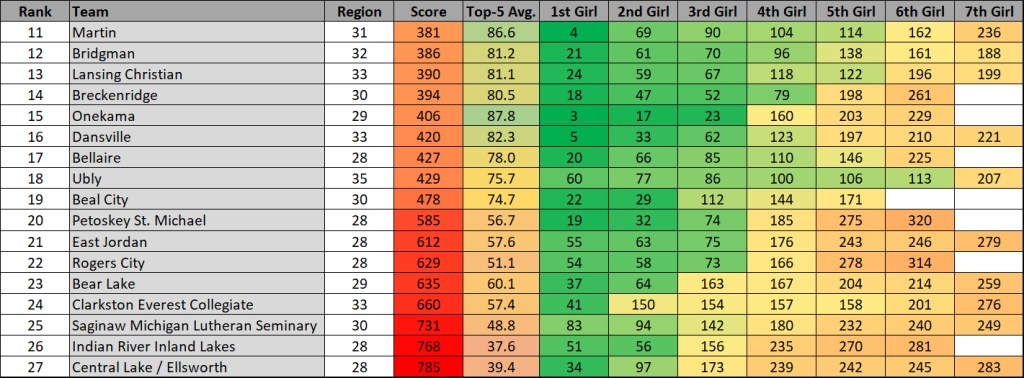
- Write a bit about teams ranked 11-27, D4 through D1
- Knock out the 50 Tickets
- Have more detailed posts about the Top 10 Teams
- Throw out the always controversial Regional Projections
- Hopefully have one all-encompassing post for each division (including the UP, which typically starts a little later than us trolls, so they’ll get their own two-week period in late August)
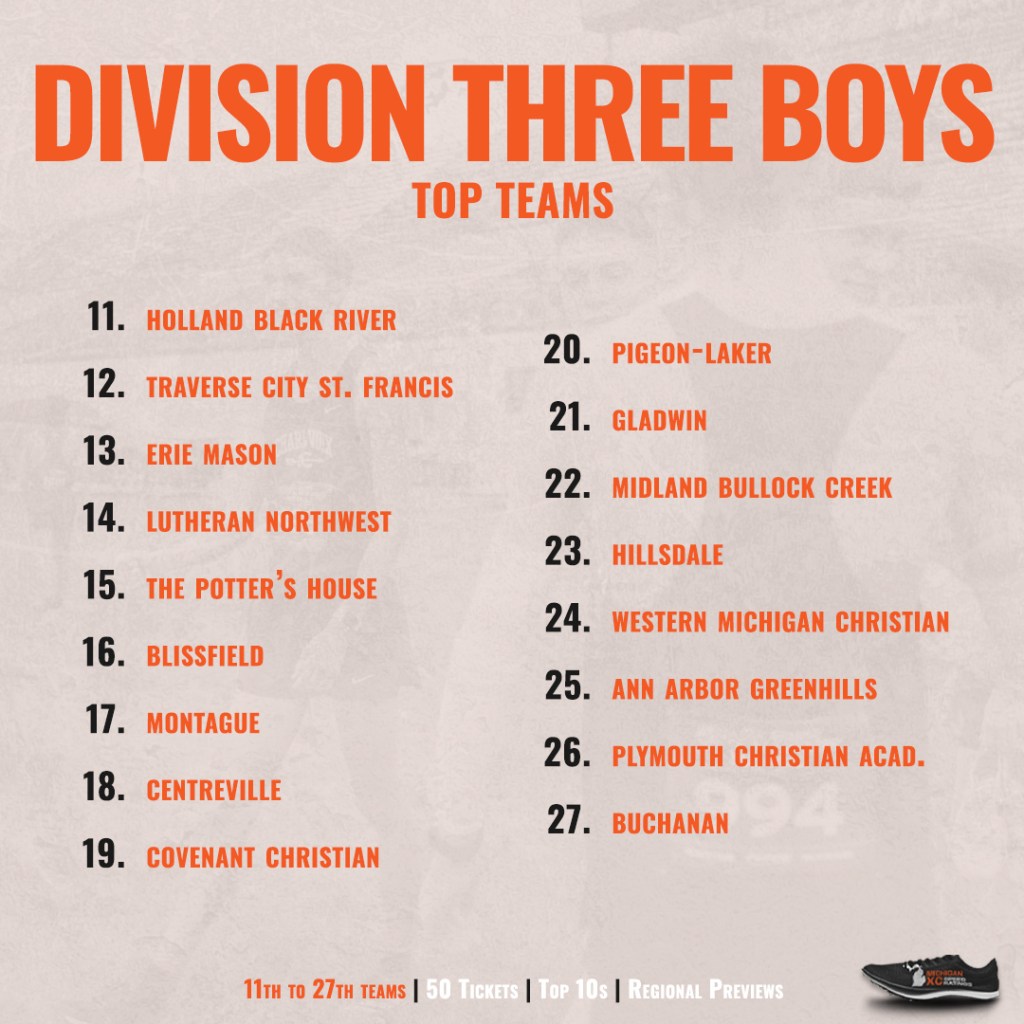
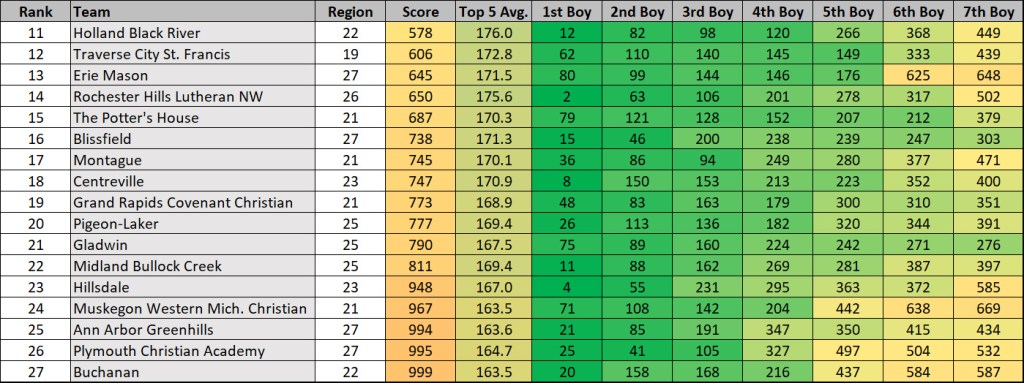
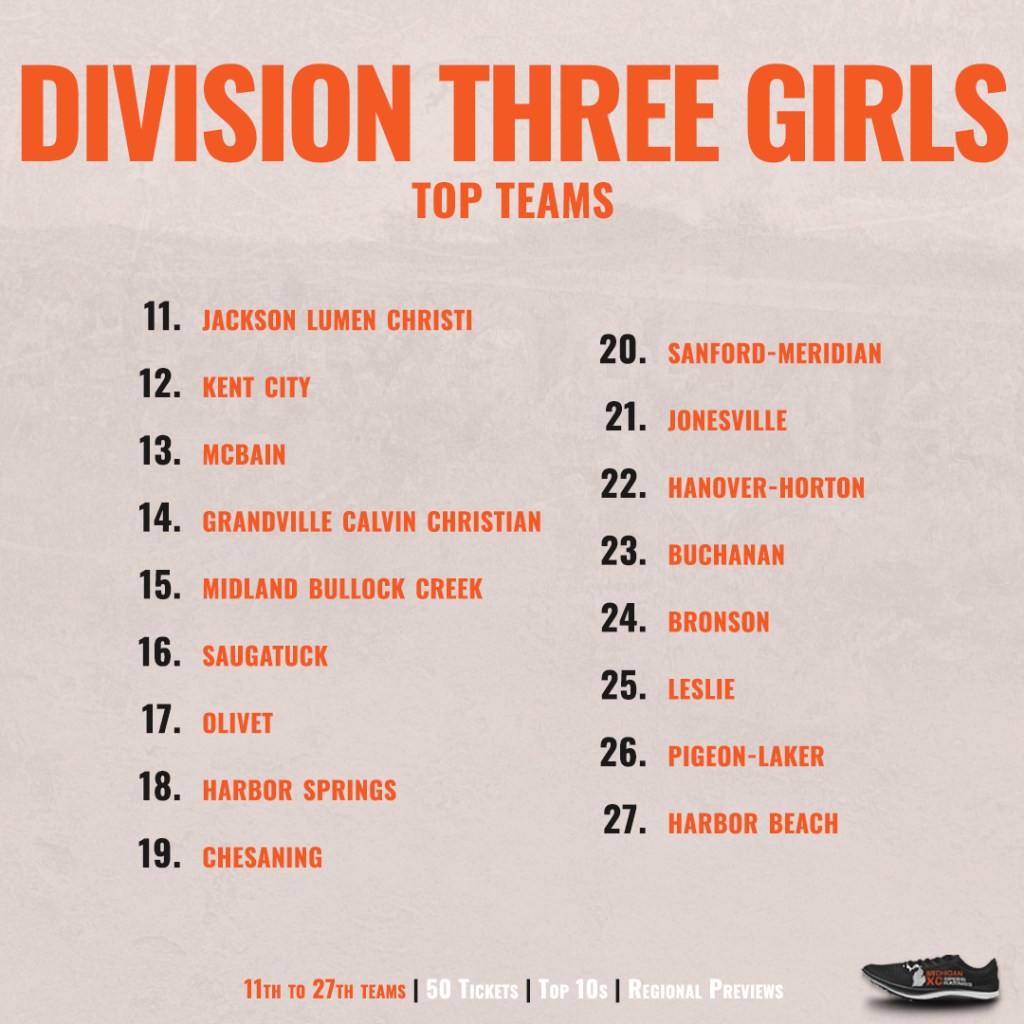
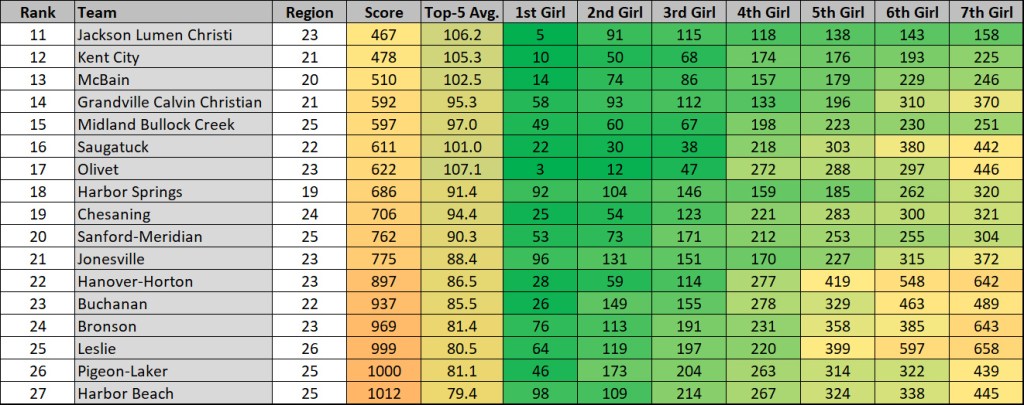
Why rank to 27? Well, unless there’s a 4th place team that qualifies out of a regional, there are 27 teams that compete at the Lower Peninsula State Finals.
These projections are based on a combination of last season’s ratings, projected improvements, and this past track season. They contain kids that ran XC in 2025, either for their high school or a middle school that typically feeds to that high school. Projecting D4 is always a little rough because of the smaller enrollments. My estimation is that there’s more recruiting from within the school and multi-sport athletes compared to other divisions. As a result, these likely miss out on athletes that could have a huge impact.
As always, these are for fun and a way to keep the best sport in the world on your mind through these summer months.
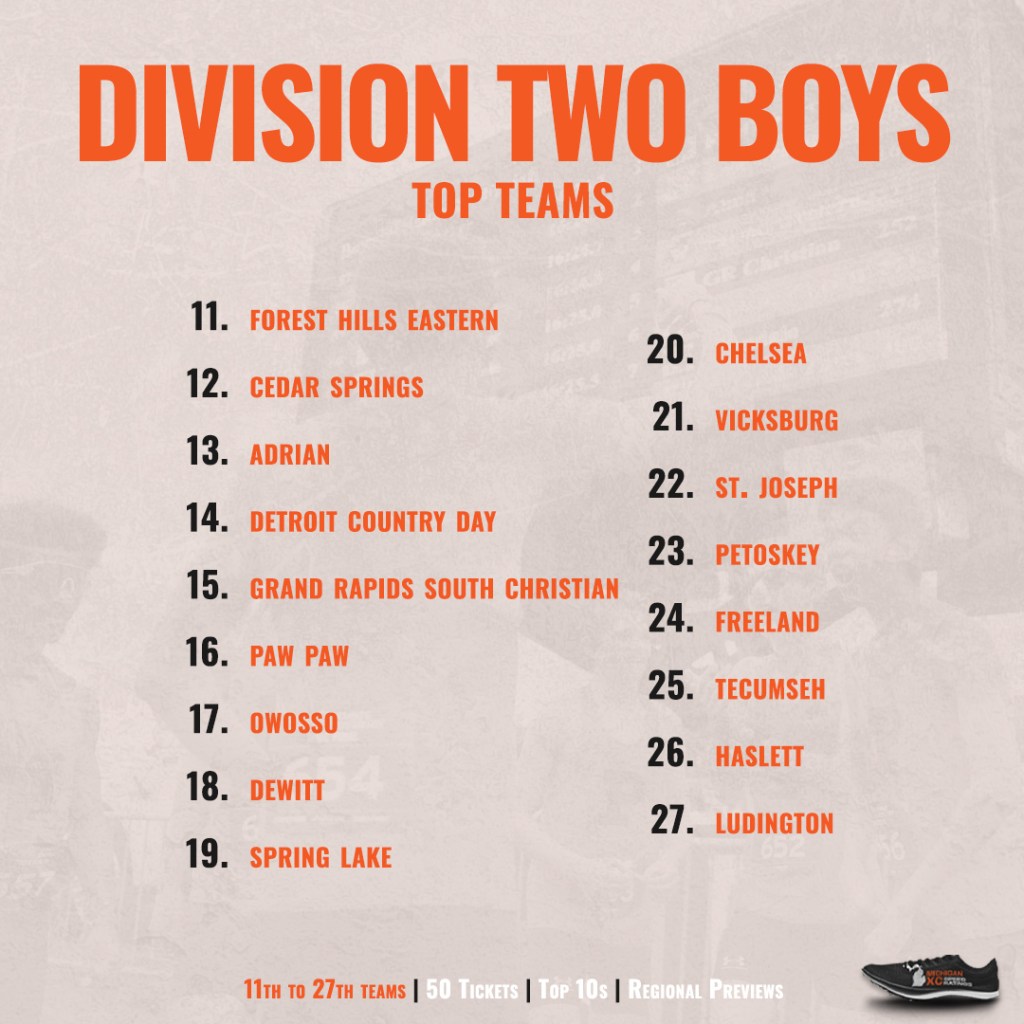
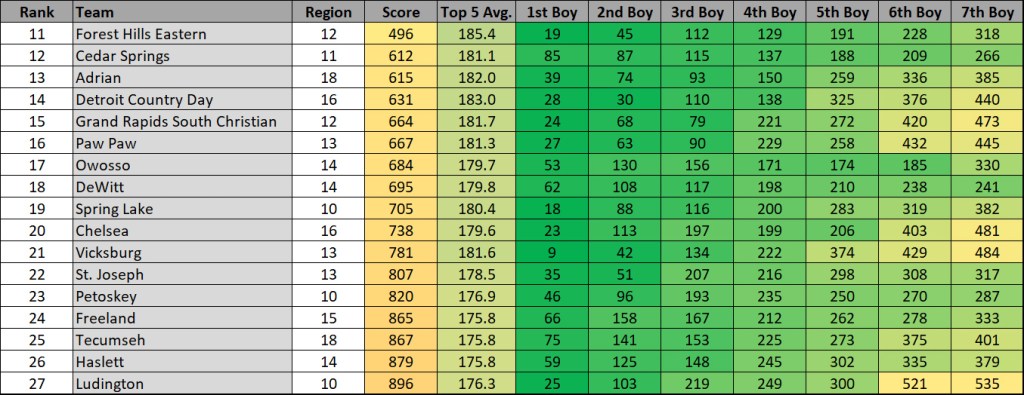
27-11
27. Ludington – Gabe Grierson leads the way for this west coast squad. The senior busted out a sub-16 last fall at Benzie to secure his first ever run at MIS.
26. Haslett – a solid team throughout, though ability to move up in the rankings may depend on freshmen – three of ‘em were 12-flat or faster at the MS level in 2025.
25. Tecumseh – a young squad brought to the forefront by the ’28 class, which contains four kids that were in the low-17’s or faster as sophomores.
24. Freeland – led by Ryan Brown, a burgeoning young talent that broke into the 16’s late last fall and completed a solid track season.
23. Petoskey – senior-laden and deep, coming off a track season where much improvement was found. Jack Frentz is the prime example, dropping over a minute from his 2025 best in the 3200m.
22. St. Joseph – headlined by a top-two that can compete with most. Seth Randall and Carson Wiersbe have both gotten into the very low-16’s and each were top-10 finishers from Region 13.
21. Vicksburg – Caiden Caswell is the star, but Vicksburg ain’t just one man. One of the better 2nd men of the division will hang in there for sure, as Hunter Smith always runs his best races come late October or early November.
20. Chelsea – year after year, the Bulldogs churn out teams and athletes. 2026 looks to be no different, with a team that could contend for a MIS spot. And Wyeth Angus, who broke into the 15’s in his final race of the year at MITCA.
19. Spring Lake – the Lakers are no stranger to success as well. Owen Adams is the low-stick, a kid that dropped nearly a minute from his sophomore best to place 3rd in Region 10 and step onto the podium at MIS.
18. DeWitt – pure quality through the Panther lineup, with 10+ athletes certainly capable of breaking into the 17’s.
17. Owosso – another team featuring many athletes with potential to run fast. Scroll down the roster and you have many candidates of sub-17 kids. One runner stands out, soon to be sophomore Leonidas Erfourth, who raced to the 11th fastest freshman 3200m mark in the state.
16. Paw Paw – three consistent runners don the Red Wolves singlets – Christopher Vogt, Landon Lindsay, and Grant Krause. All three were sub-17 in the fall and under 4:40 for the 1600m this past spring.
15. Grand Rapids South Christian – another team with a strong top-three. Ben Verlin and Josiah Rozema are the experienced seniors, each grinding over the course of three seasons for the Sailors. Hudson Kemper is the sophomore barely tapping into his talent, breaking 17:00 late in cross and racing a 4:36 in the 1600m this past spring.
14. Detroit Country Day – definitely a darkhorse for a top-10 spot, led by two boys with a real shot of making the podium. Omar Elbashir can handle the stage, having run one of the more wise races amongst his D2 competitors. Jack Hincks had a breakout track season, dropping his times from 4:50/10:31 to 4:30/9:47.
13. Adrian – Moises Salazar Jr. moves on, but the Maple train keeps chugging. Four Adrian returners were in the low-17’s or faster in ’25, ensuring a solid foundation for the SE Michigan squad.
12. Cedar Springs – pack running should be a major advantage for the RedHawks. Case in point: last year’s Region 10 where CS had the fastest fifth and sixth runners in the field. They bring back five of their six varsity runners from that race.
11. Forest Hills Eastern – the Hawks have depth and low-sticks and a culture hellbent on improvement. Grayson Michels surely has embraced that thought, dropping over a minute from his freshman best to run 16:28 last October.
Best Track Seasons
(some of the teams that improved the most from before track to now)
Petoskey
800m: 3 returners sub-2:20
1600m: 6 returners sub-5:00
3200m: 3 returners sub-11:00
Paw Paw
800m: 4 returners sub-2:15
1600m: 4 returners sub-5:00
3200m: 3 returners sub-11:00
Adrian
800m: 7 returners sub-2:15
1600m: 5 returners sub-5:00
3200m: 3 returners sub-11:00
2025 State Finals
8th – Forest Hills Eastern
13th – Chelsea
16th – Cedar Springs
17th – Adrian
18th – DeWitt
20th – Spring Lake
21st – Detroit Country Day
23rd – Petoskey
DNQ – Ludington, Haslett, Tecumseh, Freeland, St. Joseph, Vicksburg, Owosso, Paw Paw, Grand Rapids South Christian
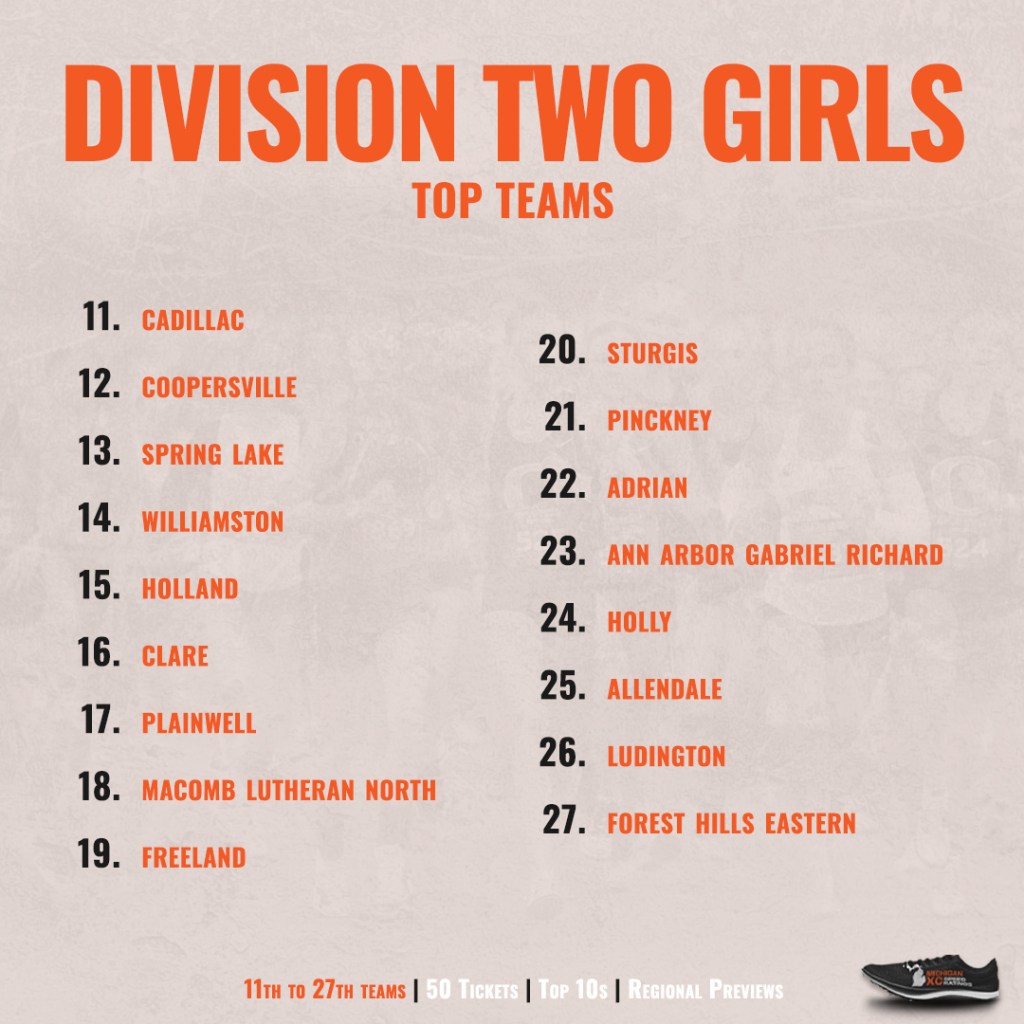
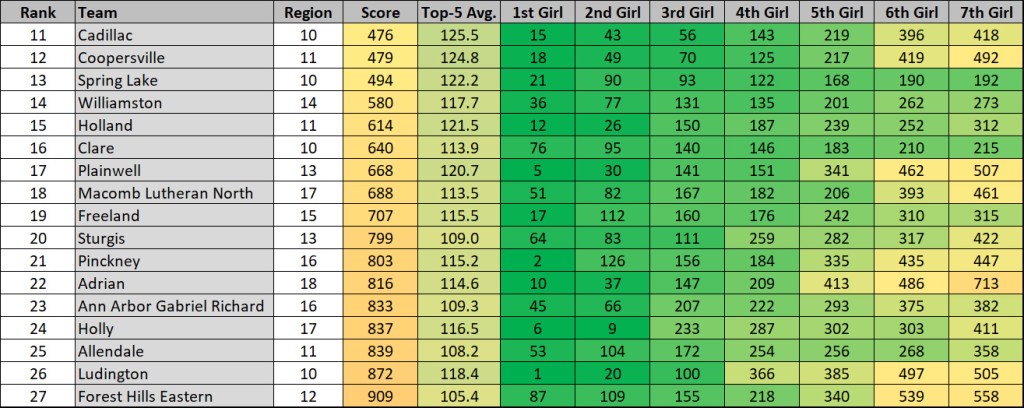
27-11
27. Forest Hills Eastern – the Hawks bring back four girls that were in the 20:30’s or faster.
26. Ludington – leading the way will be Eliza Schwass, though Annabelle Lowman is as good of a #2 as one will find. The senior-to-be has reached the MIS podium all three of her seasons, hitting as high as 8th the past two Novembers.
25. Allendale – the Falcon depth extends a little further than D2 teams in the same ballpark, as Allendale returns seven girls that were sub-22 or faster.
24. Holly – given the evolution of Maddie Lindley and Julia Bambach, you gotta figure the Bronchos will have another girl exponentially break through. There are plenty of candidates!
23. Ann Arbor Gabriel Richard – both Bridget Fidkowski and Monica Lynn should be at the forefront of any race. That was the case in Region 18, where the pair placed 2nd and 4th, greatly contributing to the Fighting Irish regional crown.
22. Adrian – coming off the heels of a great track season, the Maples are super strong up front. Of course there’s the venerable Ayda Skeels, but also Madison Petty, who was 19th in D2 last year and a state qualifier in the 1600m.
21. Pinckney – it’s Jaelyn Ray’s team, with quality depth in tow. Both Valyntina Garcia and Eastynn Charder broke into the 19’s late in the ’25 season, the two being valuable contributors to the Pirates’ regional championship.
20. Sturgis – the Sturgis MS Trojans were St. Joseph County champs and many of those youngsters could feature on this high school team.
19. Freeland – Clara Kaczor is the hallmark of this team, and she leads a Falcon squad that should have plenty of bodies to choose from. Eight other Freeland returners were sub-22 at some point last fall.
18. Macomb Lutheran North – the Region 17 Champion in both 2024 and 2025. The Mustangs clearly are working to earn another trophy, evidenced by a track season that saw five LN girls slip under 6:00 in the 1600m.
17. Plainwell – Mai Nguyen is a name I haven’t covered much, but her accomplishments are vast. She’s a 3x individual qualifier on the track, hit 3rd place in both the Wolverine Conference and Region 13, and medaled here at D2 State last fall.
16. Clare – a traditionally strong program that just recently moved up to D2. After a year of adjustment, the Pioneers should be in contention to qualify out of Region 10.
15. Holland – have one of the quicker 1-2 combos in the state with Johanna Mulder and Olivia Weiss. Mulder won the OK Black 3200m in sub-11 PR fashion and Weiss stepped onto the medal stand at MIS in November.
14. Williamston – could be greatly influenced by the Hornet MS program, which had two girls under 12:30 last fall and in the top-10 at Junior Greater Lansing.
13. Spring Lake – the track state championship vibes have to rub off, right? Most evident of the Laker fitness was the 800m, where four returners ran under 2:35, including standout Cora Parker, who placed 3rd in D2.
12. Coopersville – fresh off an 11th place finish and back for more. Breslyn Klein seems on the verge of a big season, coming off a track campaign where she sprinted to the 6th fastest freshman 800m time in Michigan.
11. Cadillac – seems like reloading is the philosophy on the shores of Lake Cadillac. It’s best exemplified by their lead girl, Ella McInerney, who dropped 20+ second PR’s in the 1600m and 3200m this past spring.
Best Track Seasons
(some of the teams that improved the most from before track to now)
Adrian
800m: 2 returners sub-2:25
1600m: 3 returners sub-5:55
3200m: 3 returners sub-12:20
Macomb Lutheran North
800m: 6 returners sub-2:50
1600m: 5 returners sub-6:00
3200m: 4 returners sub-12:30
Cadillac
800m: 6 returners sub-2:40
1600m: 5 returners sub-5:45
3200m: 4 returners sub-13:00
2025 State Finals
6th – Cadillac
7th – Pinckney
11th – Coopersville
12th – Holland
16th – Spring Lake
17th – Ann Arbor Gabriel Richard
20th – Adrian
21st – Freeland
23rd – Williamston
24th – Macomb Lutheran North
25th – Sturgis
DNQ – Clare, Plainwell, Holly, Allendale, Ludington, Forest Hills Eastern