
Finally, the start of the season we’ve all been waiting for. Throw out all the fast times from September, but apply all the lessons learned through the summer and fall. Regional week is here and with it comes the many projections and previews I’ll write.
Just as last year and throughout the season, I’m projecting these using race simulations. Through a season’s worth of speed ratings, one can determine a runner’s average rating and the variability of those ratings. Both those factors are then weighed towards more recent meets, which are then simulated thousands of times using a Monte Carlo analysis (also described by TullyRunners here). Over those thousands of race simulations, one can determine a team’s average place and average score, a runner’s average place, odds on winning, and odds on qualifying.
These are useful in cross country scenarios, where you have consistent runners and those who are a bit more up and down. For example:
| Tanner Time | Tanner Rating | Tanner Avg. | Tanner StDev. |
| 15:30 | 210 | ||
| 15:45 | 205 | ||
| 16:00 | 200 | ||
| 16:15 | 195 | ||
| 16:30 | 190 | 200 | 7.91 |
| MIXCSR Time | MIXCSR Rating | MIXCSR Avg. | MIXCSR StDev. |
| 16:09 | 197 | ||
| 16:12 | 196 | ||
| 16:15 | 195 | ||
| 16:18 | 194 | ||
| 16:21 | 193 | 195 | 1.58 |
Jacob at his best might be faster than I in four of the five races during the season. I’d almost never be All-State in Division 1, but he might contend for a top-5 spot or place 60th.
If we did 20 simulations, this is how it might turn out:
| Race | Tanner Avg. | Tanner StDev | Tanner Rating | MIXCSR Avg. | MIXCSR StDev | MIXCSR Rating |
| 1 | 200 | 7.9 | 202.1 | 195 | 1.6 | 195.6 |
| 2 | 200 | 7.9 | 196.2 | 195 | 1.6 | 194.1 |
| 3 | 200 | 7.9 | 190.0 | 195 | 1.6 | 199.2 |
| 4 | 200 | 7.9 | 193.4 | 195 | 1.6 | 192.5 |
| 5 | 200 | 7.9 | 206.8 | 195 | 1.6 | 195.7 |
| 6 | 200 | 7.9 | 201.8 | 195 | 1.6 | 196.1 |
| 7 | 200 | 7.9 | 171.6 | 195 | 1.6 | 194.9 |
| 8 | 200 | 7.9 | 189.2 | 195 | 1.6 | 195.9 |
| 9 | 200 | 7.9 | 205.5 | 195 | 1.6 | 197.0 |
| 10 | 200 | 7.9 | 203.8 | 195 | 1.6 | 192.6 |
| 11 | 200 | 7.9 | 192.3 | 195 | 1.6 | 196.5 |
| 12 | 200 | 7.9 | 196.9 | 195 | 1.6 | 196.4 |
| 13 | 200 | 7.9 | 198.5 | 195 | 1.6 | 195.6 |
| 14 | 200 | 7.9 | 203.2 | 195 | 1.6 | 194.1 |
| 15 | 200 | 7.9 | 193.9 | 195 | 1.6 | 192.6 |
| 16 | 200 | 7.9 | 199.3 | 195 | 1.6 | 193.2 |
| 17 | 200 | 7.9 | 208.7 | 195 | 1.6 | 194.2 |
| 18 | 200 | 7.9 | 213.7 | 195 | 1.6 | 194.6 |
| 19 | 200 | 7.9 | 212.6 | 195 | 1.6 | 197.1 |
| 20 | 200 | 7.9 | 206.3 | 195 | 1.6 | 193.9 |
I’d win four times, but I’d never have the ability to win a title like he had in Race 18. He’s usually All-State, but may cost his team a title through his effort in Race 7.
The simulations give the possibilities of those scenarios and all the various scoring scripts. A sixth girl that can pop off on any certain day, a reliable boy who always runs 17-flat, you name it. Hopefully, they better elucidate our contenders, qualifiers, and how these races play out over the weekend.
But always remember, races aren’t run on paper or on a computer. These projections are meant to better our sport, give more attention where little is given. Although I take pride in their accuracy, this endeavor would be quite boring if it were always perfect. I look forward to these being proven wrong and I expect to hear about it as well.
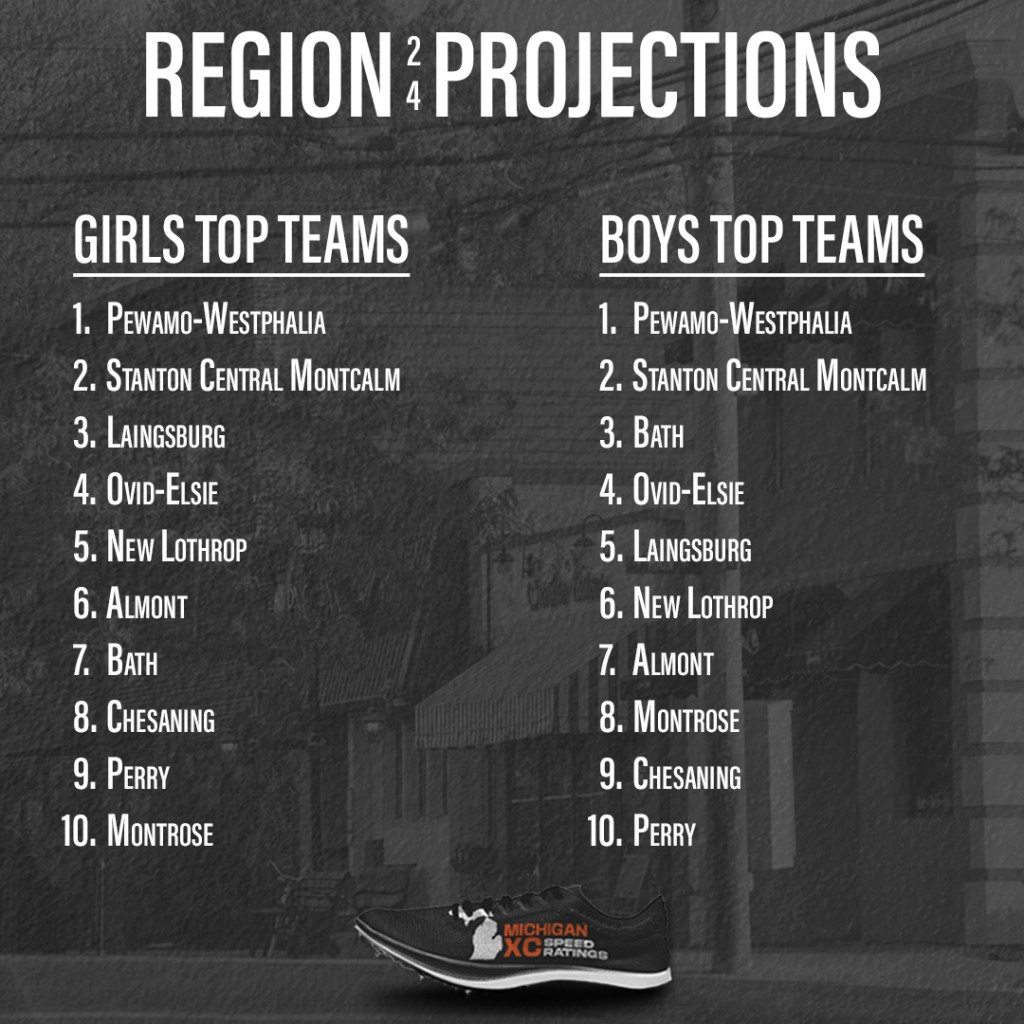
GIRLS
Ranked Teams
#4 Pewamo-Westphalia
#6 Stanton Central Montcalm
Projected Individual Qualifier Cutoff
21st Place
| Projected Place | Team | Avg. Score | Avg. Place | Win % | Top 3 % |
| 1 | Pewamo-Westphalia | 32 | 1.1 | 87 | 95+ |
| 2 | Stanton Central Montcalm | 38 | 1.9 | 13 | 95+ |
| 3 | Laingsburg | 93 | 3.0 | 95+ | |
| 4 | Ovid-Elsie | 136 | 4.1 | ||
| 5 | New Lothrop | 151 | 5.2 | ||
| 6 | Almont | 158 | 5.7 | ||
| 7 | Bath | 189 | 7.2 | ||
| 8 | Chesaning | 196 | 8.0 | ||
| 9 | Perry | 211 | 8.8 | ||
| 10 | Montrose | 253 | 10.0 |
| Projected Place | Grade | Name | Team | Avg. Place |
| 1 | 11 | Kyah Hoffman | Stanton Central Montcalm | 1.0 |
| 2 | 11 | Whitney Werner | Pewamo-Westphalia | 2.0 |
| 3 | 11 | Ashley Choponis | Stanton Central Montcalm | 3.1 |
| 4 | 10 | Grace Coston | Stanton Central Montcalm | 3.9 |
| 5 | 9 | Alyssa Kramer | Pewamo-Westphalia | 5.8 |
| 6 | 12 | Melanie Werner | Pewamo-Westphalia | 6.1 |
| 7 | 10 | Abbie Schneider | Pewamo-Westphalia | 8.1 |
| 8 | 10 | Anna Poppema | Bath | 8.3 |
| 9 | 11 | Emily Rathka | Laingsburg | 9.1 |
| 10 | 9 | Jenna Keilen | Pewamo-Westphalia | 10.5 |
| 11 | 9 | Andrea Rolston | Stanton Central Montcalm | 11.0 |
| 12 | 10 | Clarissa Baese | Ovid-Elsie | 11.5 |
| 13 | 10 | Lilly Rooks | Pewamo-Westphalia | 12.2 |
| 14 | 12 | Isabell Helman | Pewamo-Westphalia | 13.9 |
| 15 | 11 | Piper White | Ovid-Elsie | 16.0 |
| 16 | 10 | Laila Evola | Almont | 16.0 |
| 17 | 11 | Evelyn Logghe | Laingsburg | 18.5 |
| 18 | 10 | Braelyn Bunting | Stanton Central Montcalm | 18.8 |
| 19 | 10 | Hazel Burley | Laingsburg | 19.3 |
| 20 | 12 | Ayla DeLaurier | Almont | 22.2 |
| 21 | 12 | Kaia Spiess | Ovid-Elsie | 22.3 |
| 22 | 12 | Taylor Bailey | Chesaning | 22.7 |
| 23 | 9 | Samantha Gutzman | Laingsburg | 22.8 |
| 24 | 11 | Addison Rusz | Laingsburg | 23.7 |
| 25 | 12 | Hannah Oakes | Chesaning | 26.0 |
| 26 | 12 | Klara Mulcahy | New Lothrop | 27.4 |
| 27 | 12 | Sara Dammann | New Lothrop | 27.6 |
| 28 | 10 | Mackenzie Hills | Bath | 27.7 |
| 29 | 11 | Lexy Andres | New Lothrop | 29.4 |
| 30 | 12 | Josie Bauman | New Lothrop | 31.6 |

Any Intriguing Battles?
Will Stanton Central Montcalm pull off the upset and bust through the perennially strong Pirate pack? I think there’s a better chance on the girls side, although both are fully capable. Paths to victory include placing three very highly or their 4th and 5th picking up some very manageable spots late.
BOYS
Ranked Teams
#2 Pewamo-Westphalia
#6 Stanton Central Montcalm
#14 Bath
Projected Individual Qualifier Cutoff
Going all the way down to 25th(!!!) place.
| Projected Place | Team | Avg. Score | Avg. Place | Win % | Top 3 % |
| 1 | Pewamo-Westphalia | 40 | 1.1 | 94 | 95+ |
| 2 | Stanton Central Montcalm | 47 | 1.9 | 6 | 95+ |
| 3 | Bath | 62 | 3.0 | 95+ | |
| 4 | Ovid-Elsie | 158 | 4.9 | ||
| 5 | Laingsburg | 159 | 4.7 | ||
| 6 | New Lothrop | 181 | 6.0 | ||
| 7 | Almont | 194 | 6.7 | ||
| 8 | Montrose | 240 | 8.6 | ||
| 9 | Chesaning | 253 | 9.4 | ||
| 10 | Perry | 260 | 9.6 | ||
| 11 | Memphis | 272 | 10.5 | ||
| 12 | Mt Morris | 299 | 11.9 | ||
| 13 | Burton-Bendle | 333 | 12.9 |
| Projected Place | Grade | Name | Team | Avg. Place |
| 1 | 12 | Collin Farmer | Pewamo-Westphalia | 1.1 |
| 2 | 10 | Gage Hoffman | Stanton Central Montcalm | 2.1 |
| 3 | 12 | Graham Coston | Stanton Central Montcalm | 3.1 |
| 4 | 12 | Carter Holmes | Bath | 5.2 |
| 5 | 10 | Noah Devereaux | Laingsburg | 6.1 |
| 6 | 10 | Sylus Wilson | Stanton Central Montcalm | 6.6 |
| 7 | 9 | Wyatt Werner | Pewamo-Westphalia | 8.0 |
| 8 | 11 | Allan George | Pewamo-Westphalia | 9.3 |
| 9 | 9 | River Fox | Bath | 10.2 |
| 10 | 11 | Luke Skidmore | Bath | 10.9 |
| 11 | 9 | John Kowatch | Pewamo-Westphalia | 11.5 |
| 12 | 11 | Sam Muirhead | Pewamo-Westphalia | 11.6 |
| 13 | 12 | Andrew Koenigsknecht | Bath | 11.8 |
| 14 | 11 | Clay Powell | Ovid-Elsie | 12.0 |
| 15 | 9 | Nolan Mitchell | Pewamo-Westphalia | 14.4 |
| 16 | 10 | Kyler Fertig | Stanton Central Montcalm | 16.0 |
| 17 | 9 | Charlie George | Pewamo-Westphalia | 16.4 |
| 18 | 10 | Evan Rolston | Stanton Central Montcalm | 19.0 |
| 19 | 9 | Kai Fisher | Memphis | 21.6 |
| 20 | 11 | Lieu Vincke | New Lothrop | 23.7 |
| 21 | 10 | Madden Starkweather | Bath | 23.8 |
| 22 | 11 | Kevin Heslip | New Lothrop | 24.7 |
| 23 | 12 | Josiah Curry | Stanton Central Montcalm | 25.6 |
| 24 | 10 | Joshua Miller | Ovid-Elsie | 25.9 |
| 25 | 9 | Jaxon Hemgesberg | Chesaning | 26.3 |
| 26 | 12 | Kyle Baldwin | Mt Morris | 28.8 |
| 27 | 9 | Tyler Rockafellow | Perry | 29.1 |
| 28 | 9 | Colton Grzyb | Almont | 29.4 |
| 29 | 11 | Felix Ramirez | Laingsburg | 29.9 |
| 30 | 11 | James Kelly | Ovid-Elsie | 31.0 |


GIRLS
Ranked Teams
#9 DeWitt
#11 St. Johns
#15 Owosso
Projected Individual Qualifier Cutoff
18th place with these top-heavy squads.
| Projected Place | Team | Avg. Score | Avg. Place | Win % | Top 3 % |
| 1 | DeWitt | 57 | 1.4 | 60 | 95+ |
| 2 | St. Johns | 60 | 1.6 | 40 | 95+ |
| 3 | Owosso | 83 | 2.9 | 95+ | |
| 4 | Mason | 137 | 4.5 | ||
| 5 | Haslett | 144 | 5.0 | ||
| 6 | Williamston | 153 | 5.6 | ||
| 7 | Parma Western | 188 | 7.5 | ||
| 8 | Charlotte | 191 | 7.6 | ||
| 9 | Corunna | 207 | 8.8 | ||
| 10 | Fowlerville | 254 | 10.1 | ||
| 11 | Eaton Rapids | 277 | 10.9 | ||
| 12 | Jackson Northwest | 316 | 12.0 | ||
| 13 | Lansing Eastern | 396 | 13.0 |
| Projected Place | Grade | Name | Team | Avg. Place |
| 1 | 9 | Ava Schafer | St. Johns | 1.2 |
| 2 | 12 | Meghan Ford | Mason | 1.8 |
| 3 | 12 | Abby Young | St. Johns | 3.7 |
| 4 | 11 | Kayla Williams | DeWitt | 3.8 |
| 5 | 10 | Chloe Khon | Jackson Northwest | 7.1 |
| 6 | 12 | Clara Fletcher | St. Johns | 7.3 |
| 7 | 12 | Libby Summerland | Owosso | 11.0 |
| 8 | 11 | Ayla Holben | DeWitt | 11.1 |
| 9 | 10 | Emma Crandell | Owosso | 11.1 |
| 10 | 9 | Sophia Schafer | Williamston | 11.8 |
| 11 | 11 | Autumn Thompson | DeWitt | 12.1 |
| 12 | 11 | Nicole Schafer | Williamston | 12.2 |
| 13 | 10 | Miriam Kloha | St. Johns | 12.3 |
| 14 | 11 | Josie Jenkinson | Owosso | 13.0 |
| 15 | 11 | Mia Williams | DeWitt | 14.0 |
| 16 | 12 | Dora Henry | Haslett | 15.2 |
| 17 | 10 | Reese Supianoski | Williamston | 17.1 |
| 18 | 11 | Hayven Thiel | Corunna | 17.6 |
| 19 | 9 | Jaidyn Nickels | Corunna | 18.8 |
| 20 | 10 | Isabella Taber | DeWitt | 19.3 |
| 21 | 11 | Julionna West | Owosso | 21.0 |
| 22 | 10 | Abby Russel | Haslett | 22.5 |
| 23 | 11 | Ryleigh Hanlin | DeWitt | 24.3 |
| 24 | 9 | Colette Charchut | Haslett | 25.0 |
| 25 | 11 | Raquel Curey | Parma Western | 26.3 |
| 26 | 11 | Natalie Summerland | Owosso | 26.6 |
| 27 | 10 | Avari Montgomery | Charlotte | 27.7 |
| 28 | 12 | Analise Chelotti | DeWitt | 28.9 |
| 29 | 10 | Aubrey Metzger | Mason | 29.5 |
| 30 | 10 | Delaney Richardson | Fowlerville | 30.9 |

Any Intriguing Battles?
DeWitt has been coming on strong as of late, entering the top-10 through their results from Greater Lansing and the CAAC Blue, the Panthers finishing 2nd in each. Do they have enough depth to overcome the Redwings’ powerful top-3?
BOYS
Ranked Teams
#24 Parma Western
#26 St. Johns
#27 DeWitt
Projected Individual Qualifier Cutoff
15th Place, as this seems to be a much better individual region than a team region.
| Projected Place | Team | Avg. Score | Avg. Place | Win % | Top 3 % |
| 1 | DeWitt | 85 | 1.7 | 51 | 95+ |
| 2 | Parma Western | 87 | 2.0 | 29 | 95+ |
| 3 | St. Johns | 92 | 2.7 | 16 | 78 |
| 4 | Corunna | 108 | 3.6 | 29 | |
| 5 | Mason | 146 | 5.5 | ||
| 6 | Haslett | 148 | 5.5 | ||
| 7 | Eaton Rapids | 184 | 7.0 | ||
| 8 | Williamston | 220 | 8.3 | ||
| 9 | Fowlerville | 233 | 8.7 | ||
| 10 | Charlotte | 267 | 10.0 | ||
| 11 | Owosso | 305 | 11.9 | ||
| 12 | Lansing Waverly | 308 | 12.1 | ||
| 13 | Jackson Northwest | 309 | 12.4 | ||
| 14 | Lansing Eastern | 329 | 13.6 | ||
| 15 | Lansing Sexton | 499 | 15.0 |
| Projected Place | Grade | Name | Team | Avg. Place |
| 1 | 12 | Nate Carmody | Haslett | 1.3 |
| 2 | 11 | Alex Doneth | Mason | 2.8 |
| 3 | 11 | Dylan Lydic | Haslett | 3.0 |
| 4 | 12 | Isaac Staib | St. Johns | 4.4 |
| 5 | 11 | Nolan Inglis | DeWitt | 4.7 |
| 6 | 10 | Edison Lopeman | Parma Western | 6.7 |
| 7 | 12 | Cooper Singleton | Parma Western | 6.8 |
| 8 | 9 | Ryan Good | Parma Western | 7.9 |
| 9 | 12 | Matthew Schrauben | St. Johns | 8.1 |
| 10 | 11 | Simon Erfourth | Owosso | 11.7 |
| 11 | 12 | Brennan McKone | DeWitt | 12.0 |
| 12 | 11 | Conner McCormick | Mason | 12.1 |
| 13 | 10 | Payton Chandler | Corunna | 12.9 |
| 14 | 11 | Jack Huntington | Eaton Rapids | 15.9 |
| 15 | 11 | Lucas Moore | Fowlerville | 17.0 |
| 16 | 11 | Braylen Eaton | Charlotte | 17.3 |
| 17 | 11 | Bobby Donley | Corunna | 17.3 |
| 18 | 10 | Aidan Roka | Corunna | 18.4 |
| 19 | 12 | Xander Maliska | St. Johns | 18.8 |
| 20 | 9 | Mason Raborn | DeWitt | 22.9 |
| 21 | 12 | Kenny Evans | Corunna | 23.1 |
| 22 | 11 | Jackson Walthorn | DeWitt | 23.3 |
| 23 | 11 | Ian Goodrich | DeWitt | 26.6 |
| 24 | 12 | Daniel Wilson | Williamston | 27.3 |
| 25 | 10 | Reagan Ward | St. Johns | 28.2 |
| 26 | 10 | Grant Conley | Charlotte | 29.2 |
| 27 | 11 | Gabi Martinez | Lansing Eastern | 30.1 |
| 28 | 9 | Will Chelotti | DeWitt | 31.0 |
| 29 | 11 | Drew Holevac | Eaton Rapids | 31.4 |
| 30 | 11 | Nathan Szilagyi | Fowlerville | 31.7 |

Any Intriguing Battles?
Can Corunna shock the world again? Last year, the Cavaliers qualified for State as a longshot, coming in with a 6% chance. They’re almost 5x as likely this time around and as expected, just blasted the field at Shiawassee County.

3 thoughts on “2023 Regional Projections: DeWitt Regional”