
Finally, the start of the season we’ve all been waiting for. Throw out all the fast times from September, but apply all the lessons learned through the summer and fall. Regional week is here and with it comes the many projections and previews I’ll write.
Just as last year and throughout the season, I’m projecting these using race simulations. Through a season’s worth of speed ratings, one can determine a runner’s average rating and the variability of those ratings. Both those factors are then weighed towards more recent meets, which are then simulated thousands of times using a Monte Carlo analysis (also described by TullyRunners here). Over those thousands of race simulations, one can determine a team’s average place and average score, a runner’s average place, odds on winning, and odds on qualifying.
These are useful in cross country scenarios, where you have consistent runners and those who are a bit more up and down. For example:
| Tanner Time | Tanner Rating | Tanner Avg. | Tanner StDev. |
| 15:30 | 210 | ||
| 15:45 | 205 | ||
| 16:00 | 200 | ||
| 16:15 | 195 | ||
| 16:30 | 190 | 200 | 7.91 |
| MIXCSR Time | MIXCSR Rating | MIXCSR Avg. | MIXCSR StDev. |
| 16:09 | 197 | ||
| 16:12 | 196 | ||
| 16:15 | 195 | ||
| 16:18 | 194 | ||
| 16:21 | 193 | 195 | 1.58 |
Jacob at his best might be faster than I in four of the five races during the season. I’d almost never be All-State in Division 1, but he might contend for a top-5 spot or place 60th.
If we did 20 simulations, this is how it might turn out:
| Race | Tanner Avg. | Tanner StDev | Tanner Rating | MIXCSR Avg. | MIXCSR StDev | MIXCSR Rating |
| 1 | 200 | 7.9 | 202.1 | 195 | 1.6 | 195.6 |
| 2 | 200 | 7.9 | 196.2 | 195 | 1.6 | 194.1 |
| 3 | 200 | 7.9 | 190.0 | 195 | 1.6 | 199.2 |
| 4 | 200 | 7.9 | 193.4 | 195 | 1.6 | 192.5 |
| 5 | 200 | 7.9 | 206.8 | 195 | 1.6 | 195.7 |
| 6 | 200 | 7.9 | 201.8 | 195 | 1.6 | 196.1 |
| 7 | 200 | 7.9 | 171.6 | 195 | 1.6 | 194.9 |
| 8 | 200 | 7.9 | 189.2 | 195 | 1.6 | 195.9 |
| 9 | 200 | 7.9 | 205.5 | 195 | 1.6 | 197.0 |
| 10 | 200 | 7.9 | 203.8 | 195 | 1.6 | 192.6 |
| 11 | 200 | 7.9 | 192.3 | 195 | 1.6 | 196.5 |
| 12 | 200 | 7.9 | 196.9 | 195 | 1.6 | 196.4 |
| 13 | 200 | 7.9 | 198.5 | 195 | 1.6 | 195.6 |
| 14 | 200 | 7.9 | 203.2 | 195 | 1.6 | 194.1 |
| 15 | 200 | 7.9 | 193.9 | 195 | 1.6 | 192.6 |
| 16 | 200 | 7.9 | 199.3 | 195 | 1.6 | 193.2 |
| 17 | 200 | 7.9 | 208.7 | 195 | 1.6 | 194.2 |
| 18 | 200 | 7.9 | 213.7 | 195 | 1.6 | 194.6 |
| 19 | 200 | 7.9 | 212.6 | 195 | 1.6 | 197.1 |
| 20 | 200 | 7.9 | 206.3 | 195 | 1.6 | 193.9 |
I’d win four times, but I’d never have the ability to win a title like he had in Race 18. He’s usually All-State, but may cost his team a title through his effort in Race 7.
The simulations give the possibilities of those scenarios and all the various scoring scripts. A sixth girl that can pop off on any certain day, a reliable boy who always runs 17-flat, you name it. Hopefully, they better elucidate our contenders, qualifiers, and how these races play out over the weekend.
But always remember, races aren’t run on paper or on a computer. These projections are meant to better our sport, give more attention where little is given. Although I take pride in their accuracy, this endeavor would be quite boring if it were always perfect. I look forward to these being proven wrong and I expect to hear about it as well.
GIRLS
Ranked Teams
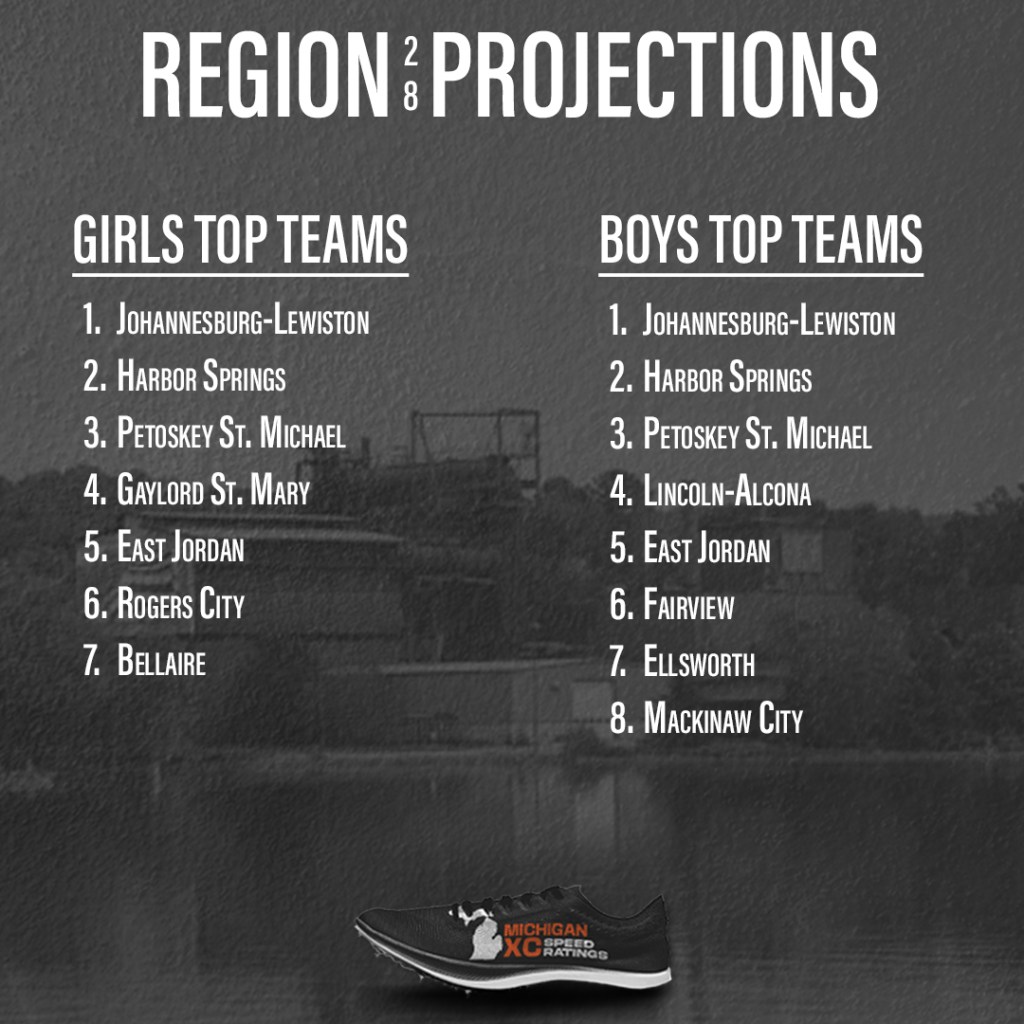
#2 Johannesburg-Lewiston
#5 Harbor Springs
Projected Individual Qualifier Cutoff
21st or 22nd place. Since Joburg and HS are so strong up front, these numbers get pushed back a tad.
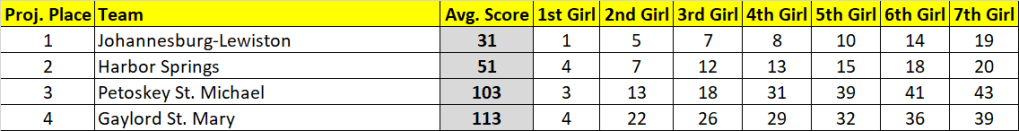
| Projected Place | Team | Avg. Score | Avg. Place | Win % | Top 3 % |
| 1 | Johannesburg-Lewiston | 31 | 1.0 | 95+ | 95+ |
| 2 | Harbor Springs | 51 | 2.0 | 95+ | |
| 3 | Petoskey St. Michael | 103 | 3.1 | 87 | |
| 4 | Gaylord St. Mary | 113 | 3.9 | 12 | |
| 5 | East Jordan | 127 | 5.2 | ||
| 6 | Rogers City | 138 | 5.8 | ||
| 7 | Bellaire | 160 | 7.0 |
| Projected Place | Grade | Name | Team | Avg. Place |
| 1 | 11 | Allie Nowak | Johannesburg-Lewiston | 1.1 |
| 2 | 11 | Jane Manthei | Petoskey St. Michael | 2.7 |
| 3 | 12 | Miriam Murrell | Gaylord St. Mary | 4.0 |
| 4 | 9 | Stefi Reskevics | Harbor Springs | 4.1 |
| 5 | 10 | Yolanda Gascho | Johannesburg-Lewiston | 6.4 |
| 6 | 12 | Madalyn Agren | Johannesburg-Lewiston | 6.7 |
| 7 | 9 | Harlie Fox | Johannesburg-Lewiston | 6.8 |
| 8 | 11 | Juniper Rodham | Harbor Springs | 6.8 |
| 9 | 9 | Avery Langlois | Rogers City | 9.0 |
| 10 | 9 | Elizabeth Furman | Indian River Inland Lakes | 11.6 |
| 11 | 9 | Danielle Agren | Johannesburg-Lewiston | 13.9 |
| 12 | 10 | Fran Warren | Harbor Springs | 14.0 |
| 13 | 9 | Veronica Paga | Petoskey St. Michael | 14.3 |
| 14 | 11 | McKenzie Bowman | Harbor Springs | 14.7 |
| 15 | 12 | Cora Mullins | Johannesburg-Lewiston | 15.7 |
| 16 | 9 | Julia Clarke | Harbor Springs | 17.0 |
| 17 | 11 | Elke Knauf | East Jordan | 17.2 |
| 18 | 12 | Rosalinda Gascho | Johannesburg-Lewiston | 18.1 |
| 19 | 9 | Genevieve Rodham | Harbor Springs | 18.7 |
| 20 | 12 | Sydney Feagan | Petoskey St. Michael | 19.3 |
| 21 | 9 | Ruby Pletcher | Ellsworth | 19.3 |
| 22 | 9 | Avary Bearden | East Jordan | 21.1 |
| 23 | 11 | Grace Hayhurst | Harbor Springs | 21.2 |
| 24 | 10 | Bailey Thompson | Gaylord St. Mary | 23.9 |
| 25 | 9 | Isabella Hocking | Bellaire | 26.3 |
| 26 | 10 | Taylor Hefele | Rogers City | 26.9 |
| 27 | 12 | Jessie Ross | Fairview | 28.6 |
| 28 | 12 | Alex Dawson | Bellaire | 29.5 |
| 29 | 9 | Madison Fiedorek | East Jordan | 29.6 |
| 30 | 9 | Maya Dodd | Gaylord St. Mary | 29.9 |
BOYS
Ranked Teams
#2 Johannesburg-Lewiston
#9 Harbor Springs
#20 Petoskey St. Michael
Projected Individual Qualifier Cutoff
With the top-3 squads dominating the lower finishes, 21st place.
| Projected Place | Team | Avg. Score | Avg. Place | Win % | Top 3 % |
| 1 | Johannesburg-Lewiston | 38 | 1.0 | 95+ | 95+ |
| 2 | Harbor Springs | 58 | 2.0 | 95+ | |
| 3 | Petoskey St. Michael | 78 | 3.0 | 95+ | |
| 4 | Lincoln-Alcona | 119 | 4.7 | ||
| 5 | East Jordan | 128 | 5.1 | ||
| 6 | Fairview | 134 | 5.6 | ||
| 7 | Ellsworth | 149 | 7.0 | ||
| 8 | Mackinaw City | 159 | 7.7 |

| Projected Place | Grade | Name | Team | Avg. Place |
| 1 | 12 | Malaki Gascho | Johannesburg-Lewiston | 1.7 |
| 2 | 12 | Blake Fox | Johannesburg-Lewiston | 2.2 |
| 3 | 11 | Jeremiah Witt | Johannesburg-Lewiston | 2.5 |
| 4 | 10 | Lynus Cadarette | Petoskey St. Michael | 3.9 |
| 5 | 10 | Cody Bradley | Petoskey St. Michael | 5.3 |
| 6 | 12 | Trevor Clarke | Harbor Springs | 7.7 |
| 7 | 10 | Cole Upper | Lincoln-Alcona | 8.5 |
| 8 | 10 | Adam Ferguson | Harbor Springs | 9.0 |
| 9 | 11 | Russell Vandermus | Petoskey St. Michael | 10.5 |
| 10 | 12 | Logan Kihnke | Harbor Springs | 11.6 |
| 11 | 11 | Austin Sneed | East Jordan | 12.1 |
| 12 | 12 | Dusty Layman | Johannesburg-Lewiston | 12.3 |
| 13 | 10 | Cole Brege | Rogers City | 15.1 |
| 14 | 12 | Carter Upper | Lincoln-Alcona | 15.8 |
| 15 | 8 | Atticus Cadarette | Petoskey St. Michael | 16.3 |
| 16 | 10 | Max Vroman | Harbor Springs | 16.4 |
| 17 | 10 | Henry Kruzel | Harbor Springs | 17.2 |
| 18 | 10 | Nicholas Trader | Fairview | 19.9 |
| 19 | 11 | Jacob Chamberlain | East Jordan | 20.0 |
| 20 | 11 | Drake Fulton | Johannesburg-Lewiston | 20.6 |
| 21 | 12 | Tyler DeYoung | Ellsworth | 20.7 |
| 22 | 11 | Teddy Krieger | Harbor Springs | 20.9 |
| 23 | 12 | Patrick Puroll | Ellsworth | 22.2 |
| 24 | 12 | Isaac Black | East Jordan | 24.4 |
| 25 | 10 | Sean Bernard | Hale | 24.6 |
| 26 | 10 | Darren Boyat | Lincoln-Alcona | 24.7 |
| 27 | 9 | Carter Toensfeldt | Fairview | 26.5 |
| 28 | 10 | Braylon Currie | Mackinaw City | 28.5 |
| 29 | 11 | Logan McMullen | Indian River Inland Lakes | 30.2 |
| 30 | 10 | Paxton Downing | Hale | 30.8 |
GIRLS
Ranked Teams
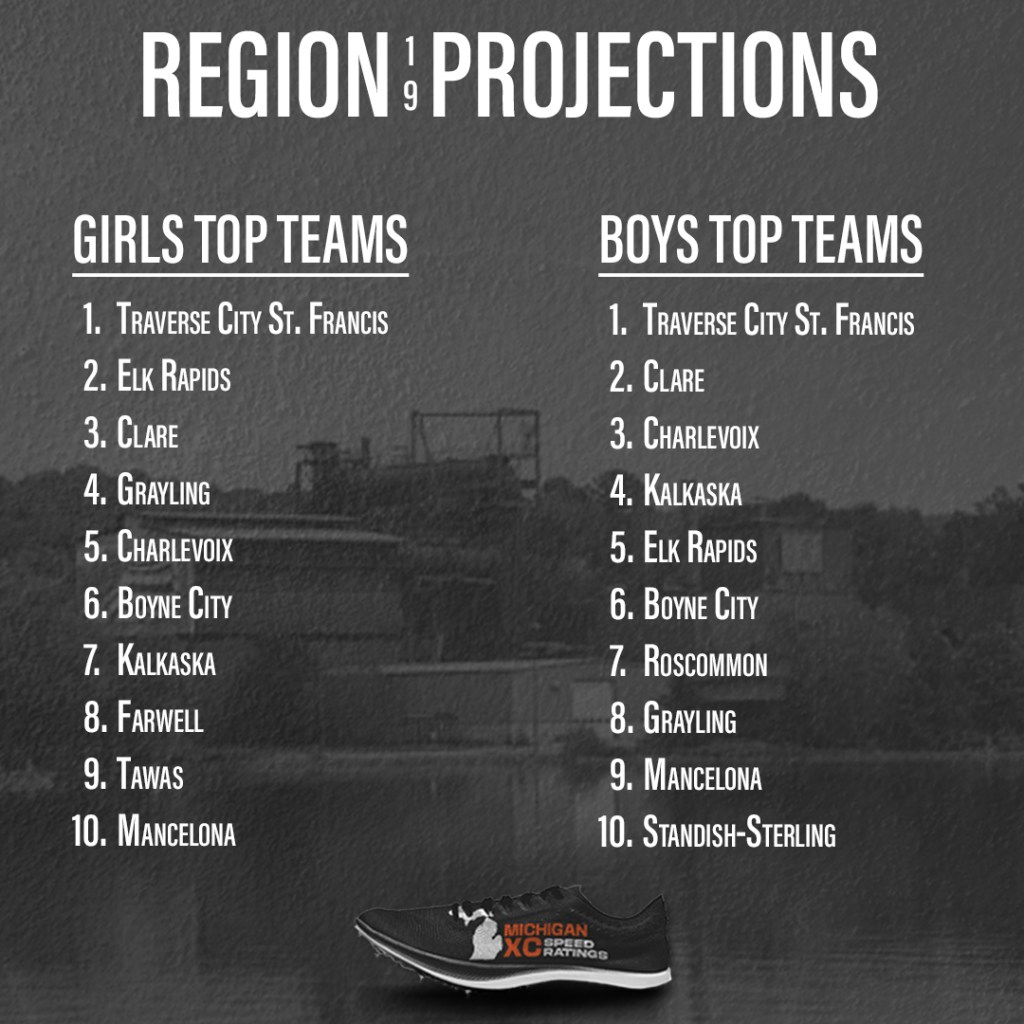
#2 Traverse City St. Francis
#5 Elk Rapids
Projected Individual Qualifier Cutoff
21st Place. Should be pretty easy to spot the additional qualifiers.
| Projected Place | Team | Avg. Score | Avg. Place | Win % | Top 3 % |
| 1 | Traverse City St. Francis | 29 | 1.0 | 95+ | 95+ |
| 2 | Elk Rapids | 46 | 2.0 | 95+ | |
| 3 | Clare | 119 | 3.0 | 95+ | |
| 4 | Grayling | 157 | 4.6 | ||
| 5 | Charlevoix | 162 | 4.9 | ||
| 6 | Boyne City | 172 | 5.8 | ||
| 7 | Kalkaska | 187 | 6.9 | ||
| 8 | Farwell | 200 | 7.8 | ||
| 9 | Tawas | 234 | 9.8 | ||
| 10 | Mancelona | 235 | 9.9 | ||
| 11 | Standish-Sterling | 238 | 10.3 |

| Projected Place | Grade | Name | Team | Avg. Place |
| 1 | 11 | Betsy Skendzel | Traverse City St. Francis | 1.0 |
| 2 | 10 | Brynne Schulte | Elk Rapids | 3.1 |
| 3 | 9 | Sophia Buzzelli | Clare | 3.6 |
| 4 | 11 | Mary Masserant | Traverse City St. Francis | 4.6 |
| 5 | 9 | Molly Kate Hollandsworth | Traverse City St. Francis | 5.1 |
| 6 | 11 | Isabelle Eppert | Farwell | 6.2 |
| 7 | 12 | Maddie Gallagher | Traverse City St. Francis | 6.7 |
| 8 | 10 | Anna Pray | Elk Rapids | 7.2 |
| 9 | 11 | Hunter Shellenbarger | Elk Rapids | 10.0 |
| 10 | 10 | Sarah Trojanowski | Traverse City St. Francis | 12.1 |
| 11 | 12 | Tessa Wohlschlegel | Beaverton | 12.9 |
| 12 | 12 | Emily Anger | Mancelona | 13.0 |
| 13 | 10 | Delaney Little | Boyne City | 13.6 |
| 14 | 12 | Eva Pray | Elk Rapids | 13.8 |
| 15 | 12 | Jaida Schulte | Elk Rapids | 14.0 |
| 16 | 12 | Margot Hagerty | Traverse City St. Francis | 16.5 |
| 17 | 12 | Ella Peck | Elk Rapids | 17.8 |
| 18 | 9 | Nico Triebold | Grayling | 18.1 |
| 19 | 10 | Tierney Hartman | Grayling | 18.3 |
| 20 | 9 | Emily Dunphy | Traverse City St. Francis | 19.0 |
| 21 | 10 | Myah Little | Kalkaska | 19.4 |
| 22 | 9 | Elizabeth Letherer | Clare | 20.2 |
| 23 | 9 | Lauren Leis | Clare | 23.7 |
| 24 | 12 | Katie Rohrer | Charlevoix | 25.5 |
| 25 | 10 | Joelle Swanson | Elk Rapids | 25.8 |
| 26 | 10 | Laura Spyker | Standish-Sterling | 26.7 |
| 27 | 10 | Cambrynne Giem | Boyne City | 28.2 |
| 28 | 12 | Jocelyn Millikin | Grayling | 30.7 |
| 29 | 9 | Davylynn Christie | Standish-Sterling | 33.3 |
| 30 | 11 | Adrianna Soria | Grayling | 33.5 |
BOYS
Ranked Teams
#1 Traverse City St. Francis
#10 Clare
#16 Charlevoix
#19 Kalkaska
#26 Elk Rapids
Projected Individual Qualifier Cutoff
The #GladPack should occupy many spots in the top-15, after that, individuals can be for the taking. 21st-22nd place.
| Projected Place | Team | Avg. Score | Avg. Place | Win % | Top 3 % |
| 1 | Traverse City St. Francis | 31 | 1.0 | 95+ | 95+ |
| 2 | Clare | 69 | 2.0 | 95+ | |
| 3 | Charlevoix | 93 | 3.2 | 77 | |
| 4 | Kalkaska | 102 | 3.8 | 23 | |
| 5 | Elk Rapids | 121 | 5.0 | ||
| 6 | Boyne City | 200 | 6.6 | ||
| 7 | Roscommon | 206 | 6.9 | ||
| 8 | Grayling | 218 | 7.6 | ||
| 9 | Mancelona | 296 | 9.8 | ||
| 10 | Standish-Sterling | 296 | 10.0 | ||
| 11 | Harrison | 303 | 10.4 | ||
| 12 | Tawas | 328 | 11.8 | ||
| 13 | Beaverton | 358 | 13.0 | ||
| 14 | Charlton Heston Academy | 408 | 14.0 |

| Projected Place | Grade | Name | Team | Avg. Place |
| 1 | 12 | Brad White | Clare | 1.9 |
| 2 | 11 | Leo Swager | Traverse City St. Francis | 2.2 |
| 3 | 12 | Gavin Guggemos | Kalkaska | 3.8 |
| 4 | 11 | Josh Slocum | Traverse City St. Francis | 4.6 |
| 5 | 12 | Tucker Krumm | Traverse City St. Francis | 6.4 |
| 6 | 9 | Hunter Eaton | Charlevoix | 7.3 |
| 7 | 12 | Andrew Klaus | Clare | 8.9 |
| 8 | 11 | Owen Read | Traverse City St. Francis | 10.0 |
| 9 | 11 | Robby Myler | Traverse City St. Francis | 10.3 |
| 10 | 10 | Qwynn Darnell | Elk Rapids | 10.6 |
| 11 | 11 | Lewis Walter | Traverse City St. Francis | 10.8 |
| 12 | 11 | Tristan Demlow | Grayling | 12.5 |
| 13 | 12 | Drew Moore | Grayling | 12.6 |
| 14 | 11 | Riley Pattinson | Traverse City St. Francis | 13.1 |
| 15 | 12 | Nic Porter | Clare | 13.4 |
| 16 | 12 | Adam Williams | Kalkaska | 17.0 |
| 17 | 9 | Connor Schmidt | Clare | 18.0 |
| 18 | 10 | Matthew Solomon | Charlevoix | 18.1 |
| 19 | 11 | Max Ward | Elk Rapids | 18.4 |
| 20 | 12 | Camden Moore | Kalkaska | 18.7 |
| 21 | 11 | David Dhaseleer | Charlevoix | 19.5 |
| 22 | 9 | Isaac Dionne | Boyne City | 20.8 |
| 23 | 10 | Jacob Veurink | Charlevoix | 24.4 |
| 24 | 12 | Christian Kerfoot | Elk Rapids | 24.6 |
| 25 | 12 | Jaymes Wildfong | Mancelona | 25.2 |
| 26 | 9 | Ryder Hopkins | Charlevoix | 26.2 |
| 27 | 10 | Coltrane Paryani | Kalkaska | 27.9 |
| 28 | 9 | Maxwell Drenth | Charlevoix | 28.6 |
| 29 | 11 | Caidan Gaskill | Clare | 29.5 |
| 30 | 12 | Seth Brown | Elk Rapids | 32.2 |

3 thoughts on “2023 Regional Projections: East Jordan Regional”