
Finally, the start of the season we’ve all been waiting for. Throw out all the fast times from September, but apply all the lessons learned through the summer and fall. Regional week is here and with it comes the many projections and previews I’ll write.
Just as last year and throughout the season, I’m projecting these using race simulations. Through a season’s worth of speed ratings, one can determine a runner’s average rating and the variability of those ratings. Both those factors are then weighed towards more recent meets, which are then simulated thousands of times using a Monte Carlo analysis (also described by TullyRunners here). Over those thousands of race simulations, one can determine a team’s average place and average score, a runner’s average place, odds on winning, and odds on qualifying.
These are useful in cross country scenarios, where you have consistent runners and those who are a bit more up and down. For example:
| Tanner Time | Tanner Rating | Tanner Avg. | Tanner StDev. |
| 15:30 | 210 | ||
| 15:45 | 205 | ||
| 16:00 | 200 | ||
| 16:15 | 195 | ||
| 16:30 | 190 | 200 | 7.91 |
| MIXCSR Time | MIXCSR Rating | MIXCSR Avg. | MIXCSR StDev. |
| 16:09 | 197 | ||
| 16:12 | 196 | ||
| 16:15 | 195 | ||
| 16:18 | 194 | ||
| 16:21 | 193 | 195 | 1.58 |
Jacob at his best might be faster than I in four of the five races during the season. I’d almost never be All-State in Division 1, but he might contend for a top-5 spot or place 60th.
If we did 20 simulations, this is how it might turn out:
| Race | Tanner Avg. | Tanner StDev | Tanner Rating | MIXCSR Avg. | MIXCSR StDev | MIXCSR Rating |
| 1 | 200 | 7.9 | 202.1 | 195 | 1.6 | 195.6 |
| 2 | 200 | 7.9 | 196.2 | 195 | 1.6 | 194.1 |
| 3 | 200 | 7.9 | 190.0 | 195 | 1.6 | 199.2 |
| 4 | 200 | 7.9 | 193.4 | 195 | 1.6 | 192.5 |
| 5 | 200 | 7.9 | 206.8 | 195 | 1.6 | 195.7 |
| 6 | 200 | 7.9 | 201.8 | 195 | 1.6 | 196.1 |
| 7 | 200 | 7.9 | 171.6 | 195 | 1.6 | 194.9 |
| 8 | 200 | 7.9 | 189.2 | 195 | 1.6 | 195.9 |
| 9 | 200 | 7.9 | 205.5 | 195 | 1.6 | 197.0 |
| 10 | 200 | 7.9 | 203.8 | 195 | 1.6 | 192.6 |
| 11 | 200 | 7.9 | 192.3 | 195 | 1.6 | 196.5 |
| 12 | 200 | 7.9 | 196.9 | 195 | 1.6 | 196.4 |
| 13 | 200 | 7.9 | 198.5 | 195 | 1.6 | 195.6 |
| 14 | 200 | 7.9 | 203.2 | 195 | 1.6 | 194.1 |
| 15 | 200 | 7.9 | 193.9 | 195 | 1.6 | 192.6 |
| 16 | 200 | 7.9 | 199.3 | 195 | 1.6 | 193.2 |
| 17 | 200 | 7.9 | 208.7 | 195 | 1.6 | 194.2 |
| 18 | 200 | 7.9 | 213.7 | 195 | 1.6 | 194.6 |
| 19 | 200 | 7.9 | 212.6 | 195 | 1.6 | 197.1 |
| 20 | 200 | 7.9 | 206.3 | 195 | 1.6 | 193.9 |
I’d win four times, but I’d never have the ability to win a title like he had in Race 18. He’s usually All-State, but may cost his team a title through his effort in Race 7.
The simulations give the possibilities of those scenarios and all the various scoring scripts. A sixth girl that can pop off on any certain day, a reliable boy who always runs 17-flat, you name it. Hopefully, they better elucidate our contenders, qualifiers, and how these races play out over the weekend.
But always remember, races aren’t run on paper or on a computer. These projections are meant to better our sport, give more attention where little is given. Although I take pride in their accuracy, this endeavor would be quite boring if it were always perfect. I look forward to these being proven wrong and I expect to hear about it as well.
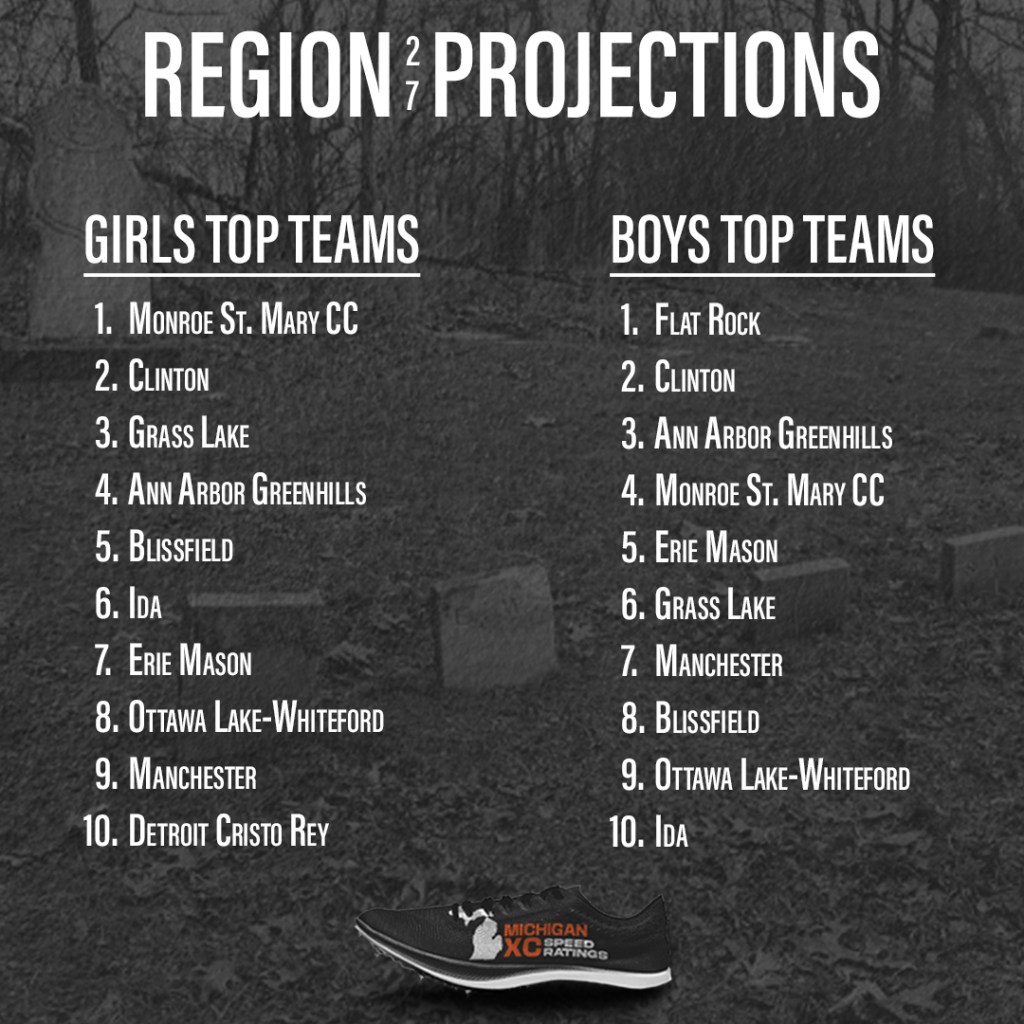
GIRLS
Ranked Teams
#14 Monroe St. Mary CC
#15 Clinton
#19 Grass Lake
#20 Ann Arbor Greenhills
#24 Blissfield
Projected Individual Qualifier Cutoff
15th Place.
| Projected Place | Team | Avg. Score | Avg. Place | Win % | Top 3 % |
| 1 | Monroe St. Mary CC | 65 | 1.6 | 56 | 95+ |
| 2 | Clinton | 67 | 1.8 | 35 | 95+ |
| 3 | Grass Lake | 81 | 3.3 | 61 | |
| 4 | Ann Arbor Greenhills | 85 | 3.7 | 6 | 35 |
| 5 | Blissfield | 92 | 4.6 | 6 | |
| 6 | Ida | 174 | 6.4 | ||
| 7 | Erie Mason | 177 | 6.6 | ||
| 8 | Ottawa Lake-Whiteford | 207 | 8.2 | ||
| 9 | Manchester | 219 | 8.8 | ||
| 10 | Detroit Cristo Rey | 306 | 10.0 |

| Projected Place | Grade | Name | Team | Avg. Place |
| 1 | 11 | Eliza Bush | Ypsilanti Arbor Preparatory | 1.0 |
| 2 | 10 | Hope Miller | Blissfield | 2.7 |
| 3 | 10 | Bella LaFountain | Monroe St. Mary CC | 3.1 |
| 4 | 12 | Cylee Elkins | Clinton | 3.9 |
| 5 | 11 | Megan Woelkers | Flat Rock | 4.8 |
| 6 | 12 | Allison Bowles | Clinton | 6.4 |
| 7 | 10 | Hailey Sills | Blissfield | 8.0 |
| 8 | 9 | Libby Schuster | Ann Arbor Greenhills | 8.2 |
| 9 | 12 | Anika Bery | Ann Arbor Greenhills | 11.2 |
| 10 | 12 | Ava Viegelahn | Grass Lake | 12.2 |
| 11 | 12 | Samantha LaFountain | Monroe St. Mary CC | 12.7 |
| 12 | 12 | Katelyn Bydlowski | Ida | 12.9 |
| 13 | 12 | Samantha Coots | Clinton | 13.5 |
| 14 | 9 | Adeline Stormont | Grass Lake | 15.1 |
| 15 | 11 | Grace Bullock | Grass Lake | 15.1 |
| 16 | 11 | Claire Lisker | Monroe St. Mary CC | 16.0 |
| 17 | 12 | June Miller | Blissfield | 17.5 |
| 18 | 10 | Julia Hughes | Ida | 18.0 |
| 19 | 9 | Juleigh Husby | Monroe St. Mary CC | 18.3 |
| 20 | 9 | Elise Bullock | Grass Lake | 19.7 |
| 21 | 11 | Bailey Meiring | Erie Mason | 20.1 |
| 22 | 10 | Aurelia Bennett | Clinton | 22.9 |
| 23 | 12 | Lydia Bennett | Manchester | 23.5 |
| 24 | 10 | Leona Knudsen | Monroe St. Mary CC | 23.9 |
| 25 | 12 | Vic Cunningham | Ann Arbor Greenhills | 24.5 |
| 26 | 9 | Braelynn Chiotti | Ottawa Lake-Whiteford | 26.1 |
| 27 | 12 | Ava Kittendorf | Ann Arbor Greenhills | 27.9 |
| 28 | 12 | Navya Ashok | Ann Arbor Greenhills | 29.2 |
| 29 | 11 | Sarah King | Clinton | 30.3 |
| 30 | 9 | Kayle Babowicz | Flat Rock | 30.9 |
BOYS
Ranked Teams
#18 Flat Rock
#20 Clinton
#23 Ann Arbor Greenhills
Projected Individual Qualifier Cutoff
15th Place.
| Projected Place | Team | Avg. Score | Avg. Place | Win % | Top 3 % |
| 1 | Flat Rock | 82 | 1.2 | 77 | 95+ |
| 2 | Clinton | 92 | 2.4 | 12 | 91 |
| 3 | Ann Arbor Greenhills | 94 | 2.6 | 11 | 87 |
| 4 | Monroe St. Mary CC | 107 | 3.9 | 21 | |
| 5 | Erie Mason | 126 | 5.1 | ||
| 6 | Grass Lake | 139 | 5.8 | ||
| 7 | Manchester | 176 | 7.3 | ||
| 8 | Blissfield | 184 | 7.9 | ||
| 9 | Ottawa Lake-Whiteford | 198 | 8.9 | ||
| 10 | Ida | 245 | 10.0 | ||
| 11 | Ypsilanti Arbor Preparatory | 268 | 11.0 |

| Projected Place | Grade | Name | Team | Avg. Place |
| 1 | 12 | Keegan Masters | Ottawa Lake-Whiteford | 1.2 |
| 2 | 10 | Jacob Stanislawski | Flat Rock | 1.8 |
| 3 | 10 | Lucas Taraszkiewicz | Flat Rock | 3.2 |
| 4 | 11 | Nathan Vargo | Flat Rock | 4.3 |
| 5 | 9 | Cole Hillegonds | Clinton | 6.2 |
| 6 | 12 | Lincoln Cha | Ann Arbor Greenhills | 7.1 |
| 7 | 10 | Grant Johnson | Manchester | 7.6 |
| 8 | 11 | Ian Waddell | Blissfield | 8.8 |
| 9 | 12 | Lucas Goodman | Clinton | 10.5 |
| 10 | 11 | Gabe Manchester | Clinton | 10.7 |
| 11 | 11 | Parker Campbell | Erie Mason | 12.7 |
| 12 | 11 | Austin Sulier | Erie Mason | 12.7 |
| 13 | 11 | Mason Stranahan | Ann Arbor Greenhills | 12.7 |
| 14 | 10 | Max Foldvary | Monroe St. Mary CC | 13.5 |
| 15 | 12 | Simon VanderVlucht | Monroe St. Mary CC | 14.1 |
| 16 | 12 | Dylan Tengler | Ida | 14.4 |
| 17 | 10 | Henry Beck | Ann Arbor Greenhills | 14.6 |
| 18 | 9 | Zack Buttigieg | Grass Lake | 18.4 |
| 19 | 12 | Hunter Anderson | Manchester | 20.3 |
| 20 | 12 | William Marks | Blissfield | 22.0 |
| 21 | 12 | Zach Kahn | Ottawa Lake-Whiteford | 22.3 |
| 22 | 10 | Henry Wickenheiser | Monroe St. Mary CC | 22.9 |
| 23 | 11 | Eric Ramsey | Clinton | 23.3 |
| 24 | 10 | Alex Holda | Grass Lake | 26.0 |
| 25 | 10 | Jackson Carner | Erie Mason | 27.0 |
| 26 | 10 | Nico Aagesen | Ann Arbor Greenhills | 27.5 |
| 27 | 9 | Domingo Decoster-Elizondo | Grass Lake | 28.9 |
| 28 | 10 | Luke Stanley | Ida | 29.4 |
| 29 | 11 | Kevin Roberts | Ypsilanti Arbor Preparatory | 30.7 |
| 30 | 11 | Caleb Totten | Monroe St. Mary CC | 31.2 |

GIRLS
Ranked Teams
#6 Northville
#25 Livonia Franklin
Projected Individual Qualifier Cutoff
With 5(!) teams in contention for the 3rd spot, your guess is as good as mine.
| Projected Place | Team | Avg. Score | Avg. Place | Win % | Top 3 % |
| 1 | Northville | 47 | 1.0 | 95+ | 95+ |
| 2 | Livonia Franklin | 108 | 2.3 | 95+ | |
| 3 | Salem | 133 | 4.3 | 30 | |
| 4 | Farmington | 133 | 4.3 | 33 | |
| 5 | Livonia Churchill | 140 | 5.3 | 14 | |
| 6 | Livonia Stevenson | 142 | 5.4 | 14 | |
| 7 | Ann Arbor Huron | 145 | 5.7 | 13 | |
| 8 | Canton | 165 | 7.8 | ||
| 9 | Plymouth | 234 | 9.4 | ||
| 10 | Farmington Hills Mercy | 240 | 9.7 | ||
| 11 | Oak Park | 282 | 11.3 | ||
| 12 | Detroit Renaissance | 292 | 11.7 | ||
| 13 | Wayne Memorial | 384 | 13.1 | ||
| 14 | Westland John Glenn | 434 | 13.9 |

| Projected Place | Grade | Name | Team | Avg. Place |
| 1 | 11 | Cassie Garcia | Northville | 1.8 |
| 2 | 12 | Morgan Brown | Livonia Churchill | 2.2 |
| 3 | 12 | Ella Christensen | Northville | 2.2 |
| 4 | 12 | Layla Krayem | Livonia Stevenson | 4.0 |
| 5 | 11 | Ava Peters | Livonia Franklin | 5.5 |
| 6 | 11 | Molly Baracco | Farmington | 7.8 |
| 7 | 11 | Kaelin Hughes | Livonia Stevenson | 10.5 |
| 8 | 10 | Nora Gerzema | Farmington Hills Mercy | 10.7 |
| 9 | 9 | Annabeth Hazlewood | Salem | 10.7 |
| 10 | 10 | Rianna Radulescu | Livonia Churchill | 11.1 |
| 11 | 11 | Catherine Steele | Farmington | 11.6 |
| 12 | 10 | Molly Kate Coates | Northville | 11.7 |
| 13 | 9 | Colette Lozo | Northville | 12.0 |
| 14 | 12 | Emerson Nordbeck | Livonia Franklin | 12.3 |
| 15 | 11 | Lucinda Paliani | Ann Arbor Huron | 13.6 |
| 16 | 12 | Sonya Shelgikar | Ann Arbor Huron | 15.8 |
| 17 | 12 | Kylee King | Oak Park | 17.9 |
| 18 | 10 | McKinnon Nordbeck | Livonia Franklin | 18.0 |
| 19 | 10 | Annabelle Beloiu | Northville | 21.8 |
| 20 | 11 | Rosie Gregory | Northville | 21.9 |
| 21 | 10 | Leena Shelgikar | Ann Arbor Huron | 23.7 |
| 22 | 12 | Nora Schley | Canton | 24.0 |
| 23 | 9 | Julie Schuessler | Livonia Churchill | 24.4 |
| 24 | 12 | Lily Hetzel | Salem | 24.8 |
| 25 | 12 | Aliya Kurian | Plymouth | 25.1 |
| 26 | 11 | Elaina Braunscheidel | Livonia Stevenson | 27.1 |
| 27 | 10 | Rebecca Jud | Salem | 28.1 |
| 28 | 12 | Lily Connors | Northville | 28.5 |
| 29 | 11 | Lauren Bickerdt | Detroit Renaissance | 29.1 |
| 30 | 9 | Katelyn Parrish | Farmington | 29.9 |
BOYS
Ranked Teams
#1 Northville
#4 Canton
#15 Livonia Churchill
#24 Plymouth
Projected Individual Qualifier Cutoff
23rd or 24th place.
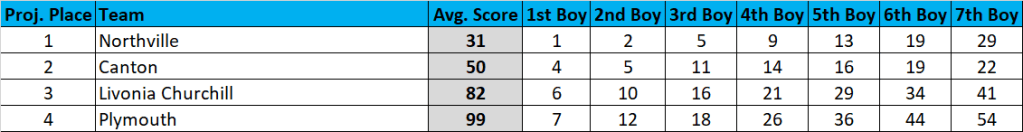
| Projected Place | Team | Avg. Score | Avg. Place | Win % | Top 3 % |
| 1 | Northville | 31 | 1.0 | 95+ | 95+ |
| 2 | Canton | 50 | 2.0 | 95+ | |
| 3 | Livonia Churchill | 82 | 3.1 | 90 | |
| 4 | Plymouth | 99 | 3.9 | 10 | |
| 5 | Ann Arbor Huron | 150 | 5.5 | ||
| 6 | Salem | 154 | 5.6 | ||
| 7 | Detroit U-D Jesuit | 199 | 7.1 | ||
| 8 | Livonia Stevenson | 218 | 7.9 | ||
| 9 | Farmington | 277 | 9.1 | ||
| 10 | Livonia Franklin | 302 | 9.9 | ||
| 11 | Detroit Renaissance | 323 | 10.9 | ||
| 12 | Wayne Memorial | 391 | 12.0 | ||
| 13 | Westland John Glenn | 413 | 13.1 | ||
| 14 | Oak Park | 426 | 13.9 | ||
| 15 | Ferndale | 460 | 15.2 | ||
| 16 | Detroit Mumford | 471 | 15.8 |
| Projected Place | Grade | Name | Team | Avg. Place |
| 1 | 12 | Brendan Herger | Northville | 1.1 |
| 2 | 11 | Ethan Powell | Northville | 1.9 |
| 3 | 12 | Mitchell Clark | Canton | 4.5 |
| 4 | 10 | Aiden Pengelly | Canton | 4.5 |
| 5 | 10 | Benjamin Hartigan | Northville | 6.2 |
| 6 | 12 | Ian Lewis | Livonia Churchill | 8.0 |
| 7 | 11 | Malcolm Spiegle | Livonia Churchill | 8.4 |
| 8 | 12 | Anirudh Krishnan | Plymouth | 8.7 |
| 9 | 11 | Jack Chadwick | Plymouth | 9.8 |
| 10 | 11 | Logan Mullan | Detroit U-D Jesuit | 10.7 |
| 11 | 11 | Nick Barretto | Northville | 11.0 |
| 12 | 11 | Adam Dicken | Canton | 11.2 |
| 13 | 11 | Clark Madden | Canton | 14.8 |
| 14 | 12 | Nicholas Yaquinto | Northville | 15.6 |
| 15 | 9 | Brandon Cloud | Northville | 16.6 |
| 16 | 11 | Joseph Rohmfeld | Livonia Churchill | 17.0 |
| 17 | 10 | Steven Dusseau | Canton | 17.6 |
| 18 | 12 | Brandon Blandino | Canton | 18.6 |
| 19 | 11 | Ben Mussen | Plymouth | 18.9 |
| 20 | 12 | Joey Seale | Salem | 19.4 |
| 21 | 11 | Chase Wolters | Livonia Churchill | 19.5 |
| 22 | 11 | Cole Triffle | Canton | 20.3 |
| 23 | 11 | Jonah Kraft | Ann Arbor Huron | 22.8 |
| 24 | 11 | Walker Brose | Ann Arbor Huron | 23.7 |
| 25 | 11 | Ishaan Kundapur | Northville | 25.6 |
| 26 | 12 | Alex Eplin | Livonia Stevenson | 26.7 |
| 27 | 10 | Lucas LaPointe | Plymouth | 27.2 |
| 28 | 10 | Hudson Wojtkowicz | Livonia Churchill | 29.4 |
| 29 | 12 | Lucas Weintraub | Ann Arbor Huron | 30.5 |
| 30 | 12 | Mitchell Robillard | Salem | 31.5 |

2 thoughts on “2023 Regional Projections – Willow Regional”