

After a day with one and a half meets, one rating, high winds, and hot heat, I decided to dig up a little project I worked on a few winters back. How can one rank the best performances at MIS? One method would be to look at times, as they’re on the same course, a course that has changed very little over the years. Another method would be to produce speed ratings for each race, each year. That would be time-consuming and without context of the entire year, a bit more subjective than the ones I currently create.
Comparing performances against the average times of the day may not be perfect, but it sure is consistent. That’s what I did here.
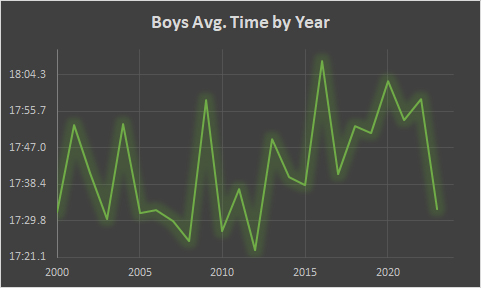
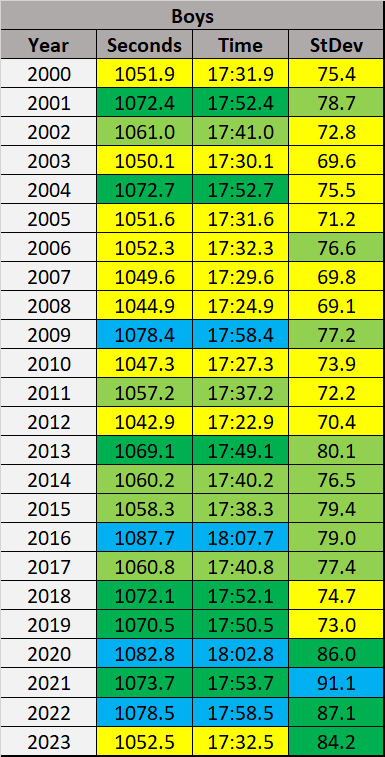
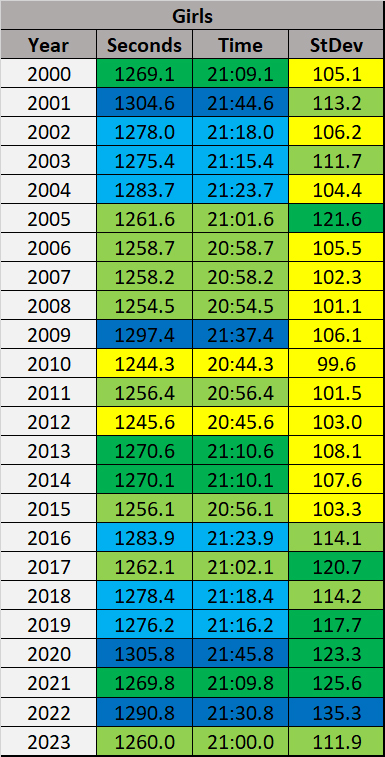
First, the average times by year. A noticeable trend is how quick MIS ran from 2000-2012. Then gradually slowed until 2020, where the average times have gotten a bit slower. An explanation for these past four years is that the qualifying system has brought in more bodies, adding in regional individual qualifiers from beyond 15th place (I can’t find where I filtered for this, but this change added to the average by 5-6 seconds). These additional qualifiers have also heightened the spread of times, as you can see by the stdev’s, showing fields less tightly packed.
Of course, there are outliers too. I seem to recall 2001 being a cold, wet, windy day (and there was a Michigan/MSU game that day where seconds took hours, I’m not sure if that canceled out the slower times). 2009 was a suffocating headwind on the homestretch. 2020, oppressive heat. 2016, storms. This past year, perhaps the only version without any wind.
Has the course itself changed? I’ll defer to those who have worked on the grounds and have been between the lines throughout the years.
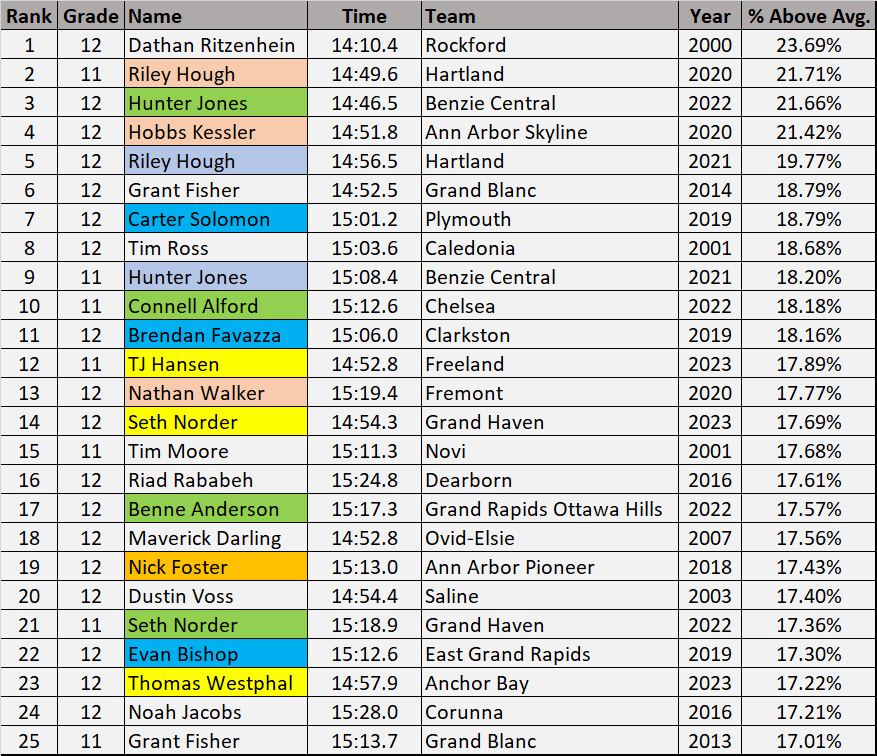
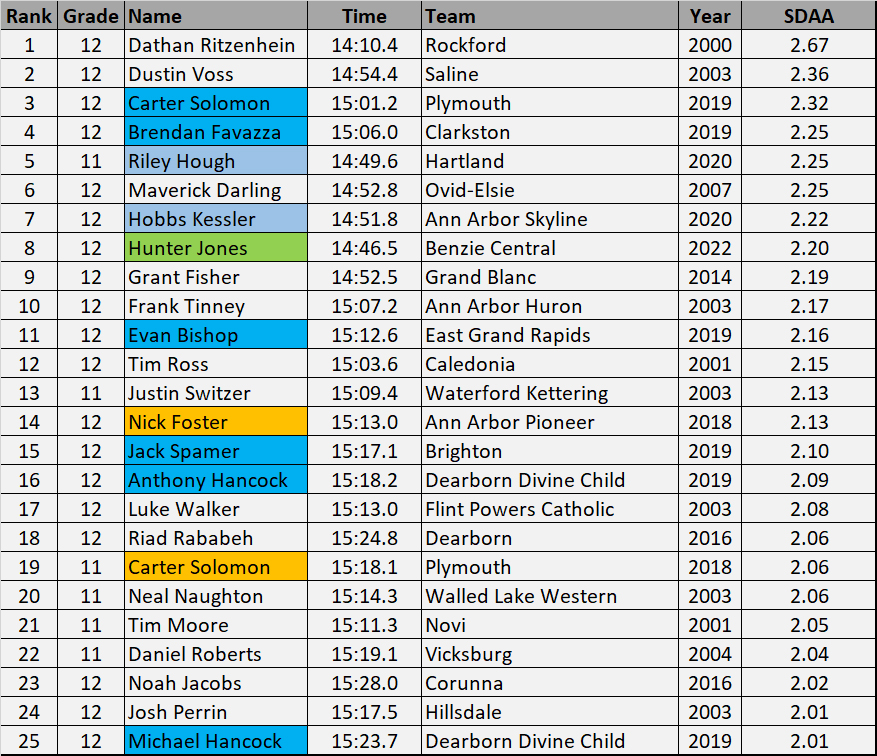
The best performance in the history of the state is Ritz’s 14:10. Perfect course conditions plus an athlete with an undeniable drive. Even throwing numbers out, think of it this way: in the last two+ decades, we’ve had FootLocker Champions, a HS 1500 record holder, and a sub-4 miler who then medaled in the Olympic 5k/10k. Neither of the four were within 35 seconds of Dathan on the same track. I know that the year 2000 was quick, but not quick enough to make up that difference.
Comparing Dathan’s time vs. the field and extrapolating that to recent years, we do see that athletes are getting close. Here’s an approximation of what Ritz may have ran:
2020: 14:35
2021: 14:27
2022: 14:31
2023: 14:10
Both Riley Hough and Hunter Jones were 15 seconds from those marks. Think ahead and project out the future. Our now sophomore class has two kids that were among the best freshmen we’ve seen. I’m wagering that they’ll cut into those 15 seconds.
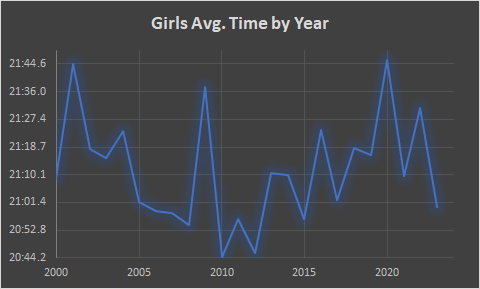
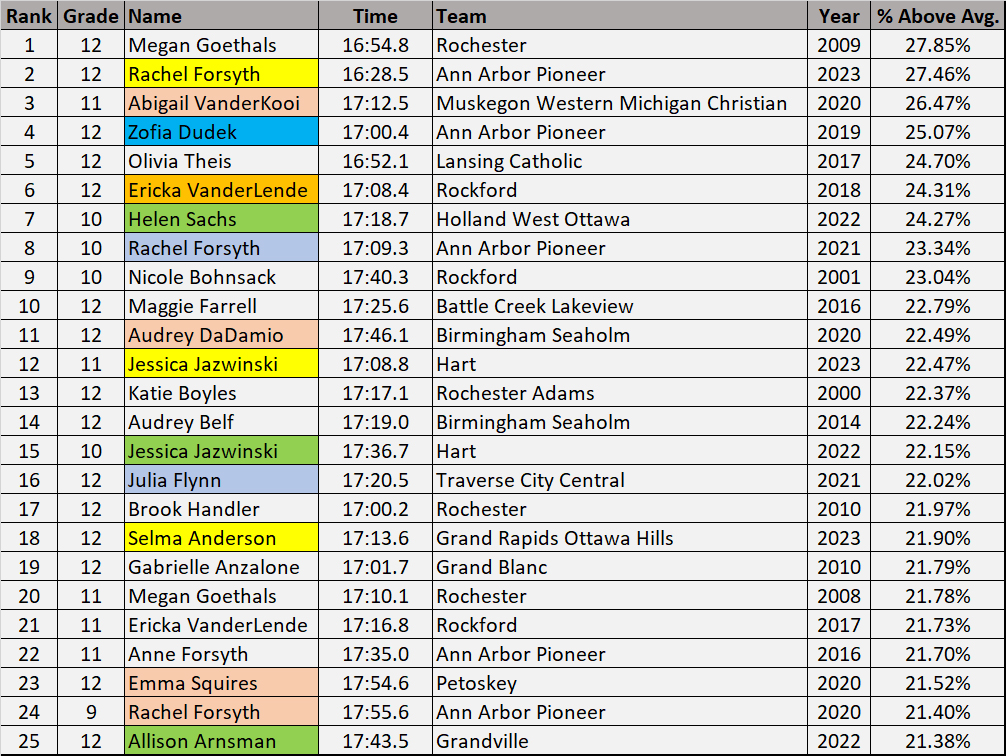
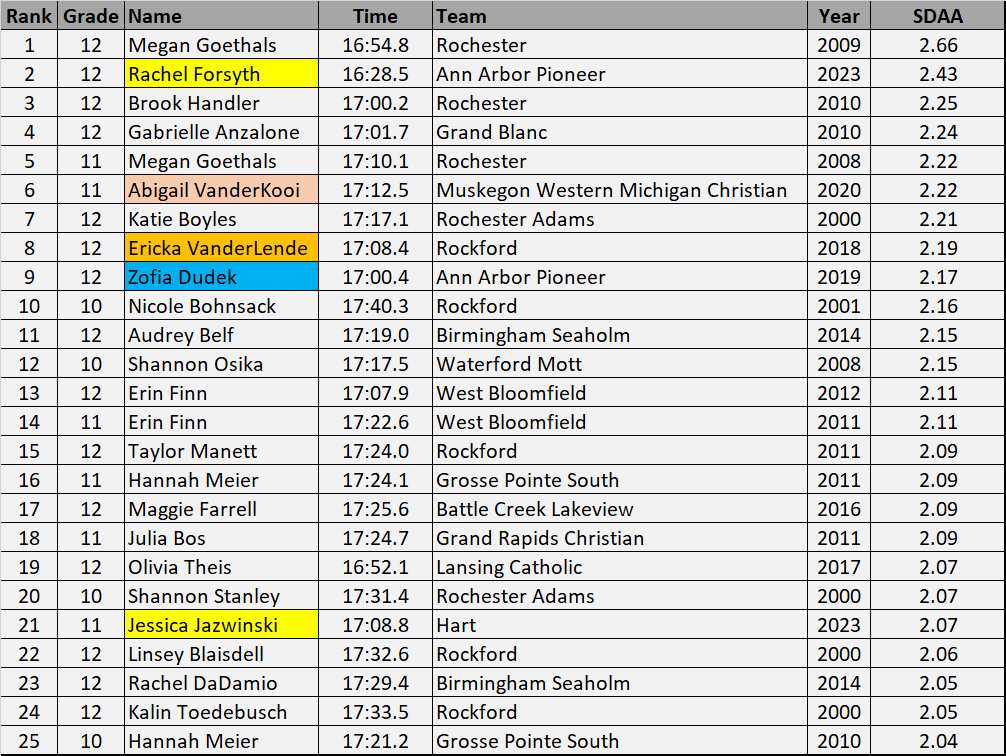
The girls discussion is a bit closer. Controversial? Nah. Goethals was a state and FootLocker champion, Forsyth a state champion and course record holder. Ain’t no controversy there, both are legends.
In terms of wind and all, the 2009 conditions were the polar opposite of 2023. This is reflected in the times, only seven girls dipping under 18:30 on the entire day. Her 16:54 was clear of the second fastest time of the day by 75 seconds.
What could Megan have run on a perfect day? Would Rachel’s MIS performance stack up even higher if the conditions were messy? Forsyth’s race at the SEC Championship may have been even more impressive than her MIS course record. Her 16:40 on a mucky Hudson Mills course cleared the competitive SEC Red field by 2:20. For context, the second place girl in that race later ran 18:25 at State, finishing 15th. Perhaps Rachel does better relative to her peers when the conditions aren’t ideal.
Whatever it is, the highlighted boys and girls are from the time I started this site. We’ve really made a dent into the all-time standings. Let’s keep it up.
Below is a link to a Google doc going 1000 deep. I’d do all 23,000+ State Meet performances, but the internet might break. You can always ask where you (or your coach/parents) stack up.
THE BEST THOUSAND
If we have another subpar weather day, I may look into teams.
