
Finally caught up on sleep, time to start looking back on the State Finals.
The first installment are how the projections (D1, D2, D3, D4) fared against the cold-hearted truth of REALITY.
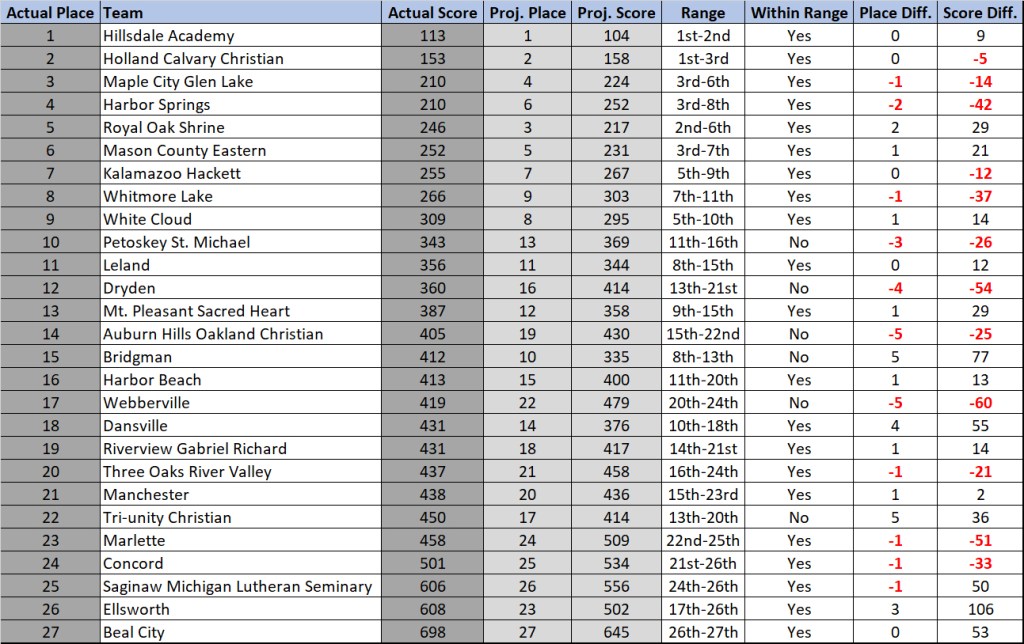
I noted here that I expected to be correct on 7 of the 8 champions, ~13 of the 16 podium teams, and (I guess I didn’t write this) 74 of the 80 top-10 teams. In reality, the projections nailed all 8 champions, 10 of the 16 podium teams, and 71 of the 80 top-10 teams.
In particular, they struggled with 2nd place teams, my theory being that teams in contention, but not favorites, press so hard that they risk suboptimal performances. This allows the patient, well-paced teams to swoop in and earn a trophy. On my end, I think I have to increase the uncertainty to adjust for uncertain conditions and outstanding performances. Although many Michigan kids race in large invites, nothing quite compares to a race track with towering stands, looming over a state title environment. This reflects too in the projected place ranges, where 82% of teams were within the bounds listed beforehand. I’d hope to be more around 90% in the future.
One metric that I track from year to year is the place difference between the projections and reality. In 2023, I had the lowest absolute difference to that point, a 2.23 place difference per team. This year’s version improved on that, standing at an average difference of 2.06 places.
Bad news for you guys, these are getting a little more predictive, so I’m gonna keep doing this in 2025.
There will be more to come on the great individual and team performances of the day.
Division 4 Boys
Division 4 Girls

Division 3 Boys

Division 3 Girls

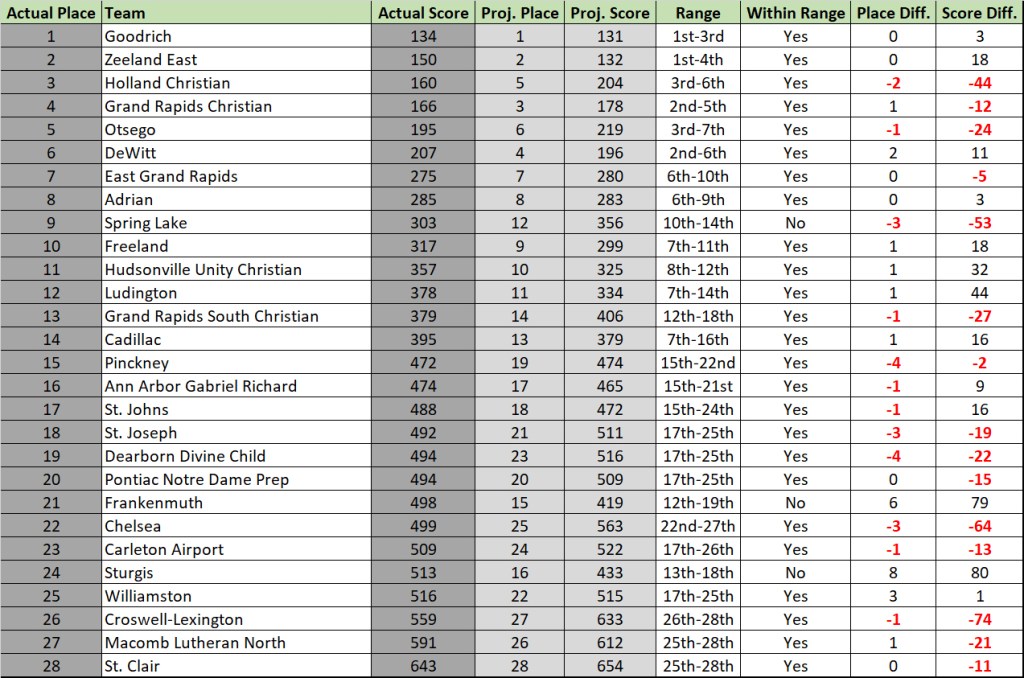
Division 2 Boys

Division 2 Girls
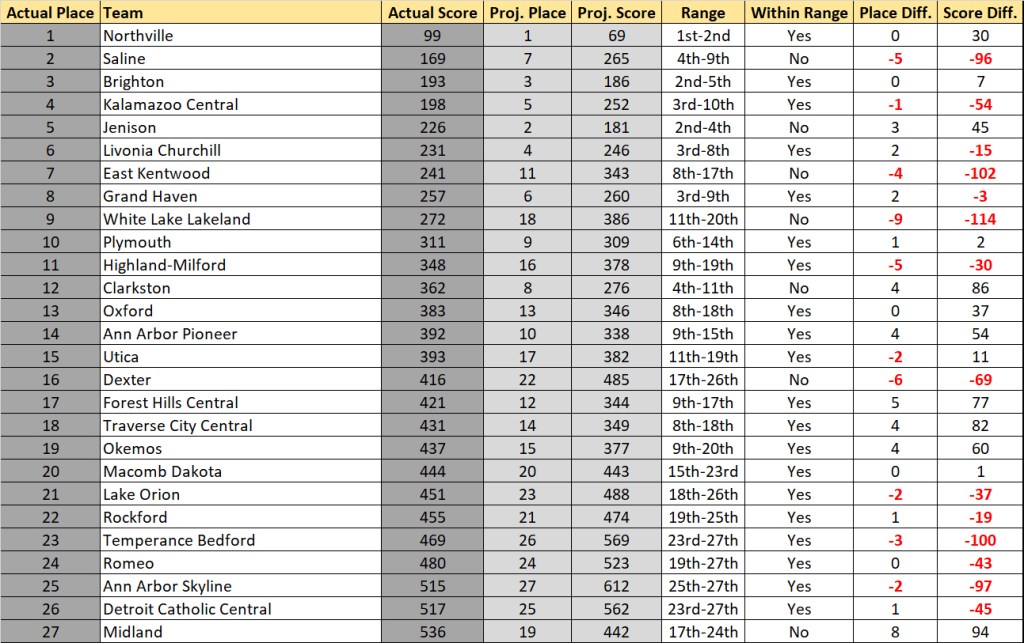
Division 1 Boys
Division 1 Girls

