
There’s so much to report on – STATE RECORDS, unexpected winners, unexpected All-Staters, clutch performers in the final mile. But an easy one to start things off – PROJECTIONS vs. the cold-hearted truth of REALITY.
I didn’t have time (frankly, no clue how I managed time the past two weeks) to write up an expected outcomes post as I did last year. But if you add up the percentages of the 1st place teams, you get an expectation of 5.3 correct. The podium teams, 11.8 correct. The top-10 teams, 67.3 correct. In reality, 5 1st place teams were right (good), 15 podium teams were right (too high), and 68 top-10 teams were right (can’t get much better than that).
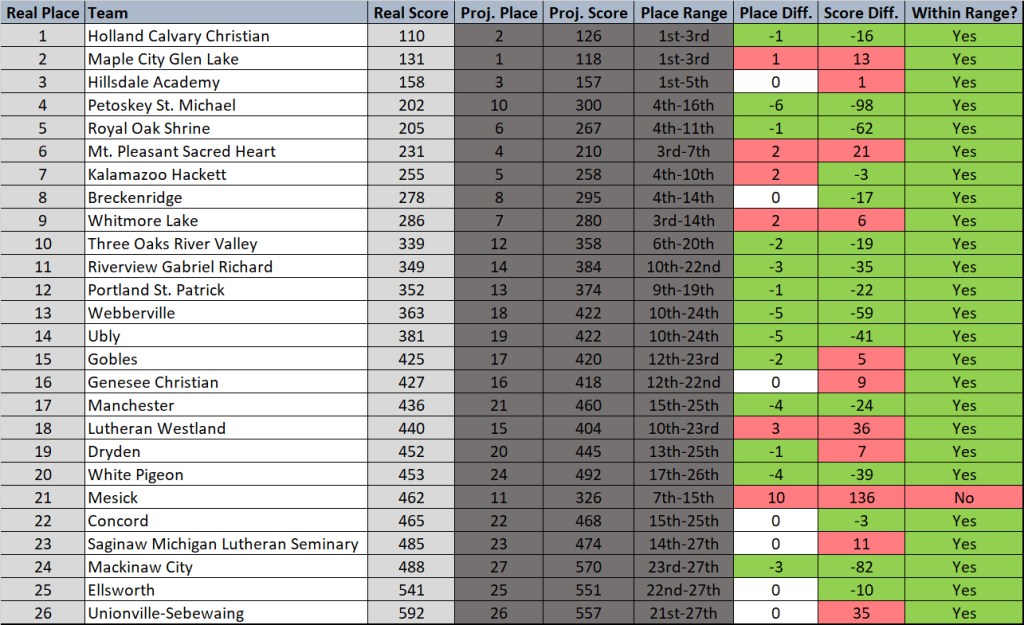
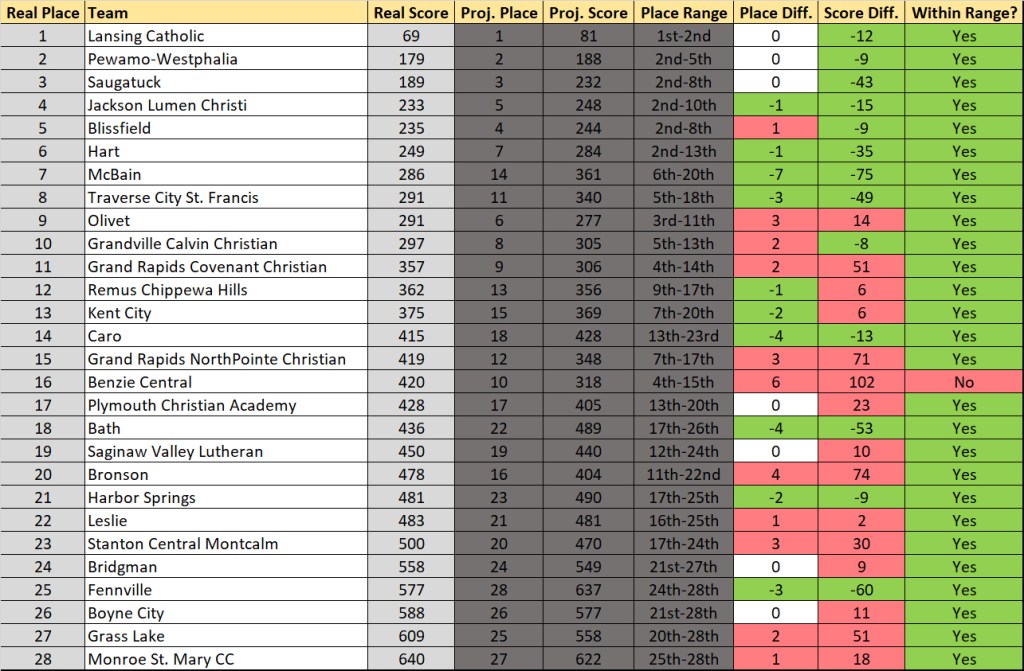
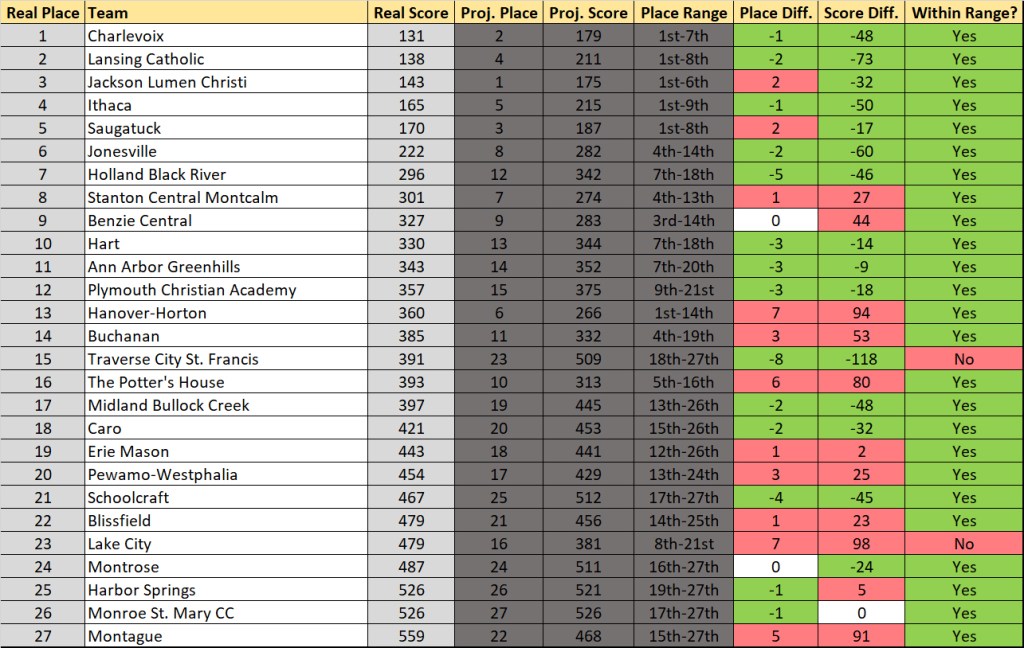
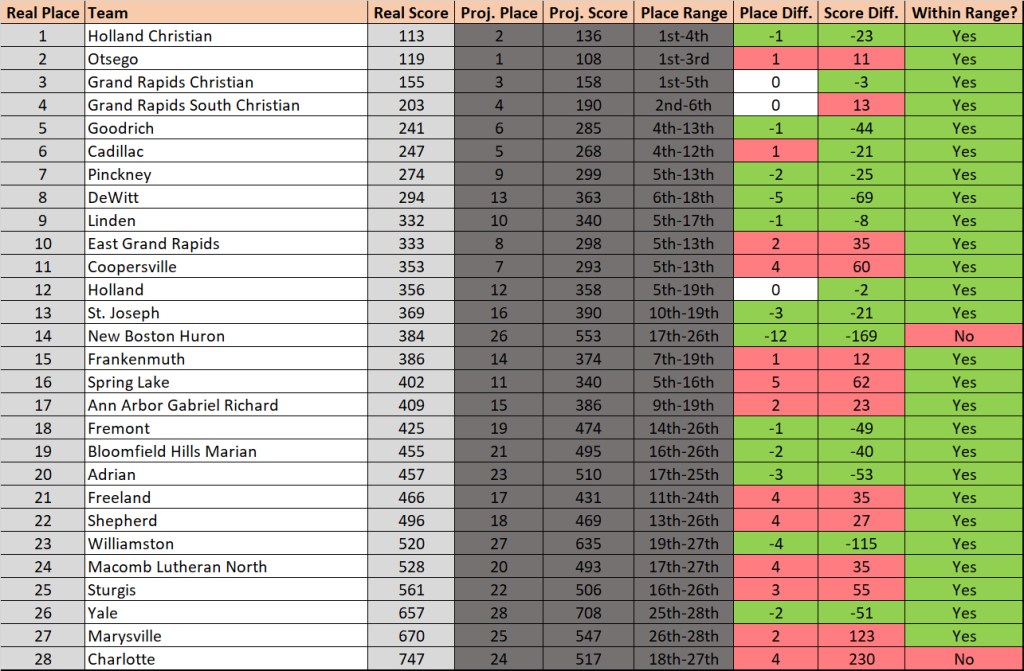
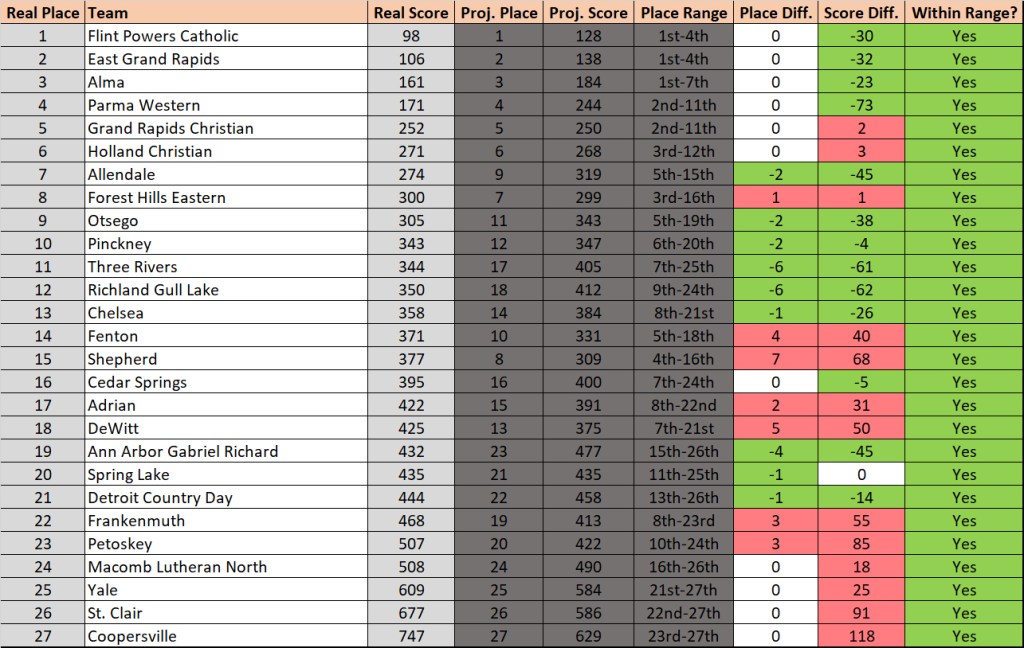
The projected range brings in anything but the outliers, the middle 95% of the places a team could get. The expectation is then that those would be correct on 95% of the teams. They were correct on 94.9% of the teams.
Another metric I track is the overall place difference between the projections and reality. 2024’s was the lowest ever at 2.06 places, these were sadly slightly higher at a 2.09 place difference.
The regional ones were pretty equal to last year, the state projections much improved. The main difference in the projections from 2024 to 2025 were the meets I used to generate the simulations. 2024’s version used the upper 2/3 of a runner’s resume with zero regard for which race those came from. 2025’s version used the entire resume, but filtered out for meets of significance (conference finals, weekend invites, regionals). Each version weighed for recency, meet size, and competitiveness. There will always be tweaks, but going forward, the methodology will likely be more similar to this year’s process.
Once again, horrible news for you folk. These are getting even more predictive, so I’ll be around in 2026.
There will be more to come after MITCA. Gotta hold off on those ratings, I want that competitive edge!
Division 4 Girls

Division 4 Boys
Division 3 Girls
Division 3 Boys
Division 2 Girls
Division 2 Boys
Division 1 Girls

Division 1 Boys

