Finally, the start of the season we’ve all been waiting for. Throw out all the fast times from September, but apply all the lessons learned through the summer and fall. Regional week is here and with it comes the many projections and previews I’ll write.
Just as last year and throughout the season, I’m projecting these using race simulations. Through a season’s worth of speed ratings, one can determine a runner’s average rating and the variability of those ratings. Both those factors are then weighed towards more recent meets, which are then simulated thousands of times using a Monte Carlo analysis (also described by TullyRunners here). Over those thousands of race simulations, one can determine a team’s average place and average score, a runner’s average place, odds on winning, and odds on qualifying.
These are useful in cross country scenarios, where you have consistent runners and those who are a bit more up and down. For example:
| Tanner Time | Tanner Rating | Tanner Avg. | Tanner StDev. |
| 15:30 | 210 | ||
| 15:45 | 205 | ||
| 16:00 | 200 | ||
| 16:15 | 195 | ||
| 16:30 | 190 | 200 | 7.91 |
| MIXCSR Time | MIXCSR Rating | MIXCSR Avg. | MIXCSR StDev. |
| 16:09 | 197 | ||
| 16:12 | 196 | ||
| 16:15 | 195 | ||
| 16:18 | 194 | ||
| 16:21 | 193 | 195 | 1.58 |
Jacob at his best might be faster than I in four of the five races during the season. I’d almost never be All-State in Division 1, but he might contend for a top-5 spot or place 60th.
If we did 20 simulations, this is how it might turn out:
| Race | Tanner Avg. | Tanner StDev | Tanner Rating | MIXCSR Avg. | MIXCSR StDev | MIXCSR Rating |
| 1 | 200 | 7.9 | 202.1 | 195 | 1.6 | 195.6 |
| 2 | 200 | 7.9 | 196.2 | 195 | 1.6 | 194.1 |
| 3 | 200 | 7.9 | 190.0 | 195 | 1.6 | 199.2 |
| 4 | 200 | 7.9 | 193.4 | 195 | 1.6 | 192.5 |
| 5 | 200 | 7.9 | 206.8 | 195 | 1.6 | 195.7 |
| 6 | 200 | 7.9 | 201.8 | 195 | 1.6 | 196.1 |
| 7 | 200 | 7.9 | 171.6 | 195 | 1.6 | 194.9 |
| 8 | 200 | 7.9 | 189.2 | 195 | 1.6 | 195.9 |
| 9 | 200 | 7.9 | 205.5 | 195 | 1.6 | 197.0 |
| 10 | 200 | 7.9 | 203.8 | 195 | 1.6 | 192.6 |
| 11 | 200 | 7.9 | 192.3 | 195 | 1.6 | 196.5 |
| 12 | 200 | 7.9 | 196.9 | 195 | 1.6 | 196.4 |
| 13 | 200 | 7.9 | 198.5 | 195 | 1.6 | 195.6 |
| 14 | 200 | 7.9 | 203.2 | 195 | 1.6 | 194.1 |
| 15 | 200 | 7.9 | 193.9 | 195 | 1.6 | 192.6 |
| 16 | 200 | 7.9 | 199.3 | 195 | 1.6 | 193.2 |
| 17 | 200 | 7.9 | 208.7 | 195 | 1.6 | 194.2 |
| 18 | 200 | 7.9 | 213.7 | 195 | 1.6 | 194.6 |
| 19 | 200 | 7.9 | 212.6 | 195 | 1.6 | 197.1 |
| 20 | 200 | 7.9 | 206.3 | 195 | 1.6 | 193.9 |
I’d win four times, but I’d never have the ability to win a title like he had in Race 18. He’s usually All-State, but may cost his team a title through his effort in Race 7.
The simulations give the possibilities of those scenarios and all the various scoring scripts. A sixth girl that can pop off on any certain day, a reliable boy who always runs 17-flat, you name it. Hopefully, they better elucidate our contenders, qualifiers, and how these races play out over the weekend.
But always remember, races aren’t run on paper or on a computer. These projections are meant to better our sport, give more attention where little is given. Although I take pride in their accuracy, this endeavor would be quite boring if it were always perfect. I look forward to these being proven wrong and I expect to hear about it as well.

GIRLS
Ranked Teams
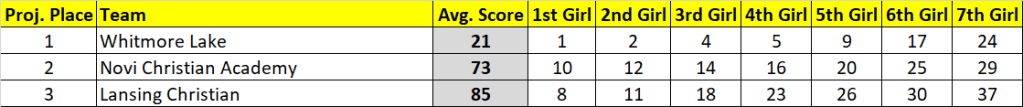
#1 Whitmore Lake
#14 Novi Christian Academy
#21 Lansing Christian
#25 Fowler
#27 Livingston Christian
Projected Individual Qualifier Cutoff
17th Place, behind all them Whitmore Lake Trojans.
| Projected Place | Team | Avg. Score | Avg. Place | Win % | Top 3 % |
| 1 | Whitmore Lake | 21 | 1.0 | 95+ | 95+ |
| 2 | Novi Christian Academy | 73 | 2.1 | 95+ | |
| 3 | Lansing Christian | 85 | 2.9 | 95+ | |
| 4 | Fowler | 105 | 4.3 | ||
| 5 | Livingston Christian | 108 | 4.8 | ||
| 6 | Portland St. Patrick | 123 | 5.9 | ||
| 7 | Byron | 197 | 7.0 |
| Projected Place | Grade | Name | Team | Avg. Place |
| 1 | 9 | Kaylie Livingston | Whitmore Lake | 1.0 |
| 2 | 10 | Carina Burchi | Whitmore Lake | 2.2 |
| 3 | 10 | Taylor Wiegand | Livingston Christian | 3.9 |
| 4 | 10 | Sofia Robertson | Whitmore Lake | 4.5 |
| 5 | 12 | Natalie Meadows | Whitmore Lake | 4.9 |
| 6 | 12 | Isabella Yeoman | Genesee | 5.5 |
| 7 | 12 | Ellayna Meredith | Portland St. Patrick | 8.1 |
| 8 | 11 | Kelcie Pung | Fowler | 8.7 |
| 9 | 9 | Adrienne Mitchell | Lansing Christian | 9.3 |
| 10 | 10 | Elodie Weaver | Whitmore Lake | 10.8 |
| 11 | 11 | Ava Mustapha | Lansing Christian | 13.1 |
| 12 | 12 | Mya Guillermo | Novi Christian Academy | 13.3 |
| 13 | 8 | Madison Markowicz | Novi Christian Academy | 14.0 |
| 14 | 10 | Abigail Yatooma | Novi Christian Academy | 15.3 |
| 15 | 11 | Brooke Sonnenberg | Genesee Christian Academy | 17.5 |
| 16 | 9 | Ezrielle Martin | Livingston Christian | 18.5 |
| 17 | 11 | Autumn Reynolds | Potterville | 18.7 |
| 18 | 9 | Marian Davlin | Portland St. Patrick | 19.2 |
| 19 | 12 | Josie Dubuc | Novi Christian Academy | 19.8 |
| 20 | 12 | Ciara Parsons | Whitmore Lake | 21.4 |
| 21 | 12 | Autumn Troupe | Novi Christian Academy | 21.8 |
| 22 | 12 | Rebecca Smith | Fowler | 22.5 |
| 23 | 10 | Juliette Tallon | Lansing Christian | 22.6 |
| 24 | 9 | Isabella Halfmann | Fowler | 23.9 |
| 25 | 10 | Averie Zinn | Genesee | 25.3 |
| 26 | 11 | Isabella Nelson-Daniels | Whitmore Lake | 25.8 |
| 27 | 8 | Abigail Galazka | Livingston Christian | 26.4 |
| 28 | 9 | Annie Wernet | Lansing Christian | 28.9 |
| 29 | 12 | Grace O’Hare | Fowler | 29.9 |
| 30 | 12 | Hope Tebben | Lansing Christian | 30.1 |
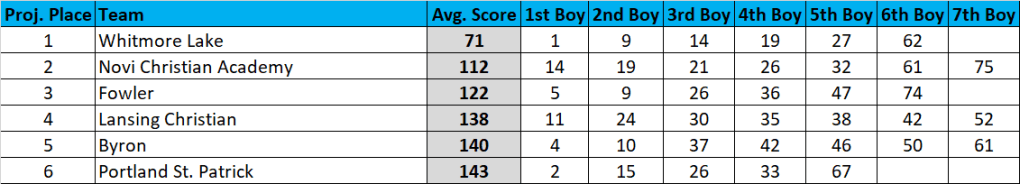
BOYS
Ranked Teams
#23 Whitmore Lake
Projected Individual Qualifier Cutoff
Get in the top-15! My guess is 80% of the top-10 finishers are from non-qualifying teams.
| Projected Place | Team | Avg. Score | Avg. Place | Win % | Top 3 % |
| 1 | Whitmore Lake | 71 | 1.0 | 95+ | 95+ |
| 2 | Novi Christian Academy | 112 | 2.3 | 94 | |
| 3 | Fowler | 122 | 3.1 | 73 | |
| 4 | Lansing Christian | 138 | 4.7 | 12 | |
| 5 | Byron | 140 | 4.9 | 16 | |
| 6 | Portland St. Patrick | 143 | 5.4 | ||
| 7 | Waterford Our Lady of the Lakes | 165 | 7.1 | ||
| 8 | Webberville | 184 | 8.4 | ||
| 9 | Livingston Christian | 185 | 8.5 | ||
| 10 | Potterville | 206 | 9.9 | ||
| 11 | Genesee | 224 | 10.8 | ||
| 12 | Genesee Christian Academy | 252 | 11.9 | ||
| 13 | Morrice | 303 | 13.0 |
| Projected Place | Grade | Name | Team | Avg. Place |
| 1 | 10 | Landen Livingston | Whitmore Lake | 1.5 |
| 2 | 10 | Timothy Chamberlain | Portland St. Patrick | 2.4 |
| 3 | 12 | Connor Rouse | Genesee | 3.0 |
| 4 | 12 | Trevor Feldpausch | Fowler | 5.0 |
| 5 | 10 | Josiah Johncox | Byron | 5.4 |
| 6 | 12 | Ethan Gray | Byron | 9.2 |
| 7 | 10 | Quentin Smith | Fowler | 9.3 |
| 8 | 10 | Tyler Langfeldt | Potterville | 9.8 |
| 9 | 10 | Ben Young | Lansing Christian | 10.8 |
| 10 | 11 | Aaron Crittenden | Potterville | 11.7 |
| 11 | 11 | Nate Dillon | Whitmore Lake | 12.2 |
| 12 | 9 | Benjamin Fox | Whitmore Lake | 14.1 |
| 13 | 10 | Isaac FoxElster | Portland St. Patrick | 14.6 |
| 14 | 10 | Nathan Camilleri | Waterford Our Lady of the Lakes | 14.7 |
| 15 | 10 | Gavin Howery | Webberville | 15.5 |
| 16 | 10 | Reuben Jiran | Novi Christian Academy | 16.6 |
| 17 | 12 | Luke Shenton | Novi Christian Academy | 17.8 |
| 18 | 11 | Karl Wegner | Waterford Our Lady of the Lakes | 18.2 |
| 19 | 12 | Reily Henderson | Whitmore Lake | 18.7 |
| 20 | 11 | Samuel Hubbard | Livingston Christian | 19.0 |
| 21 | 10 | Ethan West | Webberville | 19.8 |
| 22 | 12 | Jobe Skaff | Novi Christian Academy | 21.2 |
| 23 | 10 | Ian Ferguson | Genesee Christian Academy | 22.9 |
| 24 | 11 | Caleb Valentine | Whitmore Lake | 24.8 |
| 25 | 8 | Trey Johnson | Livingston Christian | 24.9 |
| 26 | 12 | Ryan Williams | Novi Christian Academy | 25.8 |
| 27 | 10 | Matias Greve | Lansing Christian | 26.1 |
| 28 | 9 | Landon Miller | Fowler | 26.2 |
| 29 | 9 | Francis Austen | Portland St. Patrick | 27.3 |
| 30 | 9 | Nolan Gallagher | Novi Christian Academy | 30.8 |