The Best Crews have been a thing around here for the past few years. They take their cues from USTFCCCA’s event squads and the World Athletics scoring system, combining the two ideas in order to compare Michigan’s teams against events in their common areas.
The goal of this is to help recognize the athletes and coaches that create cultures, history, and traditions in their respective event areas. Think about it like this: Minnesota always has great hockey, basketball hoops are nailed to Indiana barns, Texas churns out football talent, every Iowa boy has cauliflower ear. Where in Michigan does hurdling reign supreme? Is there a town where kids learn to shot put before they can tie their shoes?
2023’s explanation goes through much of it, but two things have changed for this year.
the Boys 200m points have been re-mathed and edited, as previous versions sold short athletes such as Jeremy Dixon and Jake Machiniak when it came to season end rankings.
instead of using a team’s top-four athletes to generate their total for an event, I’m using their top-three. Belleville’s hurdlers are the main reason for this, there’s no way they shouldn’t have been the top D1 squad last year. I feel this will better portray a team’s top athletes.
Here are the figures that show the points for each mark:
In the past, I’ve struggled grasping exactly what I want to write about for each event or division. Thankfully, these early qualifiers make it easy! If you’ve qualified in the timeframe before your event area has been posted or in between those posts, you’ll get a little sentence or three.
These contain results uploaded to athletic.net by Sunday (4/6) morning.
Grade
Name
Mark
Event
Points
Team
12
Greta Caprathe
5′ 8″
High Jump
517
Rockford
12
Greta Caprathe
17′ 6″
Long Jump
418
Rockford
12
Ashley Williams
16′ 5″
Long Jump
373
Rockford
11
Elise Watkins
5′ 0″
High Jump
363
Rockford
12
Layla Visser
5′ 0″
High Jump
363
Rockford
11
Elise Watkins
15′ 7″
Long Jump
338
Rockford
12
Kierra Clum
4′ 10″
High Jump
324
Rockford
10
Lucy Mason
4′ 10″
High Jump
324
Rockford
9
Mj Obenauf
15′ 1.75″
Long Jump
320
Rockford
Rank
Team
High Jump
Long Jump
Total
1
Rockford
1242
1130
2372
2
East Kentwood
324
1078
1403
3
Zeeland East
725
406
1132
4
Ann Arbor Pioneer
725
345
1071
5
Middleville Thornapple-Kellogg
–
999
999
6
Grand Haven
649
342
990
7
Mason
440
378
818
8
Clarkston
401
350
752
9
Holt
–
736
736
10
Macomb Dakota
725
–
725
11
Woodhaven Brownstown
401
323
725
12
Brighton
363
339
702
13
Livonia Churchill
324
373
697
14
Byron Center
–
683
683
14
Northville
–
683
683
16
Lake Orion
324
352
676
17
Hudsonville
324
349
673
18
Grosse Pointe South
–
659
659
19
Rochester Hills Stoney Creek
649
–
649
20
Troy
324
321
645
21
Grosse Pointe North
324
317
642
22
Zeeland West
–
639
639
23
Dearborn Edsel Ford
–
441
441
24
Harrison Twp. L’Anse Creuse
401
–
401
25
Muskegon Reeths-Puffer
–
399
399
Grade
Name
Mark
Event
Points
Team
10
Zay McGinnis
21′ 11.5″
Long Jump
421
Mount Pleasant
10
Zay McGinnis
21′ 8″
Long Jump
408
Mount Pleasant
12
Jackson Griffin
6′ 0″
High Jump
377
Mount Pleasant
12
Sam Henrie
5′ 10″
High Jump
349
Mount Pleasant
Rank
Team
High Jump
Long Jump
Total
1
Mount Pleasant
726
829
1556
2
East Kentwood
349
1198
1547
3
Kalamazoo Loy Norrix
698
768
1466
4
Canton
726
537
1263
5
Hudsonville
419
781
1201
6
Harrison Twp. L’Anse Creuse
811
355
1166
7
Grand Haven
405
746
1151
8
Zeeland West
377
771
1148
9
Holland West Ottawa
783
345
1127
10
Rockford
726
345
1071
11
Jenison
726
343
1069
12
Belleville
349
465
814
13
Woodhaven Brownstown
434
375
808
14
Portage Central
391
384
775
15
Northville
377
387
764
16
Walled Lake Western
405
349
754
17
Bay City Western
754
–
754
17
Forest Hills Northern
754
–
754
17
Lapeer
754
–
754
20
Traverse City Central
–
746
746
21
Ann Arbor Huron
–
744
744
22
Dexter
726
–
726
23
Grand Rapids Northview
–
721
721
24
Jackson
349
355
704
25
Troy
–
449
449
Grade
Name
Mark
Event
Points
Team
9
Morgan Willick
5′ 0″
High Jump
363
Grand Rapids West Catholic
12
Aislynn Sweedyk
4′ 10″
High Jump
324
Grand Rapids West Catholic
12
Alexis Szymanski
15′ 0″
Long Jump
314
Grand Rapids West Catholic
9
Mackenzie Clancy
4′ 8″
High Jump
286
Grand Rapids West Catholic
12
Mia Henne
4′ 8″
High Jump
286
Grand Rapids West Catholic
Rank
Team
High Jump
Long Jump
Total
1
Grand Rapids West Catholic
973
314
1287
2
Holland Christian
363
791
1154
3
Detroit Country Day
687
370
1057
4
Gladwin
706
336
1042
5
Hudsonville Unity Christian
649
312
961
6
Coldwater
572
332
904
7
Allendale
572
317
889
8
Hastings
440
406
846
9
Dearborn Divine Child
324
432
757
10
Ferndale
–
748
748
11
Charlotte
725
–
725
12
Stevensville Lakeshore
286
430
716
13
Shepherd
324
366
690
14
Eaton Rapids
324
357
682
15
Ann Arbor Gabriel Richard
324
353
677
16
Wayland Union
324
336
661
17
East Grand Rapids
324
315
639
18
Williamston
286
352
638
19
Battle Creek Pennfield
286
335
621
20
Forest Hills Eastern
286
323
608
21
Benton Harbor
–
430
430
22
Battle Creek Harper Creek
401
–
401
22
Edwardsburg
401
–
401
22
Yale
401
–
401
25
Grand Rapids Catholic Central
–
388
388
Early Qualifiers
Joey DeCasas, Pontiac Notre Dame Prep
21’4″ – Long Jump
A senior that began in the sport just one year ago. He’s been a quick learner in the long jump, placing 2nd in Oakland County and 3rd in Division 2 last year.
Grade
Name
Mark
Event
Points
Team
12
Joe Strabbing
6′ 4″
High Jump
434
Holland Christian
11
Jayden Rees
6′ 0″
High Jump
377
Holland Christian
12
Josh Bruxvoort
20′ 5.25″
Long Jump
356
Holland Christian
11
Isaac DeMaster
5′ 10″
High Jump
349
Holland Christian
11
Isaiah Myaard
20′ 1″
Long Jump
341
Holland Christian
Rank
Team
High Jump
Long Jump
Total
1
Holland Christian
1160
697
1857
2
Wayland Union
1075
348
1423
3
Whitehall
952
327
1279
4
Orchard Lake St. Mary’s
740
331
1072
5
Wyoming Godwin Heights
698
346
1043
6
Battle Creek Harper Creek
–
966
966
7
Stevensville Lakeshore
419
406
825
8
Clarenceville
405
378
784
9
Dearborn Divine Child
377
398
775
10
Adrian
–
755
755
11
Grand Rapids West Catholic
754
–
754
12
Howard City Tri-County
740
–
740
13
Pontiac Notre Dame Prep
–
738
738
14
Belding
–
730
730
15
Niles
–
721
721
16
Dundee
391
323
715
17
Coldwater
–
710
710
18
Sturgis
377
327
704
19
Shepherd
698
–
698
20
North Branch
670
–
670
21
St. Joseph
–
668
668
22
Jackson Northwest
–
661
661
23
Benton Harbor
349
309
658
24
Saginaw Swan Valley
335
313
648
25
Marshall
–
624
624
Grade
Name
Mark
Event
Points
Team
12
Mckenzie Derusha
5′ 0″
High Jump
363
Saginaw Valley Lutheran
11
Ava Kelsey
15′ 9″
Long Jump
345
Saginaw Valley Lutheran
10
Hannah Burhop
4′ 10″
High Jump
324
Saginaw Valley Lutheran
9
Lindsey Cmeyla
14′ 9″
Long Jump
303
Saginaw Valley Lutheran
Rank
Team
High Jump
Long Jump
Total
1
Saginaw Valley Lutheran
687
649
1336
2
Ithaca
533
688
1221
3
The Potter’s House
725
411
1137
4
Remus Chippewa Hills
896
–
896
5
Ida
495
317
812
6
Olivet
363
310
673
7
Schoolcraft
363
296
659
8
Harrison
324
330
655
9
LeRoy Pine River
649
–
649
10
Ravenna
324
319
643
11
Lansing Catholic
324
307
631
12
Stanton Central Montcalm
286
336
622
13
Manton
610
–
610
14
Coloma
305
303
608
15
Grass Lake
286
314
600
16
Napoleon
286
312
598
17
Centreville
572
–
572
18
Ann Arbor Greenhills
533
–
533
18
Blissfield
533
–
533
18
Chesaning
533
–
533
18
Hanover-Horton
533
–
533
18
Quincy
533
–
533
23
Newaygo
–
370
370
24
Hart
363
–
363
24
Jonesville
363
–
363
Early Qualifiers
Noah Rufenacht, Quincy
6′ 3″ – High Jump
On five separate occasions before 2024’s Regional meet, Noah had leapt over 6 feet, Division 3’s additional qualifying standard. In a tough region where 5 high jumpers qualified, Noah was 6th place, only getting to 5′ 10″. Eleven months later, he’s made it, without having to sweat regional day. Pressure off and judging by his indoor marks, I bet there’s more to come.
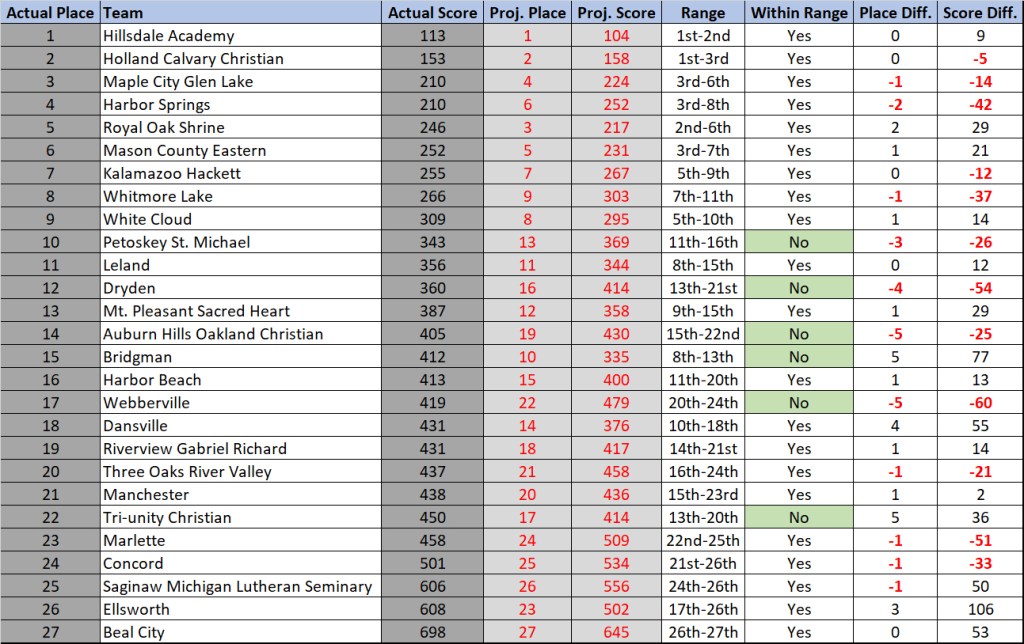
Hillsdale Academy is far and away the favorite. The Colts have returned four of their five scorers and five of their varsity runners from 2023’s state championship. This fall, they’ve taken part in three meets with a decent range of D4 competition: Holly, Portage, and Class D. Each were significant victories. Fast and deep, they’ve shown the ability to place all scorers in the low-17’s or faster.
Following a rough showing at Spartan, Holland Calvary Christian has been able to move up and then stabilize. Perhaps the greatest example of that stability comes again from Portage, where the Crusaders packed up in the mid-17’s, opening up a 40-point gap on the rest of the D4 field.
These two teams are the overwhelming favorites to grab spots on the podium. Beyond the two, it appears that 3rd thru 9th places are up for grabs, then a few teams will be in contention for the 10th spot.
What went down?
As projected, Hillsdale Academy’s Colts prevailed, winning their second consecutive title and 3rd in 4 years. Although not as large as projected, the gap was significant, 40 points. The Colts dominated the race from the outset, hovering near 100 points at each mile split, while other teams were hovering around 200 for the first few miles. Their top four all secured personal or season bests. James Rahe stepped into the 3rd spot, hitting his first ever sub-17. Grayson Rorick and Reece Poole each grabbed their third consecutive All-State.
Just as they had at Spartan, Holland Calvary Christian packed up, moved up, and trophied up. The Crusaders were in 7th place at the mile, 3rd at two, then moved into 2nd at the finish. Personal bests or season bests from their top-6, all of those 6 under 17:30. That’s two straight trophies for these young Crusaders, perhaps taking that next step in the coming years. The 3rd-9th spots were indeed all up for grabs. All teams that were projected in the top-9 were able to find their way into that placing, and we had a little surprise in 10th, Petoskey St. Michael. The Guardians, along with Webberville and Dryden, were one of three teams to finish ahead of their projected range.
What did we initially write?
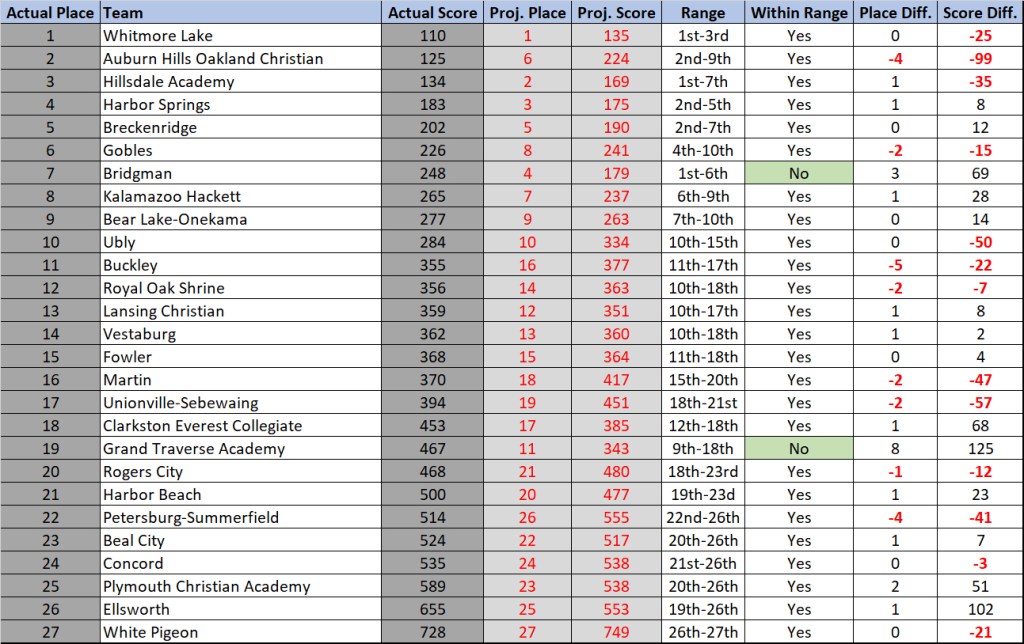
Another returning champion that is in the driver’s seat. Whitmore Lake lost a three-time All-Stater from their 2023 squad and has had girls step up in her absence. The Trojans are unafraid of competition, traveling to Shepherd on multiple occasions to face off against teams from higher divisions. At Portage and Holly, they stuck to their own division, walking away with victories at each spot.
If the Trojans were to fall, likely contenders are Hillsdale Academy and Bridgman. The two squads placed within three points of each other at Portage and have each shown signs that they’re capable of pulling an upset. For the Bees, it was Christian Comet; the Colts, Region 34. Those two races saw the teams place all scorers under 21:30, which would give the hope that they can create enough of a gap on Whitmore Lake’s depth.
I love the combinations of teams that could get on the podium. The most intriguing is Auburn Hills Oakland Christian. Their regional course ran about as fair as one can imagine, yet the Lancer trio of frontrunners were able to slip under 20-flat. Math could work out in their favor if their score through three is low enough.
What went down?
As expected, Whitmore Lake scored between 100-150 points and won another state title. Unexpected, however, was the gap. Projections had the Trojans at 135 points, clear of 2nd place by nearly 35 points. But not so! If the Trojans had hit their 135 projected points, 2nd place would be in the cards. Kaylie Livingston, Elodie Weaver, and Carina Burchi all did their All-State or State Champion work, which are great in an individual sense, but not as impactful in the team scoring. The 4th and 5th spots were huge, Sofia Robertson drawing from years of championship experience and Malynda Lambros finding a 40+ second PR. Lambros was projected well above 100th place and finished 63rd. I guess when you train with these high performers all season, you gain the confidence that you too can perform on the big stage.
The Trojans needed to perform on the big stage because Auburn Hills Oakland Christian sure did. The preview laid out a scenario where the Lancer top-three scored low enough to inflict some real damage. Through their top-three, Oakland Christian was right there. Through their top-four, Oakland Christian was right there. Senior Bridget Miller was a great factor in the Lancer uprising, dropping nearly a minute from her previous best. These OC girls continually improved throughout the season, culminating in a magical finish at the State Finals.
Overall, 25 of the 27 teams finished within their projected range.
What did we initially write?
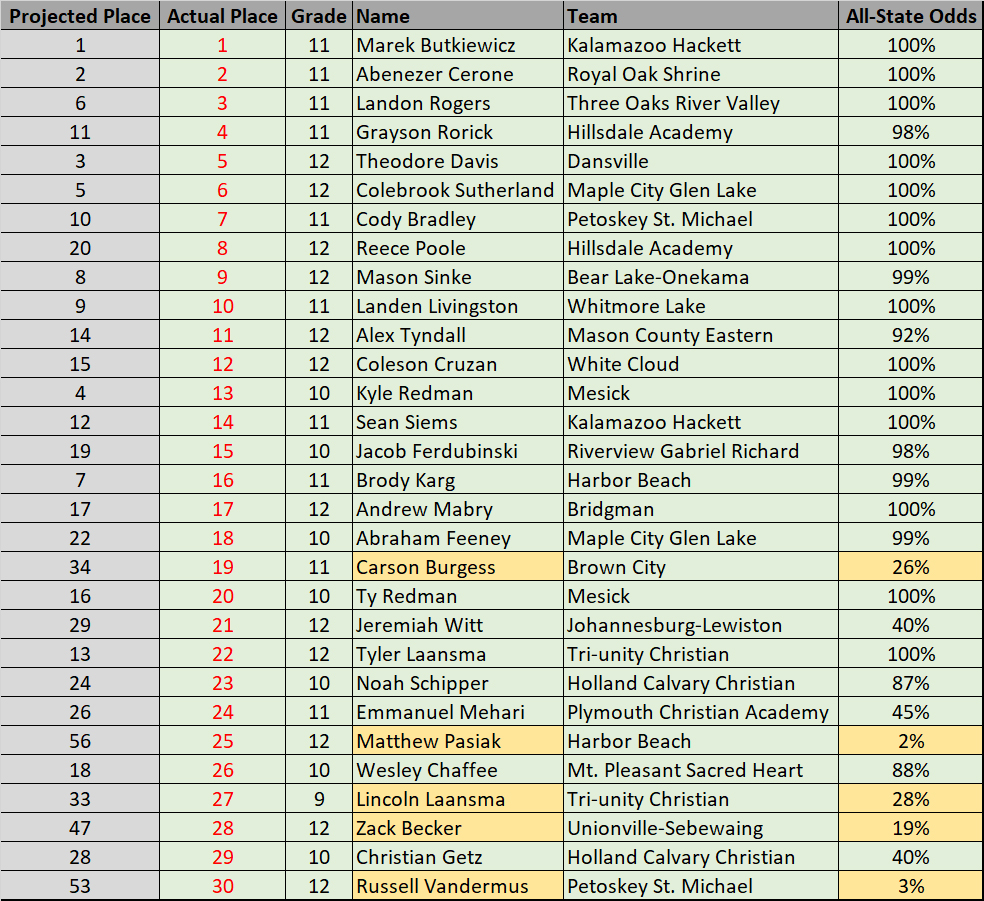
The experience gained from track titles, the endurance gained from ultras, Marek Butkiewicz hit the season blazing and hasn’t let up. Butkiewicz took an early loss at Michigan Catholic against D2’s Colin Murray and has been winning ever since. The times have come too – 15:27 at Otsego, 15:24 at Portage, and 15:11 at Gabriel Richard. He’s a solid favorite.
If there is someone to compete with Marek, it’s Abenezer Cerone. Last year’s 3rd place finisher has won quite a bit himself – at Hansons, Brooks, and a 2nd consecutive regional championship. He’s also faced off against stronger competition, placing 7th in the ever-tough Oakland County Championship. His time there was 16:34, 27 sec. faster than 2023 under similar conditions. A definite candidate to run in the mid-15’s on Saturday.
What went down?
Well, the first two spots played out as projected. Marek Butkiewicz opened up a 5 sec. gap at the mile, 15 at two, before cruising to a 15:09. The time was a minor personal best, just barely eking out his Gabriel Richard performance. These State Finals were the culmination of a season that contained 13 straight victories, a campaign that established Butkiewicz as one of the faster juniors in the state. Expect more in 2025, as the endurance king has just mastered the 100k distance, hitting a 2+ hour PR in the Black Canyon 100k.
Solidly in second was Abenezer Cerone. Cerone led a small pack through a mile, opened a bit of a gap through two, then affirmatively nailed a runner-up finish. His 15:40 was his 4th sub-16 of the year and second consecutive top-three placement.
As far as projected All-Staters go, 25 of the 30 were correctly predicted. The five that pulled off minor and major upsets on their way to the podium were:
Matthew Pasiak (2%) – Pasiak showed out as an upperclassman. After two seasons where his races culminated at regionals, these past two have ended with top-50 finishes at State. He ran into the 16’s as a junior, but until State, hadn’t matched that mark as a senior. Hitting 5:11 at the mile had to be a shock, but he didn’t let the moment overcome him, finishing in 25th.
Russell Vandermus (3%) – what a way to go out as a senior. First sub-17 ever, 26 places higher than he’s ever finished at the State Finals. Splitting almost even splits allowed Vandermus to move from 56th at the mile to 32nd at two, and surely conserved enough energy to help onto the 30th spot through the line.
Zack Becker (19%) – has transformed from a kid who, for a majority of his sophomore year, was well above 20-flat. Two short years later, he’d improved to the point where he could run in the 17’s pretty consistently. That is, until MIS, where a 30 second personal best awaited.
Carson Burgess (26%) – he’s been here before, placing 30th a year ago. This time around, he wasn’t just scraping his way onto the podium, he comfortably made it. Projected 34th, finished 19th. Thumb kids had a strong day at November’s Finals.
Lincoln Laansma (28%) – the 9th grade stage ain’t too big for Lincoln. No doubt in assistance was running here as an 8th grader. Fresh off a sub-17 at Region 31, Laansma threw himself into the mix early, then masterfully moved up through the race to finish in 27th.
What did we initially write?
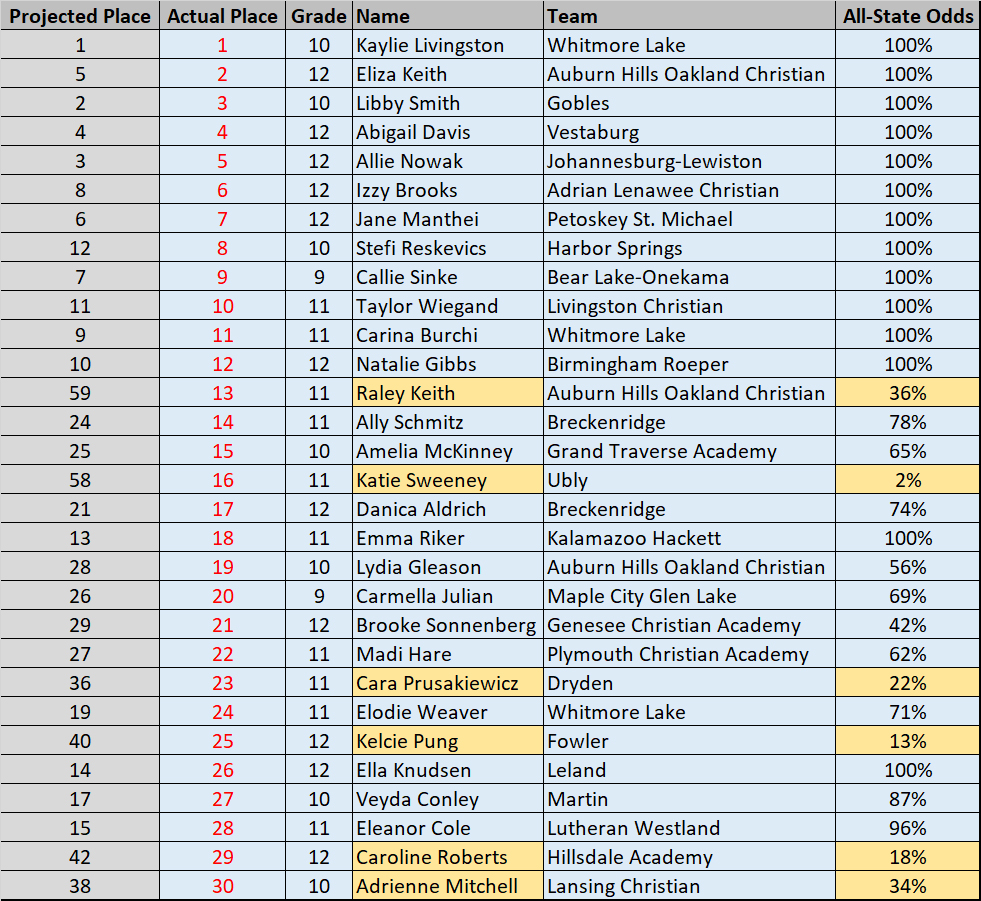
Over the past two years, Kaylie Livingston has displayed a wonderful ability to remain undaunted by the circumstances. Traveling here and there, running non-descript conference meets, heading to the indoor track in the middle of basketball season. Through this, she’s picked up a track title, indoor title, and placed 2nd here last year. She’s been the class of D4 this time, running into the 17’s in five of her past seven meets. She’s likely the favorite.
Allie Nowak and Libby Smith are two others to watch. Nowak is lightly raced, but she’s well used to these championship races, having won one of her own during track. Smith has been consistently rising over the course of the season, hitting the mid-18’s in five of her past six efforts.
What went down?
A year after taking her lumps and learning her lessons, Kaylie Livingston was back to earn her first cross title. Livingston dominated in her usual wire-to-wire fashion, opening up a 10+ second difference in the first mile. That lead extended to nearly 30 sec. at two, enough of a cushion to hold off the girls battling for the second spot.
That runner-up finish was claimed by a girl that was no stranger to the stage, Eliza Keith. Eliza can conquer all distances, her track races ranging from 200m all the way the 3200m. Her cross career had been highlighted by a runner-up finish here in 2022 and supplemented with All-States the other two years. Drawing from her speed on the oval and championship experience, Keith was able to move up two spots from mile two to mile three, then sprint home in the 7th fastest kick in D4.
The pre-race projections nailed all but six of the All-Staters. Those six took various routes to get on the stage, each worthy of their momentous accomplishment. Hitting it against the odds were:
Katie Sweeney (2%) – no stranger to this moment, having placed 25th here in 2023. But her season to this point didn’t predict another All-State finish. Her 19:40 here was a personal best of 10 seconds and a 40+ second season best.
Kelcie Pung (13%) – incredibly patient with her metronomic pacing. Her 19:53 equated to a 6:24 pace and her furthest deviation from that was a 6:31 second mile. The strategy paid off, as Pung moved 24 places from mile one to the finish.
Caroline Roberts (18%) – the Roberts girls have had a history of State Finals triumphs. They also possess a little speed, Caroline flashing hers in the final tenth of a mile, passing two girls to move from 31st to 29th. The fastest kick of the day in D4!
Cara Prusakiewicz (22%) – the ratings were probably a little too unfair to those from the Wagener Park regional. Looking back, her victory there was a sure precursor of State success. Two straight sub-20’s to cap off her junior year.
Adrienne Mitchell (34%) – has shown a tendency to perform her best at season’s end. At the conclusion of her freshman year, Adrienne ran a personal best at State. The same scenario occurred this year, where a 17 sec. PB earned her the final All-State spot.
Raley Keith (36%) – if you had seen her late season movement, probably the least surprising. After being well above 20:00 for her entire career, ripped off three straight 19 min. performances, before unleashing a 19:17 at State. If you’re a college coach reading this far, she may be your diamond in the rough in the class of ’26.
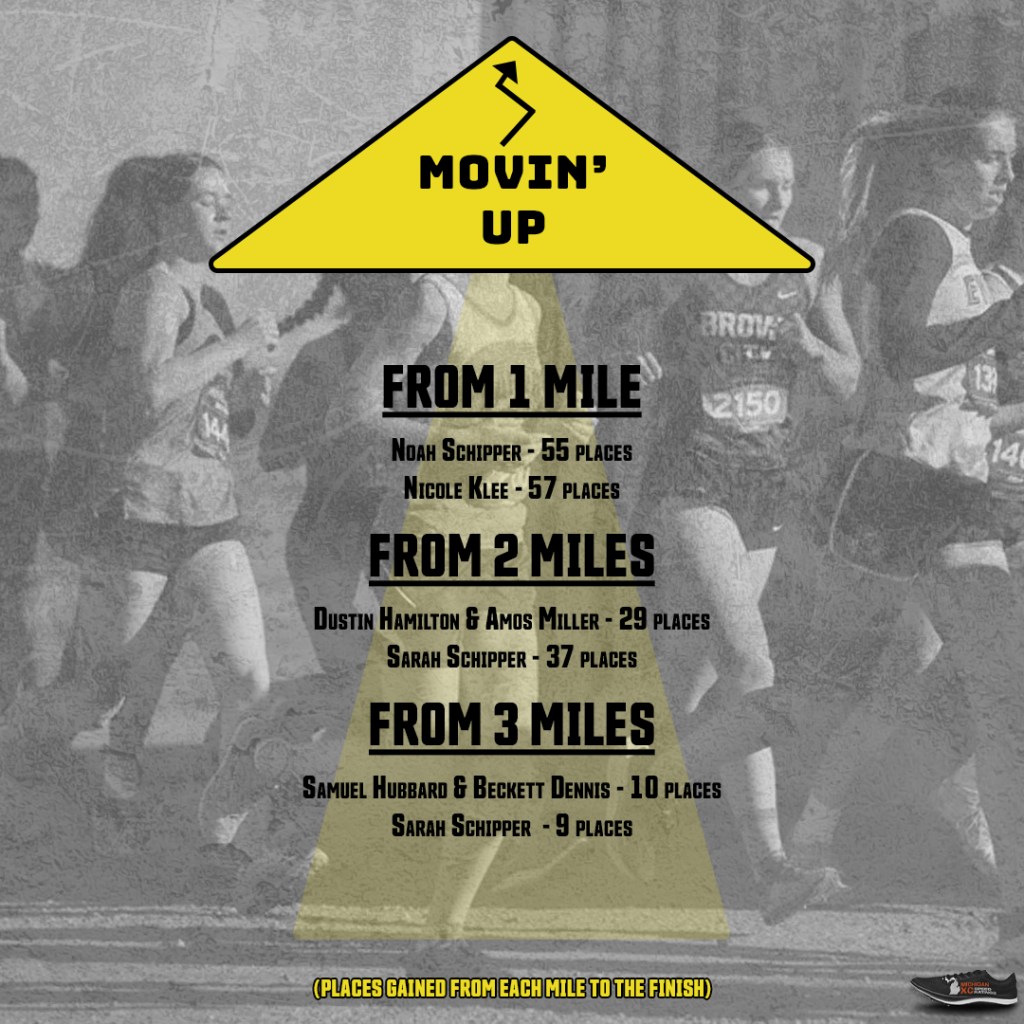
Movin’ Up
Year
Name
Team
1 Mile Place
2 Mile Place
3 Mile Place
Finish
1 Mile Move
10
Noah Schipper
Holland Calvary Christian
78
44
28
23
-55
10
Christian Getz
Holland Calvary Christian
82
48
29
29
-53
10
Uzziel Thomassen
Auburn Hills Oakland Christian
191
151
138
139
-52
9
Barron Denham
Auburn Hills Oakland Christian
167
130
118
122
-45
10
Riley Weed
Holland Calvary Christian
93
67
51
49
-44
10
Brody Vantuinen
Holland Calvary Christian
95
68
54
55
-40
11
Freddie Bierling
Byron Center Zion Christian
149
120
115
110
-39
9
Anderson Karkau
Dansville
156
131
125
118
-38
12
Dustin Hamilton
Concord
188
179
159
150
-38
10
Eric Junker
Whitmore Lake
147
119
110
111
-36
Year
Name
Team
1 Mile Place
2 Mile Place
3 Mile Place
Finish
2 Mile Move
12
Dustin Hamilton
Concord
188
179
159
150
-29
11
Amos Miller
Saginaw Arts and Sciences
168
169
143
140
-29
12
Camden Fager
Saginaw Mich Lutheran Seminary
141
165
137
137
-28
12
Rodney Iamurri
Saginaw Nouvel
157
156
136
133
-23
10
Noah Schipper
Holland Calvary Christian
78
44
28
23
-21
10
Christian Getz
Holland Calvary Christian
82
48
29
29
-19
10
Riley Weed
Holland Calvary Christian
93
67
51
49
-18
11
Josiah Johncox
Byron
107
93
80
77
-16
11
Lucas Malseed
Auburn Hills Oakland Christian
196
180
166
165
-15
12
Samuel Hubbard
Livingston Christian
170
176
171
161
-15
Year
Name
Team
1 Mile Place
2 Mile Place
3 Mile Place
Finish
3 Mile Move
12
Samuel Hubbard
Livingston Christian
170
176
171
161
-10
9
Beckett Dennis
Grand Traverse Academy
80
82
96
86
-10
12
Dustin Hamilton
Concord
188
179
159
150
-9
10
Kyron Christner
Mendon
175
159
153
145
-8
9
Anderson Karkau
Dansville
156
131
125
118
-7
10
Anthony Rowe
Breckenridge
65
79
76
69
-7
12
Karl Wegner
Waterford Our Lady
153
138
142
136
-6
12
Ryan Blankenship
Eau Claire
68
88
99
93
-6
10
Noah Schipper
Holland Calvary Christian
78
44
28
23
-5
12
Luke Baird
Wyoming Tri-unity Christian
193
182
173
168
-5
11
Freddie Bierling
Byron Center Zion Christian
149
120
115
110
-5
11
Charlie Gibson
Three Oaks River Valley
133
171
167
162
-5
12
Avery Bowman
White Cloud
140
128
129
124
-5
11
Paul Herendeen
Concord
159
146
151
146
-5
Grade
Name
Team
1 Mile Place
2 Mile Place
3 Mile Place
Finish
1 Mile Move
10
Nicole Klee
Ubly
180
154
124
123
-57
12
Emma Ramisch
Harbor Beach
188
156
133
136
-52
9
Leah Thelen
Fowler
176
148
129
131
-45
10
Cailin Spearman
Harbor Beach
179
151
136
137
-42
10
Allie Miller
Hillsdale Academy
87
64
43
45
-42
10
Sara Schipper
Martin
166
163
135
126
-40
9
Delaney Mcbride
Kalamazoo Hackett
168
157
131
130
-38
12
Madelyn Sillman
Fowler
177
170
149
142
-35
9
Durae Sage
Martin
167
152
128
135
-32
10
Danielle Agren
Johannesburg-Lewiston
102
87
71
71
-31
Grade
Name
Team
1 Mile Place
2 Mile Place
3 Mile Place
Finish
2 Mile Move
10
Sara Schipper
Martin
166
163
135
126
-37
10
Nicole Klee
Ubly
180
154
124
123
-31
12
Madelyn Sillman
Fowler
177
170
149
142
-28
9
Delaney Mcbride
Kalamazoo Hackett
168
157
131
130
-27
12
Emma Ramisch
Harbor Beach
188
156
133
136
-20
10
Allie Miller
Hillsdale Academy
87
64
43
45
-19
9
Leah Thelen
Fowler
176
148
129
131
-17
9
Durae Sage
Martin
167
152
128
135
-17
10
Addison Patrzik
Grand Traverse Academy
141
194
180
177
-17
10
Danielle Agren
Johannesburg-Lewiston
102
87
71
71
-16
Grade
Name
Team
1 Mile Place
2 Mile Place
3 Mile Place
Finish
3 Mile Move
10
Sara Schipper
Martin
166
163
135
126
-9
12
Madelyn Sillman
Fowler
177
170
149
142
-7
9
Dilyn Colpean
Merrill
148
138
140
133
-7
9
Anna Howell
Bridgman
80
65
63
57
-6
9
Gabriella Wood
Lansing Christian
127
127
138
132
-6
9
Sophia Balistreri
Harbor Springs
100
99
93
88
-5
11
Elizabeth Caspar
Hillsdale Academy
89
69
64
59
-5
9
Madison Markowicz
Novi Christian Academy
55
51
49
44
-5
9
Peyton Rohn
Ashley
151
146
146
141
-5
12
Reece Wruble
Harbor Beach
64
76
81
76
-5
11
Alison Rotman
Holland Calvary Christian
137
142
151
146
-5
10
Julia Clarke
Harbor Springs
116
121
139
134
-5
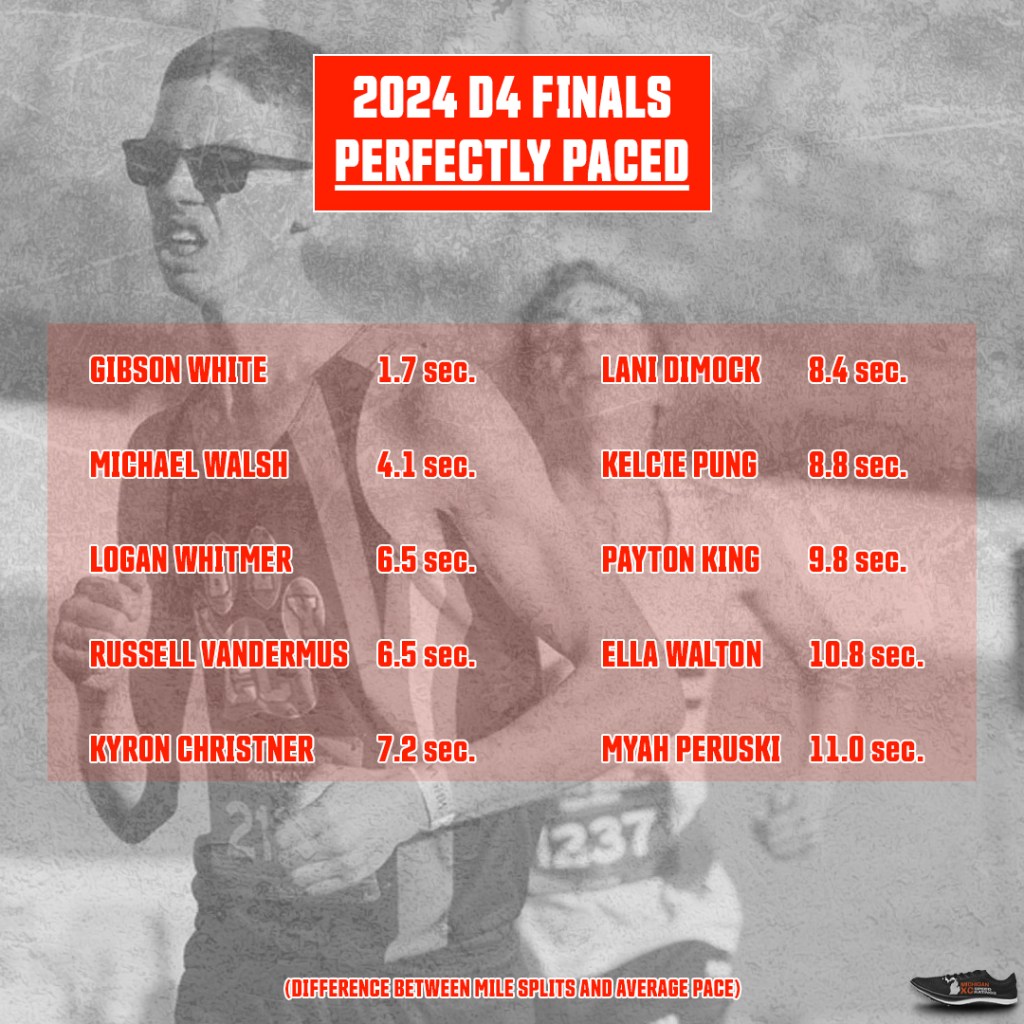
Perfectly Paced
Place
Year
Name
Team
Finish
Pace
1 Mile Split
2 Mile Split
3 Mile Split
1 Mile Diff
2 Mile Diff
3 Mile Diff
Total Diff
48
10
Gibson White
Holland Calvary Christian
17:07.1
5:30.6
5:30.9
5:31.9
5:30.6
0.3
1.3
0.0
1.7
36
11
Michael Walsh
Ubly
16:55.6
5:26.9
5:27.0
5:30.3
5:26.3
0.1
3.4
0.6
4.1
209
10
Logan Whitmer
Saginaw Mich Lutheran Seminary
20:08.6
6:29.0
6:32.0
6:28.6
6:32.1
3.0
0.4
3.1
6.5
30
12
Russell Vandermus
Petoskey St. Michael
16:46.9
5:24.1
5:26.8
5:27.1
5:23.3
2.7
3.0
0.8
6.5
145
10
Kyron Christner
Mendon
18:32.0
5:57.9
5:57.5
6:04.2
5:57.4
0.4
6.3
0.5
7.2
54
11
Cole Brege
Rogers City
17:14.6
5:33.0
5:31.8
5:38.9
5:33.2
1.2
5.9
0.2
7.3
98
12
Alexander Dumont
Kalamazoo Hackett
17:51.9
5:45.0
5:43.4
5:49.7
5:46.3
1.6
4.7
1.3
7.6
96
12
Joel Lange
Adrian Lenawee Christian
17:50.3
5:44.5
5:45.3
5:49.9
5:43.0
0.8
5.4
1.5
7.7
1
11
Marek Butkiewicz
Kalamazoo Hackett
15:09.7
4:52.8
4:50.4
4:57.1
4:51.7
2.4
4.3
1.1
7.8
132
10
Ayden Mayr
Dansville
18:20.5
5:54.2
5:52.5
6:00.1
5:54.0
1.7
5.9
0.2
7.8
197
9
Ryan Latimer
Harbor Springs
19:19.9
6:13.3
6:11.3
6:18.8
6:13.7
2.0
5.5
0.4
7.9
77
11
Josiah Johncox
Byron
17:37.9
5:40.5
5:40.0
5:47.4
5:40.0
0.5
6.9
0.5
7.9
110
11
Freddie Bierling
Byron Center Zion Christian
18:03.3
5:48.7
5:51.2
5:54.0
5:48.9
2.5
5.3
0.2
8.1
34
10
Rush Marsden
Fulton
16:54.3
5:26.5
5:24.7
5:28.8
5:30.9
1.8
2.3
4.4
8.5
142
10
Benjamin Fox
Whitmore Lake
18:29.9
5:57.2
5:55.9
6:02.8
5:55.5
1.3
5.6
1.7
8.6
139
10
Uzziel Thomassen
Auburn Hills Oakland Christian
18:27.6
5:56.5
6:02.9
5:56.2
5:54.5
6.4
0.3
2.0
8.7
60
10
Caleb Adkins
Holland Calvary Christian
17:22.4
5:35.5
5:34.6
5:39.5
5:39.3
0.9
4.0
3.8
8.7
43
11
Ethan West
Webberville
17:03.1
5:29.3
5:27.2
5:34.3
5:31.0
2.1
5.0
1.7
8.8
152
10
Jay Bronsink
Athens
18:33.2
5:58.3
5:57.3
6:04.6
5:56.6
1.0
6.3
1.7
9.0
46
9
Atticus Cadarette
Petoskey St. Michael
17:04.8
5:29.8
5:28.2
5:35.8
5:28.4
1.6
6.0
1.4
9.0
159
10
Kasey Springer
Whitmore Lake
18:40.6
6:00.7
5:56.8
6:04.5
6:02.2
3.9
3.8
1.5
9.2
39
11
Rich Fanti
Riverview Gabriel Richard
16:58.9
5:27.9
5:30.3
5:32.8
5:25.8
2.4
4.9
2.1
9.4
237
10
Jonah Spencer
Webberville
21:21.5
6:52.5
6:49.7
6:59.1
6:52.5
2.8
6.6
0.0
9.4
40
10
Vern Clyne
Auburn Hills Oakland Christian
16:59.3
5:28.1
5:26.1
5:34.2
5:26.5
2.0
6.1
1.6
9.7
157
10
Max Barron
Tekonsha
18:37.2
5:59.6
5:57.0
6:04.6
5:57.5
2.6
5.0
2.1
9.7
Place
Grade
Name
Team
Finish
Pace
1 Mile Split
2 Mile Split
3 Mile Split
1 Mile Diff
2 Mile Diff
3 Mile Diff
Total Diff
155
10
Lani Dimock
Harbor Beach
22:35.8
7:16.4
7:13.5
7:19.6
7:18.7
2.9
3.2
2.3
8.4
25
12
Kelcie Pung
Fowler
19:53.6
6:24.2
6:24.3
6:31.6
6:22.9
0.1
7.4
1.3
8.8
70
9
Payton King
Kingston
21:04.4
6:47.0
6:43.0
6:51.6
6:48.2
4.0
4.6
1.2
9.8
32
12
Ella Walton
Hillsdale Academy
20:09.5
6:29.3
6:27.4
6:37.6
6:29.9
1.9
8.3
0.6
10.8
98
9
Myah Peruski
Ubly
21:36.7
6:57.3
6:54.3
7:04.9
6:57.7
3.0
7.6
0.4
11.0
53
11
Kandin Shuler
Bridgman
20:45.5
6:40.9
6:38.6
6:49.9
6:40.5
2.3
9.0
0.4
11.7
7
12
Jane Manthei
Petoskey St. Michael
19:04.8
6:08.5
6:03.1
6:05.8
6:12.2
5.4
2.7
3.7
11.8
59
11
Elizabeth Caspar
Hillsdale Academy
20:51.9
6:42.9
6:42.0
6:51.7
6:45.5
0.9
8.8
2.6
12.3
116
10
Moira Beier
Hillsdale Academy
22:00.3
7:04.9
7:02.0
7:14.0
7:07.0
2.9
9.1
2.1
14.1
57
9
Anna Howell
Bridgman
20:50.8
6:42.6
6:40.3
6:50.4
6:47.1
2.3
7.8
4.5
14.6
137
10
Cailin Spearman
Harbor Beach
22:19.7
7:11.2
7:13.0
7:20.3
7:07.0
1.8
9.1
4.2
15.1
16
11
Katie Sweeney
Ubly
19:40.6
6:20.0
6:14.8
6:29.3
6:20.9
5.2
9.3
0.9
15.4
178
9
Keri Coolman
Rogers City
23:13.3
7:28.4
7:28.5
7:41.9
7:26.5
0.1
13.5
1.9
15.5
97
12
Autumn Reynolds
Potterville
21:36.4
6:57.3
6:53.9
7:05.7
7:01.1
3.4
8.4
3.8
15.6
14
11
Ally Schmitz
Breckenridge
19:38.3
6:19.2
6:16.5
6:29.0
6:15.7
2.7
9.8
3.5
16.0
17
12
Danica Aldrich
Breckenridge
19:40.8
6:20.0
6:14.9
6:30.1
6:19.2
5.1
10.1
0.8
16.0
104
10
Ella Hendrixson
Three Oaks River Valley
21:45.5
7:00.2
6:56.3
7:12.8
7:00.2
3.9
12.6
0.0
16.5
143
12
Emily King
Martin
22:23.7
7:12.5
7:09.2
7:24.6
7:11.2
3.3
12.1
1.3
16.7
41
10
Evelyn Meyer
Hillsdale Academy
20:30.7
6:36.1
6:29.5
6:43.5
6:38.9
6.6
7.4
2.8
16.8
74
9
Zoe Fabing
Fowler
21:13.5
6:49.9
6:45.0
7:00.6
6:51.2
4.9
10.7
1.3
16.9
131
9
Leah Thelen
Fowler
22:16.2
7:10.1
7:12.2
7:20.5
7:05.5
2.1
10.4
4.6
17.1
105
9
Taylor Geiger
Ubly
21:45.8
7:00.3
6:52.8
7:08.1
7:02.4
7.5
7.8
2.1
17.4
4
12
Abigail Davis
Vestaburg
18:26.4
5:56.1
5:51.7
6:05.6
5:52.4
4.4
9.5
3.7
17.6
125
8
Jane Vonk
Holland Calvary Christian
22:08.4
7:07.6
7:04.9
7:19.5
7:04.3
2.7
11.9
3.3
17.9
68
9
Abbygail Plester
Ubly
21:02.1
6:46.2
6:40.8
6:55.0
6:49.9
5.4
8.8
3.7
17.9
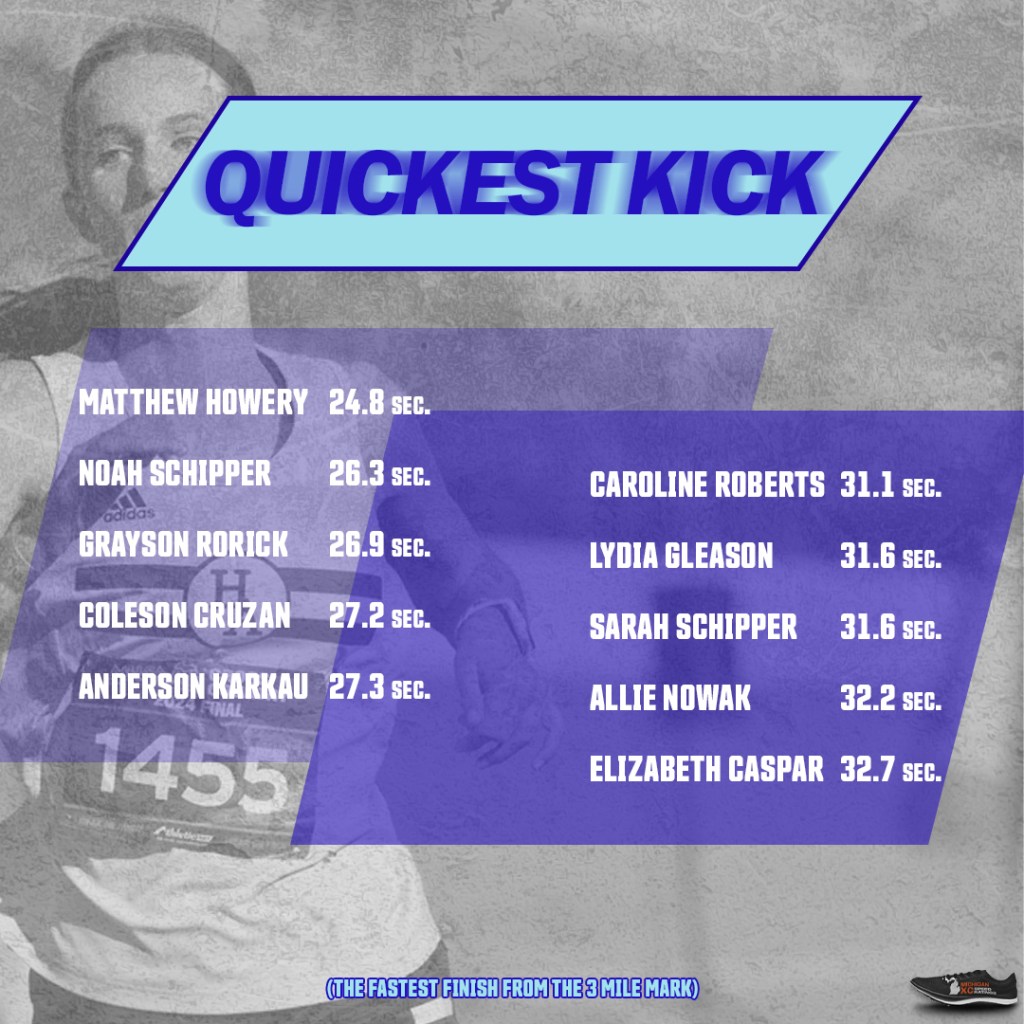
Quickest Kick
Place
Year
Name
Team
Kick
Kicking Pace
3 Mile
Overall Time
3 Mile Place
3 Mile Move
198
11
Matthew Howery
Webberville
24.8
3:51.8
18:55.8
19:20.6
200
-2
23
10
Noah Schipper
Holland Calvary Christian
26.3
4:05.8
16:11.5
16:37.8
28
-5
4
11
Grayson Rorick
Hillsdale Academy
26.9
4:11.4
15:30.2
15:57.1
5
-1
12
12
Coleson Cruzan
White Cloud
27.2
4:14.2
15:53.8
16:21.0
14
-2
118
9
Anderson Karkau
Dansville
27.3
4:15.1
17:44.0
18:11.3
125
-7
69
10
Anthony Rowe
Breckenridge
27.3
4:15.1
17:04.0
17:31.3
76
-7
93
12
Ryan Blankenship
Eau Claire
27.3
4:15.1
17:20.0
17:47.3
99
-6
20
10
Ty Redman
Mesick
27.3
4:15.1
16:09.3
16:36.6
22
-2
32
11
Jonah Pollatz
Mt. Pleasant Sacred Heart
27.7
4:18.9
16:22.8
16:50.5
33
-1
29
10
Christian Getz
Holland Calvary Christian
28.3
4:24.5
16:13.2
16:41.5
29
0
201
10
Lukas App
Harbor Springs
28.4
4:25.4
19:04.4
19:32.8
203
-2
27
9
Lincoln Laansma
Wyoming Tri-unity Christian
28.8
4:29.2
16:11.3
16:40.1
27
0
42
11
Adam Ferguson
Harbor Springs
28.8
4:29.2
16:31.3
17:00.1
42
0
24
11
Emmanuel Mehari
Plymouth Christian Academy
28.8
4:29.2
16:09.4
16:38.2
24
0
108
9
Joseph Edwards
New Buffalo
28.9
4:30.1
17:32.2
18:01.1
112
-4
60
10
Caleb Adkins
Holland Calvary Christian
29.0
4:31.0
16:53.4
17:22.4
63
-3
150
12
Dustin Hamilton
Concord
29.0
4:31.0
18:03.9
18:32.9
159
-9
49
10
Riley Weed
Holland Calvary Christian
29.1
4:32.0
16:40.0
17:09.1
51
-2
136
12
Karl Wegner
Waterford Our Lady
29.1
4:32.0
17:55.5
18:24.6
142
-6
86
9
Beckett Dennis
Grand Traverse Academy
29.1
4:32.0
17:17.0
17:46.1
96
-10
26
10
Wesley Chaffee
Mt. Pleasant Sacred Heart
29.1
4:32.0
16:10.5
16:39.6
26
0
25
12
Matthew Pasiak
Harbor Beach
29.1
4:32.0
16:09.4
16:38.5
23
2
14
11
Sean Siems
Kalamazoo Hackett
29.2
4:32.9
15:58.6
16:27.8
16
-2
110
11
Freddie Bierling
Byron Center Zion Christian
29.2
4:32.9
17:34.1
18:03.3
115
-5
9
12
Mason Sinke
Bear Lake-Onekama
29.3
4:33.8
15:48.1
16:17.4
11
-2
Place
Grade
Name
Team
Kick
Kicking Pace
3 Mile
Overall Time
3 Mile Place
3 Mile Move
29
12
Caroline Roberts
Hillsdale Academy
31.1
4:50.7
19:29.1
20:00.2
31
-2
19
10
Lydia Gleason
Auburn Hills Oakland Christian
31.6
4:55.3
19:10.2
19:41.8
20
-1
126
10
Sara Schipper
Martin
31.6
4:55.3
21:40.1
22:11.7
135
-9
5
12
Allie Nowak
Johannesburg-Lewiston
32.2
5:00.9
17:57.1
18:29.3
5
0
59
11
Elizabeth Caspar
Hillsdale Academy
32.7
5:05.6
20:19.2
20:51.9
64
-5
57
9
Anna Howell
Bridgman
33.0
5:08.4
20:17.8
20:50.8
63
-6
2
12
Eliza Keith
Auburn Hills Oakland Christian
33.0
5:08.4
17:47.1
18:20.1
2
0
88
9
Sophia Balistreri
Harbor Springs
33.2
5:10.3
20:52.3
21:25.5
93
-5
54
11
Fran Warren
Harbor Springs
33.2
5:10.3
20:13.1
20:46.3
56
-2
12
12
Natalie Gibbs
Birmingham Roeper
33.8
5:15.9
18:47.4
19:21.2
12
0
3
10
Libby Smith
Gobles
33.8
5:15.9
17:52.6
18:26.4
4
-1
91
10
Louisa Denks
Royal Oak Shrine
33.9
5:16.8
20:53.1
21:27.0
94
-3
20
9
Carmella Julian
Maple City Glen Lake
34.1
5:18.7
19:11.1
19:45.2
21
-1
196
12
Blythe Drotman
Plymouth Christian Academy
34.5
5:22.4
23:21.8
23:56.3
200
-4
38
9
Cassidy Bowers
Chesterfield Austin Catholic
34.5
5:22.4
19:53.4
20:27.9
42
-4
6
12
Izzy Brooks
Adrian Lenawee Christian
34.5
5:22.4
18:19.8
18:54.3
6
0
32
12
Ella Walton
Hillsdale Academy
34.6
5:23.4
19:34.9
20:09.5
32
0
10
11
Taylor Wiegand
Livingston Christian
34.6
5:23.4
18:42.9
19:17.5
10
0
11
11
Carina Burchi
Whitmore Lake
34.6
5:23.4
18:45.7
19:20.3
11
0
25
12
Kelcie Pung
Fowler
34.8
5:25.2
19:18.8
19:53.6
25
0
44
9
Madison Markowicz
Novi Christian Academy
35.1
5:28.0
19:59.7
20:34.8
49
-5
72
12
Rose Losey
Royal Oak Shrine
35.1
5:28.0
20:36.1
21:11.2
76
-4
117
12
Mckenzie Bowman
Harbor Springs
35.2
5:29.0
21:25.4
22:00.6
119
-2
16
11
Katie Sweeney
Ubly
35.6
5:32.7
19:05.0
19:40.6
18
-2
36
10
Avery Langlois
Rogers City
35.6
5:32.7
19:47.7
20:23.3
37
-1
The Actual Ratings
I bet you came here for these! Just as in 2023, the course was pretty ideal early (and all day). +23 for the boys and +24 for the girls.
Much time has passed since the Upper Peninsula Finals (nearly two months!) and the Lower Peninsula Finals (6+ weeks). Many events have occurred:
I took a long nap
MITCA was attended and we were back to our winning ways
Then I slept some more
The entire Lions defense went on the IR
Danny Wolf and Vlad Goldin became a lethal PnR combination
Ryan Day and his Buckeyes folded again
The Pistons *almost* made the NBA Cup playoffs
Bills were paid, a house maintained, work was worked
Okay, much of that is sports-related. What do coaches always preach? Stress + rest = growth. In terms of this site and the social media, stress comes in the form of non-stop work from April-early November. In terms of life, rest comes from a period away where enjoyable sports moments occur.
I’m ready to get back in the game.
Division One
Boys
Hardly a surprise from the top teams. Marquette was their projected, dominant self. The Sentinels placed all seven varsity runners in the top-10, all of those were sub-16:30 as well. This is a team that showed it’s one of Michigan’s best – by my estimation, a top-5 team in the entire state, backed by outstanding results at Griak, Spartan, and Bluejay.
The projections nailed everyone expected to be in the top-10. One surprise, however, was Marquette’s Lucas Ballard. Ballard saved his best material for the end of the year, nearly breaking 16:00 here and at MITCA. A title favorite a few years down the line?
Girls
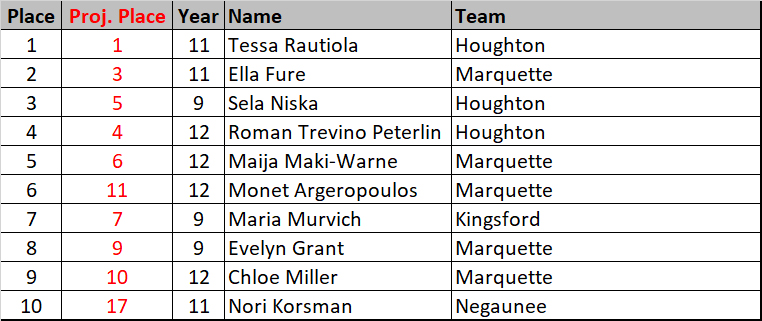
What was thought to be the closest race of the day was just that. A 2-point difference separated Marquette and Houghton. The Sentinels prevailed in the final miles, buoyed by moves from Monet Argeropoulos and Ella Fure. When combined, the two were responsible for the loss of 5 points from the 2-mile mark on, enough substance to earn a victory for the Red n’ White. While the Sentinel boys team has garnered much deserved recognition, don’t sleep on this girls squad that’s won three consecutive UP D1 titles.
Two major moves into the top-10. Monet Argeropoulos has had a history of excellent Finals appearances, her 6th place finish here was her third straight top-10 placing. Nori Korsman has excelled in field events – earning All-State honors in the Pole Vault, Long Jump, and High Jump. Her 20:58 in Munising adds to her Miner legacy.
Division Two
Boys
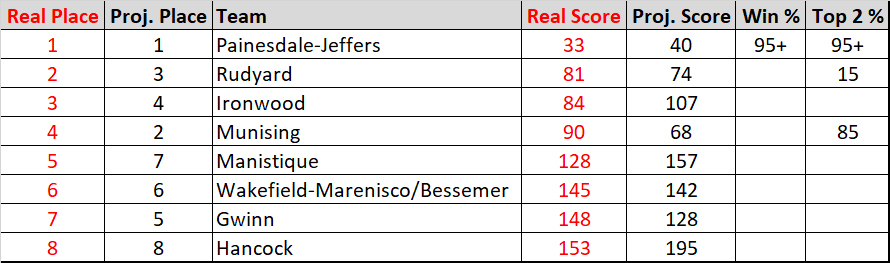
Painesdale-Jeffers was a considerable favorite coming into the race and they mightily backed up those expectations. Just as Marquette, the Jets were loaded up front, with five scorers in the top-11. This is now four consecutive titles for the Jets, second only to Marquette for the longest ongoing title streak.
Unfortunately, Munising was missing a few boys from earlier in the season, which left an opportunity for another team to grab second place. Rudyard was projected third with an outside shot at the top-two. The Bulldogs seized the opportunity, with Camron Willis providing a huge boost, placing 10 spots ahead of his projection.
Two additions to the top-10 that the projections didn’t see coming – Joey Lauzon and Tage Rajala. The projections should’ve looked to the past, where evidence had shown that Lauzon brought his best stuff on State day, October’s race was his fourth consecutive top-10 spot. Added insurance for Painesdale-Jeffers came in the form of Rajala, who unleashed a nearly 30 sec. personal best.
Girls
Four straight for Hancock, the longest streak of any girls team from any division. Things went about as expected up front. For the runner-up position, I had anticipated a little tighter of a matchup. Two Baraga freshmen turned in outstanding performances, with Princess Pierre and Aybri Sorenson nabbing PRs.
Pierre’s PR was pretty dang significant, as she skipped right over the 22’s (23:01 to 21:36). In the season record realm, Dayne Behning put together a solid one as well. Her previous five races had been above 24-flat, then she was able to close the year with a 23:12.
Division Three
Boys
The FIRST STATE TITLE in Engadine Boys XC history. Unfazed by the added pressure, the Eagles were able to win by the exact margin as what was projected. Of course, a freshman such as Nate Stielstra was a major help. Three of his four October races (including this one) were of the sub-19 variety, the improvement needed to push Engadine into the lead position.
Stielstra was the main surprise. I also want to shout out Kalvin Kytta, a recent Michigan Tech commit. After a near-undefeated season in UP action that included a win here, Kalvin sought to drop some serious time. Following his state title, Kalvin ran a 15:46 in a trail race and then slammed down another sub-16 at MITCA. I’d say the Huskies are receiving a recruit who will be a factor in the GLIAC and D2 for years to come.
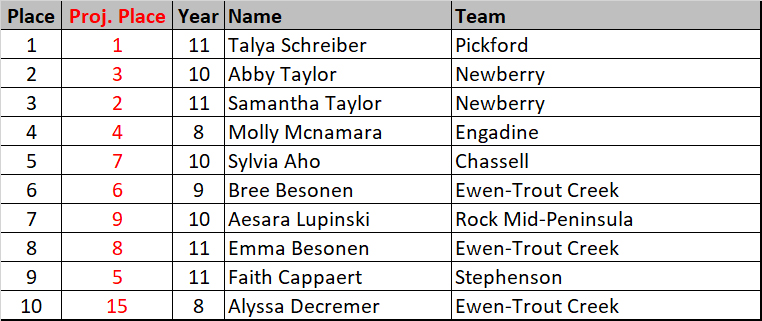
Girls
As I scan the record books, not even a first nor even a second for Ewen-Trout Creek. Until this year, obviously, where the Panthers were able to nearly half the score of the closest competitor. The Panthers packed up, their first four coming in within 40 seconds of one another, and more importantly, hitting the line from 6th to 10th in the team standings.
Dropping into the standings where not expected was the runner-up Engadine. The Eagles showed up with four girls that hadn’t before competed. Three of those girls scored and of their scorers, four weren’t even in high school. Perhaps the girls can join their boys as champions in the future?
The top-10 went about as expected, except for young Alyssa Decremer. What a day to have the best performance of the season! The 8th grader not only contributed to her team’s title, but also ripped a 75+ second personal best.
Perfectly Paced
the added difference from each mile split and one’s overall pace
I wasn’t there, so your guess is as good as mine for why the boys raced to more even splits than the girls. Perhaps the course conditions deteriorated later in the day?
Division
Place
Year
Name
Team
Finish
Pace
1st Mile
2nd Mile
3rd Mile
1 Mile Diff
2 Mile Diff
3 Mile Diff
Total Diff
3
34
10
Jae Poma
Rapid River
19:57.7
6:25.5
6:25.8
6:28.7
6:28.0
0.3
3.2
2.5
6.0
3
30
8
Owen Truitt
Rapid River
19:52.6
6:23.8
6:25.9
6:27.3
6:26.9
2.1
3.5
3.1
8.6
3
19
11
William Hoffman
Forest Park
19:02.5
6:07.7
6:09.8
6:14.2
6:07.6
2.1
6.5
0.1
8.7
3
21
9
Hayden Smith
Forest Park
19:07.9
6:09.5
6:09.9
6:14.1
6:13.1
0.4
4.6
3.6
8.7
3
26
10
Jon Denkins
Rapid River
19:21.5
6:13.8
6:15.8
6:10.0
6:19.1
2.0
3.8
5.3
11.1
1
1
11
Gabe Litzner
Sault Ste. Marie
15:14.4
4:54.3
4:45.7
4:55.3
5:03.3
8.6
1.0
9.0
18.6
1
3
12
James Barch
Marquette
15:57.8
5:08.3
5:01.4
5:15.8
5:14.4
6.9
7.5
6.1
20.5
1
10
12
Birk Seagren
Houghton
16:56.0
5:27.0
5:17.2
5:34.6
5:33.8
9.8
7.6
6.8
24.2
1
5
11
Rorik Holmquist
Marquette
16:07.3
5:11.3
5:00.8
5:16.6
5:21.1
10.5
5.3
9.8
25.6
2
12
9
Kavin Jackson
Manistique
18:44.1
6:01.8
5:52.1
6:12.3
6:08.6
9.7
10.5
6.8
27.0
1
11
11
Benjamin Hemmer
Houghton
17:05.2
5:30.0
5:18.1
5:34.2
5:41.8
11.9
4.2
11.8
27.9
1
6
11
Peter Argeropoulos
Marquette
16:10.2
5:12.3
5:01.0
5:16.7
5:24.7
11.3
4.4
12.4
28.1
1
7
12
Chase Thomsen
Marquette
16:10.3
5:12.3
5:00.8
5:16.9
5:24.7
11.5
4.6
12.4
28.5
1
8
11
Shea Armstrong
Sault Ste. Marie
16:22.9
5:16.4
5:03.8
5:17.9
5:30.9
12.6
1.5
14.5
28.6
2
40
11
Mark Jaunzems
Ironwood
21:36.9
6:57.4
6:45.6
7:07.1
7:04.9
11.8
9.7
7.5
29.0
1
4
10
Lucas Ballard
Marquette
16:07.2
5:11.3
5:01.1
5:17.1
5:24.3
10.2
5.8
13.0
29.0
1
12
12
Eli Hills
Sault Ste. Marie
17:24.3
5:36.1
5:25.5
5:50.7
5:40.7
10.6
14.6
4.6
29.8
2
2
11
Cameron Anderson
Painesdale-Jeffers
16:55.2
5:26.7
5:15.3
5:35.8
5:37.2
11.4
9.1
10.5
31.0
1
2
12
Seppi Camilli
Marquette
15:34.7
5:00.8
4:45.7
5:03.0
5:15.0
15.1
2.2
14.2
31.5
1
14
11
Daniel Bowerman
Sault Ste. Marie
17:37.4
5:40.3
5:27.3
5:50.3
5:50.3
13.0
10.0
10.0
33.0
3
1
12
Kalvin Kytta
Chassell
16:10.2
5:12.3
4:57.5
5:20.3
5:24.5
14.8
8.0
12.2
35.0
3
22
10
Austin Guthrie
Paradise-Whitefish Township
19:14.1
6:11.5
5:55.3
6:19.0
6:24.0
16.2
7.5
12.5
36.2
3
20
12
Max Mainville
Forest Park
19:03.2
6:07.9
5:54.5
6:22.1
6:17.3
13.4
14.2
9.4
37.0
3
18
11
Joey Mainville
Forest Park
19:00.4
6:07.0
5:54.2
6:20.8
6:18.7
12.8
13.8
11.7
38.3
1
9
12
Evan Balko
Marquette
16:28.8
5:18.2
5:00.7
5:27.7
5:30.4
17.5
9.5
12.2
39.2
Division
Place
Year
Name
Team
Finish
Pace
1st Mile
2nd Mile
3rd Mile
1 Mile Diff
2 Mile Diff
3 Mile Diff
Total Diff
2
43
11
Anneli Meyer
Wakefield-Marenisco/Bessemer
30:06.4
9:41.4
9:42.3
10:04.0
9:39.7
0.9
22.6
1.7
25.2
2
39
12
Alexia Slater
Manistique
27:11.2
8:45.0
8:42.0
9:05.3
8:49.0
3.0
20.3
4.0
27.3
1
20
10
Joselyn Mills
Gladstone
22:21.2
7:11.7
7:00.0
7:23.5
7:18.8
11.7
11.8
7.1
30.6
1
52
10
Mckenzie Walters
Powers North Central
25:38.5
8:15.2
8:08.3
8:39.4
8:15.5
6.9
24.2
0.3
31.4
2
6
11
Jill Berg
Hancock
21:56.1
7:03.6
6:52.1
7:10.4
7:17.2
11.5
6.8
13.6
31.9
3
18
8
Julia Poma
Rapid River
23:13.8
7:28.6
7:20.4
7:25.4
7:49.9
8.2
3.2
21.3
32.7
3
51
11
Olivia Blackstone
Dollar Bay
28:17.0
9:06.2
9:00.3
9:21.7
9:18.4
5.9
15.5
12.2
33.6
3
12
11
Teryn Firack
Pickford
22:11.7
7:08.6
6:55.2
7:19.6
7:19.7
13.4
11.0
11.1
35.5
1
6
12
Monet Argeropoulos
Marquette
20:35.1
6:37.5
6:22.7
6:59.2
6:38.0
14.8
21.7
0.5
37.0
2
8
12
Rayna Towles
Hancock
22:09.1
7:07.8
6:52.4
7:14.1
7:24.1
15.4
6.3
16.3
38.0
2
1
12
Aubrey Smith
Ironwood
19:57.0
6:25.3
6:09.7
6:33.2
6:40.1
15.6
7.9
14.8
38.3
3
48
11
Hazel Garvon
Brimley
27:49.7
8:57.4
8:42.7
9:01.5
9:19.5
14.7
4.1
22.1
40.9
1
27
9
Isabeau Woodard
Sault Ste. Marie
23:06.0
7:26.1
7:11.4
7:42.5
7:38.6
14.7
16.4
12.5
43.6
2
2
12
Ella Keranen
Hancock
20:22.9
6:33.6
6:14.4
6:43.3
6:50.6
19.2
9.7
17.0
45.9
1
14
11
Stephanie Jones
Sault Ste. Marie
21:23.8
6:53.2
6:33.1
7:12.4
7:00.4
20.1
19.2
7.2
46.5
1
8
9
Evelyn Grant
Marquette
20:42.2
6:39.8
6:18.0
7:01.8
6:43.4
21.8
22.0
3.6
47.4
1
1
11
Tessa Rautiola
Houghton
19:31.3
6:17.0
5:55.4
6:31.2
6:29.1
21.6
14.2
12.1
47.9
1
2
11
Ella Fure
Marquette
19:44.2
6:21.1
6:00.3
6:35.1
6:35.5
20.8
14.0
14.4
49.2
1
3
9
Sela Niska
Houghton
19:51.8
6:23.6
6:00.2
6:34.5
6:39.1
23.4
10.9
15.5
49.8
3
29
12
Emma Sundling
Rapid River
24:40.1
7:56.4
7:35.8
8:04.8
8:17.7
20.6
8.4
21.3
50.3
3
1
11
Talya Schreiber
Pickford
18:48.8
6:03.3
5:39.7
6:13.0
6:20.6
23.6
9.7
17.3
50.6
1
35
11
Lexi Gilbert
Gladstone
23:48.4
7:39.7
7:17.5
7:54.2
7:54.2
22.2
14.5
14.5
51.2
1
16
9
Isabelle Mccord
Sault Ste. Marie
21:29.8
6:55.1
6:33.2
7:12.7
7:06.9
21.9
17.6
11.8
51.3
3
2
10
Abby Taylor
Newberry
19:49.1
6:22.7
5:58.7
6:35.1
6:39.6
24.0
12.4
16.9
53.3
3
4
8
Molly Mcnamara
Engadine
20:14.4
6:30.9
6:06.9
6:40.0
6:52.0
24.0
9.1
21.1
54.2
Movin’ Up
Division
Place
Year
Name
Team
1 Mile Place
2 Mile Place
3 Mile Place
Finish
1 Mile Move
3
30
8
Owen Truitt
Rapid River
57
38
29
30
-27
3
19
11
William Hoffman
Forest Park
43
27
18
19
-24
3
26
10
Jon Denkins
Rapid River
50
29
25
26
-24
3
21
9
Hayden Smith
Forest Park
44
26
21
21
-23
3
34
10
Jae Poma
Rapid River
56
41
33
34
-22
3
45
12
Jaiven Kohler
Paradise-Whitefish Township
62
60
45
45
-17
3
22
10
Austin Guthrie
Paradise-Whitefish Township
34
21
22
22
-12
3
18
11
Joey Mainville
Forest Park
30
22
19
18
-12
3
49
10
Dane Torrey
Dollar Bay
61
53
47
49
-12
3
20
12
Max Mainville
Forest Park
31
23
20
20
-11
Division
Place
Year
Name
Team
1 Mile Place
2 Mile Place
3 Mile Place
Finish
2 Mile Move
3
45
12
Jaiven Kohler
Paradise-Whitefish Township
62
60
45
45
-15
3
30
8
Owen Truitt
Rapid River
57
38
29
30
-8
3
19
11
William Hoffman
Forest Park
43
27
18
19
-8
1
34
11
William Neimi
Ishpeming Westwood
44
42
34
34
-8
3
34
10
Jae Poma
Rapid River
56
41
33
34
-7
2
19
11
Logan Holm
Ironwood
26
25
19
19
-6
3
21
9
Hayden Smith
Forest Park
44
26
21
21
-5
1
31
9
Ian Southwell
Sault Ste. Marie
39
36
33
31
-5
3
18
11
Joey Mainville
Forest Park
30
22
19
18
-4
3
49
10
Dane Torrey
Dollar Bay
61
53
47
49
-4
1
12
12
Eli Hills
Sault Ste. Marie
20
16
12
12
-4
1
33
12
Reed Degroot
Kingsford
41
37
32
33
-4
1
14
11
Daniel Bowerman
Sault Ste. Marie
21
18
14
14
-4
2
41
12
Jayden Nuttall
Hancock
48
45
42
41
-4
2
27
11
Louis Carlson
Hancock
34
31
28
27
-4
3
65
10
Zach Majetich
Rock Mid-Peninsula
72
69
65
65
-4
1
56
9
Trevor Berg
Calumet
61
60
56
56
-4
3
12
10
Darren Johnson
Brimley
17
16
12
12
-4
3
51
8
Dawson Datto
Dollar Bay
54
55
51
51
-4
3
29
9
Julian Suriano
Newberry
23
33
34
29
-4
3
54
9
Gavin Stebelton
Eben Jct. Superior Central
46
58
53
54
-4
Division
Place
Year
Name
Team
1 Mile Place
2 Mile Place
3 Mile Place
Finish
3 Mile Move
3
29
9
Julian Suriano
Newberry
23
33
34
29
-5
1
4
10
Lucas Ballard
Marquette
7
7
7
4
-3
1
35
11
Colin Van Karsen
Houghton
27
34
38
35
-3
1
31
9
Ian Southwell
Sault Ste. Marie
39
36
33
31
-2
3
46
11
Carter Korpi
Eben Jct. Superior Central
29
44
48
46
-2
3
56
8
Briceson Roberts
Rock Mid-Peninsula
58
51
58
56
-2
the 10 best moves from the 1st and 2nd miles, then anyone that kicked past more than one competitor at the end
Division
Place
Name
Year
Team
1 Mile Place
2 Mile Place
3 Mile Place
Finish
1 Mile Move
1
52
Mckenzie Walters
10
Powers North Central
65
60
54
52
-13
3
18
Julia Poma
8
Rapid River
31
18
18
18
-13
3
50
Aubrey Olson
11
Rapid River
63
51
50
50
-13
3
48
Hazel Garvon
11
Brimley
59
50
48
48
-11
3
51
Olivia Blackstone
11
Dollar Bay
61
54
53
51
-10
1
27
Isabeau Woodard
9
Sault Ste. Marie
37
29
28
27
-10
3
29
Emma Sundling
12
Rapid River
39
30
29
29
-10
3
34
Ivana Kopkova
12
Newberry
44
34
36
34
-10
1
20
Joselyn Mills
10
Gladstone
29
23
19
20
-9
2
21
Aubrey Miller
9
Wakefield-Marenisco/Bessemer
30
26
21
21
-9
Division
Place
Name
Year
Team
1 Mile Place
2 Mile Place
3 Mile Place
Finish
2 Mile Move
1
52
Mckenzie Walters
10
Powers North Central
65
60
54
52
-8
2
21
Aubrey Miller
9
Wakefield-Marenisco/Bessemer
30
26
21
21
-5
3
20
Lillian Carrick
10
Brimley
28
25
20
20
-5
3
56
Kalila Denotto
9
Dollar Bay
62
61
56
56
-5
1
44
Olivia Wescott
11
Kingsford
39
49
45
44
-5
3
33
Kiera Mcdonnald
11
Eben Jct. Superior Central
40
37
33
33
-4
2
43
Anneli Meyer
11
Wakefield-Marenisco/Bessemer
49
47
43
43
-4
3
42
Christy Lutch
10
Pickford
23
46
42
42
-4
3
51
Olivia Blackstone
11
Dollar Bay
61
54
53
51
-3
1
20
Joselyn Mills
10
Gladstone
29
23
19
20
-3
2
16
Cheyenne Ritchie
12
West Iron County
24
19
17
16
-3
1
6
Monet Argeropoulos
12
Marquette
13
9
6
6
-3
2
28
Keira Graham
12
Wakefield-Marenisco/Bessemer
35
31
30
28
-3
2
32
Lacey Mattson
10
West Iron County
36
35
32
32
-3
3
63
Sarah Beauchaine
10
Rapid River
66
66
63
63
-3
1
10
Nori Korsman
11
Negaunee
12
13
10
10
-3
2
20
Calista Watchorn
12
Manistique
21
23
20
20
-3
3
57
Isabella Karvinen
9
Eben Jct. Superior Central
55
60
58
57
-3
Division
Place
Name
Year
Team
1 Mile Place
2 Mile Place
3 Mile Place
Finish
3 Mile Move
1
52
Mckenzie Walters
10
Powers North Central
65
60
54
52
-2
3
51
Olivia Blackstone
11
Dollar Bay
61
54
53
51
-2
2
28
Keira Graham
12
Wakefield-Marenisco/Bessemer
35
31
30
28
-2
1
33
Payton Takkunen
11
Gladstone
38
35
35
33
-2
3
10
Alyssa Decremer
8
Ewen-Trout Creek
12
11
12
10
-2
1
54
Ivy Van Ooyen
11
Kingsford
49
55
56
54
-2
3
34
Ivana Kopkova
12
Newberry
44
34
36
34
-2
3
9
Faith Cappaert
11
Stephenson
5
9
11
9
-2
the 10 best moves from the 1st and 2nd miles, then anyone that kicked past more than one competitor at the end
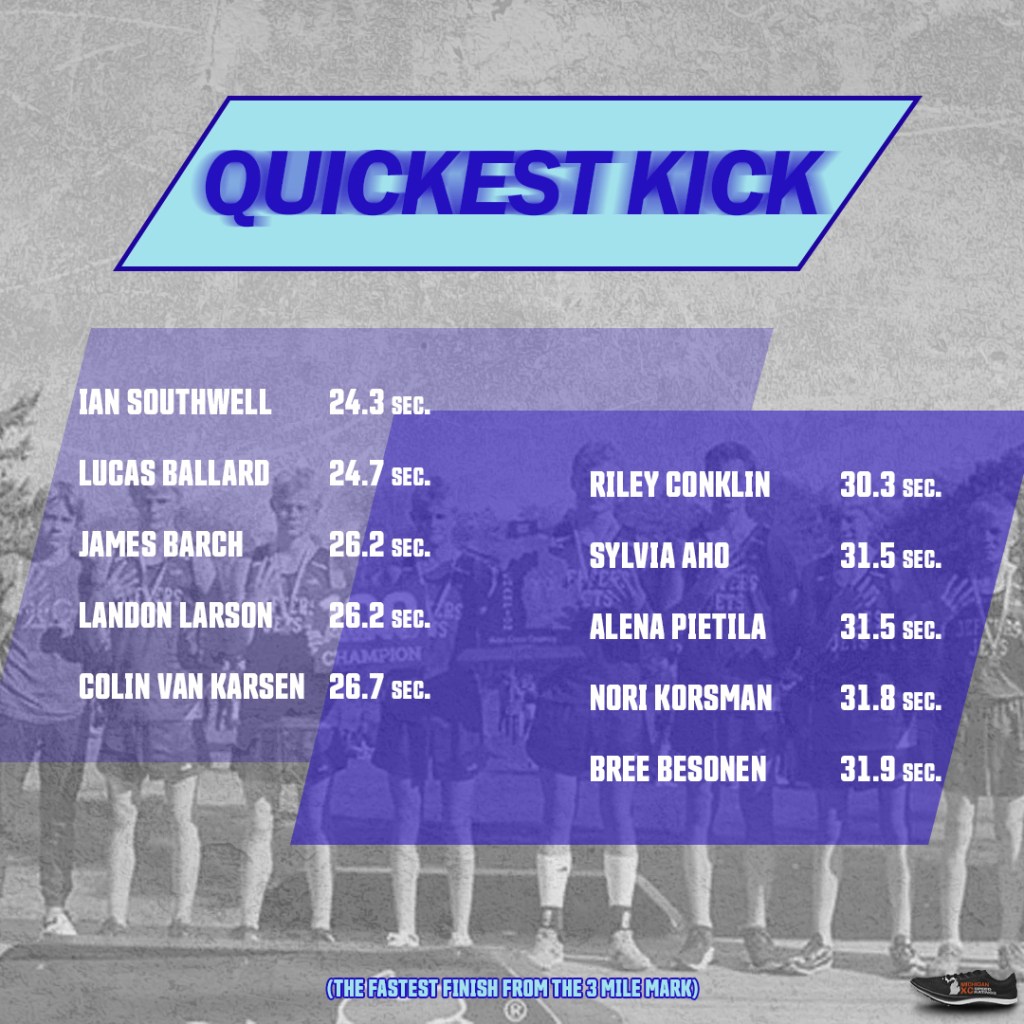
Quickest Kick
Division
Place
Year
Name
Team
Kick
Kicking Pace
3 Mile
Overall Time
3 Mile Place
Finish
3 Mile Move
1
31
9
Ian Southwell
Sault Ste. Marie
24.3
3:47.4
18:40.0
19:04.3
33
31
-2
1
4
10
Lucas Ballard
Marquette
24.7
3:51.1
15:42.5
16:07.2
7
4
-3
1
3
12
James Barch
Marquette
26.2
4:05.1
15:31.6
15:57.8
3
3
0
2
5
11
Landon Larson
Painesdale-Jeffers
26.2
4:05.1
17:04.7
17:30.9
5
5
0
1
35
11
Colin Van Karsen
Houghton
26.7
4:09.8
18:49.3
19:16.0
38
35
-3
3
18
11
Joey Mainville
Forest Park
26.7
4:09.8
18:33.7
19:00.4
19
18
-1
2
4
12
Zach Smith
Ironwood
26.8
4:10.8
16:59.3
17:26.1
4
4
0
2
2
11
Cameron Anderson
Painesdale-Jeffers
26.9
4:11.7
16:28.3
16:55.2
2
2
0
1
33
12
Reed Degroot
Kingsford
27.1
4:13.6
18:37.2
19:04.3
32
33
1
1
12
12
Eli Hills
Sault Ste. Marie
27.4
4:16.4
16:56.9
17:24.3
12
12
0
1
17
11
Austin Corey
Gladstone
27.4
4:16.4
17:15.5
17:42.9
18
17
-1
2
3
11
Steven Kirschner
Rudyard
27.4
4:16.4
16:56.0
17:23.4
3
3
0
3
3
9
Brody Majurin
Ewen-Trout Creek
27.6
4:18.2
17:00.4
17:28.0
4
3
-1
1
41
12
Carter Campioni
Houghton
27.8
4:20.1
19:04.8
19:32.6
42
41
-1
1
6
11
Peter Argeropoulos
Marquette
27.8
4:20.1
15:42.4
16:10.2
5
6
1
1
7
12
Chase Thomsen
Marquette
27.9
4:21.0
15:42.4
16:10.3
6
7
1
3
10
12
Trevor Verba
Stephenson
27.9
4:21.0
18:12.8
18:40.7
11
10
-1
3
1
12
Kalvin Kytta
Chassell
27.9
4:21.0
15:42.3
16:10.2
1
1
0
2
23
10
Izaiah Adams
Wakefield-Marenisco/Bessemer
28.1
4:22.9
19:23.7
19:51.8
23
23
0
3
29
9
Julian Suriano
Newberry
28.1
4:22.9
19:23.6
19:51.7
34
29
-5
3
16
11
Cody Moore
Eben Jct. Superior Central
28.1
4:22.9
18:24.6
18:52.7
16
16
0
2
17
10
Nolan Dolaskie
Munising
28.2
4:23.9
18:53.6
19:21.8
17
17
0
2
20
12
Hunter Lacourt
Hancock
28.3
4:24.8
19:04.2
19:32.5
20
20
0
1
32
11
Tyler Soderman
Gladstone
28.4
4:25.7
18:35.9
19:04.3
31
32
1
Division
Place
Year
Name
Team
Kick
Kicking Pace
3 Mile
Overall Time
3 Mile Place
Finish
3 Mile Move
1
17
10
Riley Conklin
Negaunee
30.3
4:43.5
21:21.0
21:51.3
18
17
-1
3
5
10
Sylvia Aho
Chassell
31.5
4:54.7
20:55.3
21:26.8
5
5
0
2
4
9
Alena Pietila
Hancock
31.5
4:54.7
21:02.1
21:33.6
4
4
0
1
10
11
Nori Korsman
Negaunee
31.8
4:57.5
20:26.5
20:58.3
10
10
0
3
6
9
Bree Besonen
Ewen-Trout Creek
31.9
4:58.5
20:57.0
21:28.9
6
6
0
1
5
12
Maija Maki-Warne
Marquette
32.1
5:00.3
19:57.0
20:29.1
5
5
0
3
10
8
Alyssa Decremer
Ewen-Trout Creek
32.3
5:02.2
21:36.5
22:08.8
12
10
-2
3
9
11
Faith Cappaert
Stephenson
32.7
5:06.0
21:35.9
22:08.6
11
9
-2
2
28
12
Keira Graham
Wakefield-Marenisco/Bessemer
32.9
5:07.8
24:44.5
25:17.4
30
28
-2
1
25
11
Romi Mattson
Houghton
33.0
5:08.8
22:10.6
22:43.6
25
25
0
1
15
10
Eryn Veverka
Marquette
33.0
5:08.8
20:51.2
21:24.2
15
15
0
1
2
11
Ella Fure
Marquette
33.3
5:11.6
19:10.9
19:44.2
2
2
0
1
27
9
Isabeau Woodard
Sault Ste. Marie
33.5
5:13.4
22:32.5
23:06.0
28
27
-1
3
33
11
Kiera Mcdonnald
Eben Jct. Superior Central
33.6
5:14.4
24:38.2
25:11.8
33
33
0
1
11
12
Lily Ross
Houghton
33.9
5:17.2
20:35.2
21:09.1
11
11
0
2
1
12
Aubrey Smith
Ironwood
34.0
5:18.1
19:23.0
19:57.0
1
1
0
1
24
12
Violet Papin
Marquette
34.1
5:19.1
22:06.6
22:40.7
24
24
0
1
33
11
Payton Takkunen
Gladstone
34.2
5:20.0
23:09.6
23:43.8
35
33
-2
2
7
10
Sophie Desrochers
Baraga
34.3
5:20.9
21:34.4
22:08.7
8
7
-1
1
9
12
Chloe Miller
Marquette
34.5
5:22.8
20:10.4
20:44.9
9
9
0
2
2
12
Ella Keranen
Hancock
34.6
5:23.7
19:48.3
20:22.9
2
2
0
1
7
9
Maria Murvich
Kingsford
34.7
5:24.7
20:04.3
20:39.0
8
7
-1
2
5
9
Princess Pierre
Baraga
34.7
5:24.7
21:02.2
21:36.9
5
5
0
2
39
12
Alexia Slater
Manistique
34.9
5:26.5
26:36.3
27:11.2
39
39
0
1
6
12
Monet Argeropoulos
Marquette
35.2
5:29.4
19:59.9
20:35.1
6
6
0
The Actual Ratings
The Boys Adjustment was +30, the Girls Adjustment +31. In many cases, this would mean a course that runs fast or could be short of 5000m (I don’t really care if that’s the case as long as it’s not egregious). For the Upper Peninsula, I’d guess this large adjustment is more about the magnitude of the meet and many of these kids running in a major competition for the first time.