Just one region here, but this simple-minded guy is going in alphabetical order.
Girls Adjustment: +26 Boys Adjustment: +25
MIXCSR VS. REALITY
Five of six qualifying squads, bringing the overall total to 17/18. You may ask, who was the lone exception?
Well, a Lake Orion team that greatly benefitted from the return of Blake Peardon. If you followed the summer preview, you may recall he was the first listed kid in the 50 Tickets. Before Friday, I had been wondering what had happened to Blake. 16:22 opener, mid-17’s throughout the middle of September, then nothing. Surely he was out for the season. Mere mortals may have been, Blake was not. There are usually many factors when a team unexpectedly qualifies. There were definitely some others, but Peardon was the main driver. Without him, the Dragons finish 5th, well out of contention. With a sub-16 PR and 6th place, they move on.
Olivia Jenney, Bloomfield Hills – came in here projected as 18th place, the final individual out. Left with a 10th place finish and an opportunity to run at MIS yet again. Clintonwood is a quick course, but she’s run here each of the past two years, making it an apt comparison. The 18:54 from yesterday was a major step up from her 19:50 as a freshman.
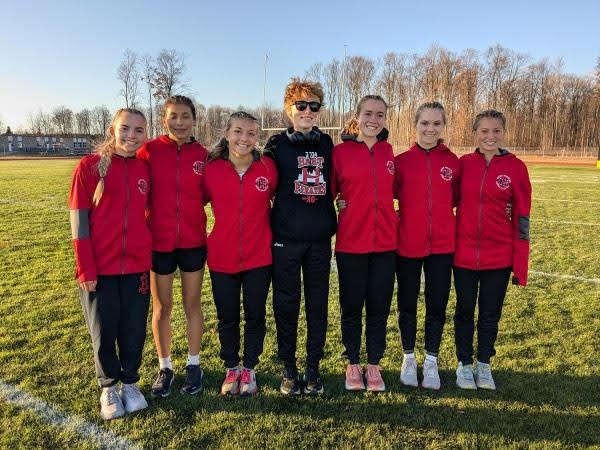
8 straight boys team qualifiers for the PiratesMcBain’s first MIS trip as a team since 202012 years in a row these Hart girls have qualified together
Girls Adjustment: +41 Boys Adjustment: +36
MIXCSR VS. REALITY
I was a solid 12/12 on teams. Off to a great start in my quest for this to be the best year ever. I think my record is 192/216 of the top-three squads.
Normally I’d give mention to a team that surprised, but this is all individuals:
Kyan Deam, Big Rapids – who had never been in the 16’s once before yesterday. Not even 16:59, 16:58, or a 17:00. Coming into this region, his previous best time was a 17:12, achieved last week in the CSAA Finals. Time-wise, this was out of left field, but looking back at Kyan’s career, he had been inching toward this. 32nd here as a sophomore, 20th in 2023, finally a 14th place that earns a trip down south to MIS.
Gus Rohde, Reed City – this section is typically dedicated to those less heralded, but when you’re completing courses in under 900 seconds, you’re gonna get a shoutout. In the athletic.net era, there have are now five boys that have shattered 15-flat on the Benzie track. Hunter Jones, Riley Hough, Nathan Walker, Connor Mora, and now Gus.
Lillian Binger, Gladwin – with a wondrous finishing stretch. Back last year, she was unable to break through the 21’s, and before October of this year, hasn’t gone under 20:00. A 19:50 at the 2nd JPC Jamboree had to be a welcome confidence boost that only spurred a closing stretch of a top-10 JPC finish and an 11th place qualifier here.
Faith Helsel, Lake City – listen, I know this Benzie course is fast. But it’s not fast to the point where a freshman can straight up skip over the 20’s. You’ve gotta put in a superhuman regional effort for that to occur. Which is what Faith did, outperforming her projection by 10 spots, dropping her personal best from 21-flat to 19:55, earning a trip to experience the big stage in a week.
Finally, the start of the season we’ve all been waiting for. Throw out all the fast times from September, but apply all the lessons learned through the summer and fall. Regional week is here and with it comes the many projections and previews I’ll write.
Just as last year and throughout the season, I’m projecting these using race simulations. Through a season’s worth of speed ratings, one can determine a runner’s average rating and the variability of those ratings. Both those factors are then weighed towards more recent meets, which are then simulated thousands of times using a Monte Carlo analysis (also described by TullyRunners here). Over those thousands of race simulations, one can determine a team’s average place and average score, a runner’s average place, odds on winning, and odds on qualifying.
These are useful in cross country scenarios, where you have consistent runners and those who are a bit more up and down. For example:
Tanner Time
Tanner Rating
Tanner Avg.
Tanner StDev.
15:30
210
15:45
205
16:00
200
16:15
195
16:30
190
200
7.91
MIXCSR Time
MIXCSR Rating
MIXCSR Avg.
MIXCSR StDev.
16:09
197
16:12
196
16:15
195
16:18
194
16:21
193
195
1.58
Jacob at his best might be faster than I in four of the five races during the season. I’d almost never be All-State in Division 1, but he might contend for a top-5 spot or place 60th.
If we did 20 simulations, this is how it might turn out:
Race
Tanner Avg.
Tanner StDev
Tanner Rating
MIXCSR Avg.
MIXCSR StDev
MIXCSR Rating
1
200
7.9
202.1
195
1.6
195.6
2
200
7.9
196.2
195
1.6
194.1
3
200
7.9
190.0
195
1.6
199.2
4
200
7.9
193.4
195
1.6
192.5
5
200
7.9
206.8
195
1.6
195.7
6
200
7.9
201.8
195
1.6
196.1
7
200
7.9
171.6
195
1.6
194.9
8
200
7.9
189.2
195
1.6
195.9
9
200
7.9
205.5
195
1.6
197.0
10
200
7.9
203.8
195
1.6
192.6
11
200
7.9
192.3
195
1.6
196.5
12
200
7.9
196.9
195
1.6
196.4
13
200
7.9
198.5
195
1.6
195.6
14
200
7.9
203.2
195
1.6
194.1
15
200
7.9
193.9
195
1.6
192.6
16
200
7.9
199.3
195
1.6
193.2
17
200
7.9
208.7
195
1.6
194.2
18
200
7.9
213.7
195
1.6
194.6
19
200
7.9
212.6
195
1.6
197.1
20
200
7.9
206.3
195
1.6
193.9
I’d win four times, but I’d never have the ability to win a title like he had in Race 18. He’s usually All-State, but may cost his team a title through his effort in Race 7.
The simulations give the possibilities of those scenarios and all the various scoring scripts. A sixth girl that can pop off on any certain day, a reliable boy who always runs 17-flat, you name it. Hopefully, they better elucidate our contenders, qualifiers, and how these races play out over the weekend.
But always remember, races aren’t run on paper or on a computer. These projections are meant to better our sport, give more attention where little is given. Although I take pride in their accuracy, this endeavor would be quite boring if it were always perfect. I look forward to these being proven wrong and I expect to hear about it as well.
Is this the same intro from last year? Heck yeah. Let’s roll through these regionals!
Jenison breaking up what looked to be a locked in region. What the Wildcats did in the OK Green Final was absolutely uncalled for. Nearly a perfect score, five girls under 19:20. If Jenison were to compete in the OK Red Final, held two days later at Riverside under similar conditions, they probably place 2nd. Though one meet doesn’t a season make, especially when Rockford and Grand Haven have been performing at a high level all fall.
Shepherd is the middle ground between Traverse City West and Okemos. One travels from Lansing, the other from Northern Michigan. Despite the differences, these teams have come across each other already. Portage saw TCW finish 11th in the D1 race, Okemos 16th. If Rachel Smith had been able to score for the Wolves, chances are the two outfits would be within a few points, as they are expected to be here.
Which unexpected team comes out of this region? Summer projections had Byron Center at 3, Forest Hills Northern at 4, Ottawa Hills at 6, and Caledonia at 8. By those numbers, the most shocking to this point are the Bengals, who just finished 5th in the OK White, one of the state’s tougher leagues.
Hartland against Dexter. Hartland holds a bit of an advantage up front, having three girls capable of running in the low-19’s or faster. The Dreadnaughts may not be as quick on the top end, though they bring forth six that can throw down mid-20’s or better. Look to the gaps, if Hartland’s best three are a bit ahead of Dexter’s five, that gap may be enough to counteract the depth.
A yearly tradition: Ann Arbor Pioneer and Saline. According to Jacob Tanner’s wonderful tome of regional history, this Region 5 title has been won by either of the two for each of the past ten years. Currently, Pioneer leads those standings from 2014 on, 7-3. With these two teams sitting straight at the top of the area, depth becomes less of an issue and Saline’s advantage is a bit thwarted. In spite of that, the projections still have the Hornets as a slight favorite.
Is Farmington’s late season move enough? The Falcons have benefitted from the return of Catherine Steele and the emergence of Kierra Magner. Farmington traveled down 275 for the Huron Invite in an attempt of a course preview, but they cannot come close to the familiarity that the Salem has with Willow, having raced here on three occasions.
Sal’s Magic vs. their LVC foe and the host squad. Coming in at 14th in Oakland County, Milford was appearing down, out, and out of regional contention. But they’ve put it together in the final few weeks, notching a 2nd place finish at the LVC Championship, six points ahead of Walled Lake Northern. But they’re both chasing Royal Oak, who’ll hope to use their home track and ability to go six deep to their advantage.
The projections themselves appear pretty dang straight forward. Three teams under 100, well separated from the folks in 4th and above, projected at nearly 120 points or higher. But projections are thrown out the window in the case of an Oakland County Championship, where both Oxford and Troy come in ahead of Clarkston. Two Thursdays ago, wrongs were righted in the Wolves’ minds, finishing ahead of those two teams in the OK Red Final. I’m sure they’re looking for more of the same, the opposite being true for the Wildcats and Colts.
Fraser trying to do it again. Spurred by huge efforts from Kate Molloy and Alice Foley, the Ramblers defied the odds at Macomb County. Those odds have now doubled, but they’re still considered solid underdogs to Macomb Dakota. Listed in the entries for Saturday’s race is Aubrey Rizzo, who missed the County meet and could be a definite help for the Cougar cause. And I’m sure they’ve been stewing over on 21 Mile.
The nerve-racking battle for me is Romeo staying under 16 points. Every single simulation had the Bulldog girls with a perfect score.