Surprise Teams

The one team in all of Division 2 to place above the range I had projected, the one squad to greatly exceed expectations, those were the girls of New Boston Huron. Five of the Chiefs placed significantly better than projected:
Zoey Cheney – projected 164th, placed 78th, and ran a personal best, dropping under 20-flat for the second time ever.
Falyn Doss – projected 148th, placed 119th, and nearly matched her season best from regionals.
Ellia Egle – projected 204th, placed 120th, and ended the season over 3 min. faster than in 2024.
Alexis White – projected 217th, placed 129th, and popped a 35+ second personal best.
Kayla Christesen – projected 214th, placed 186th, competing in her first State Finals ever.
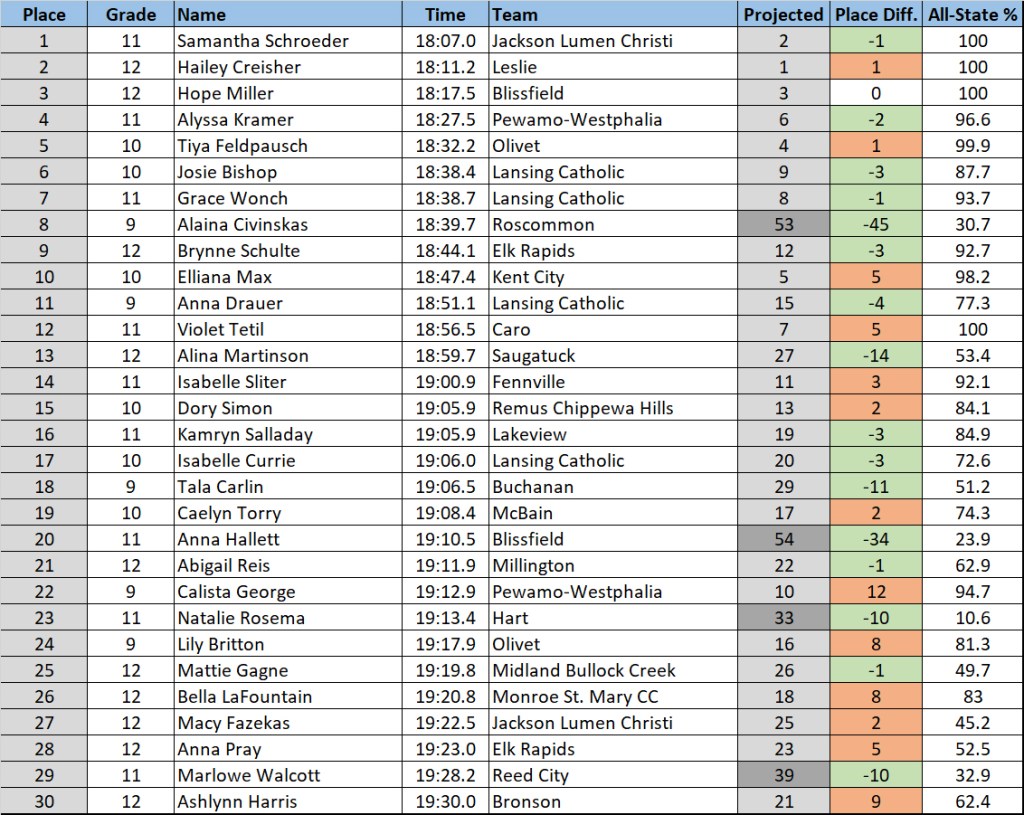
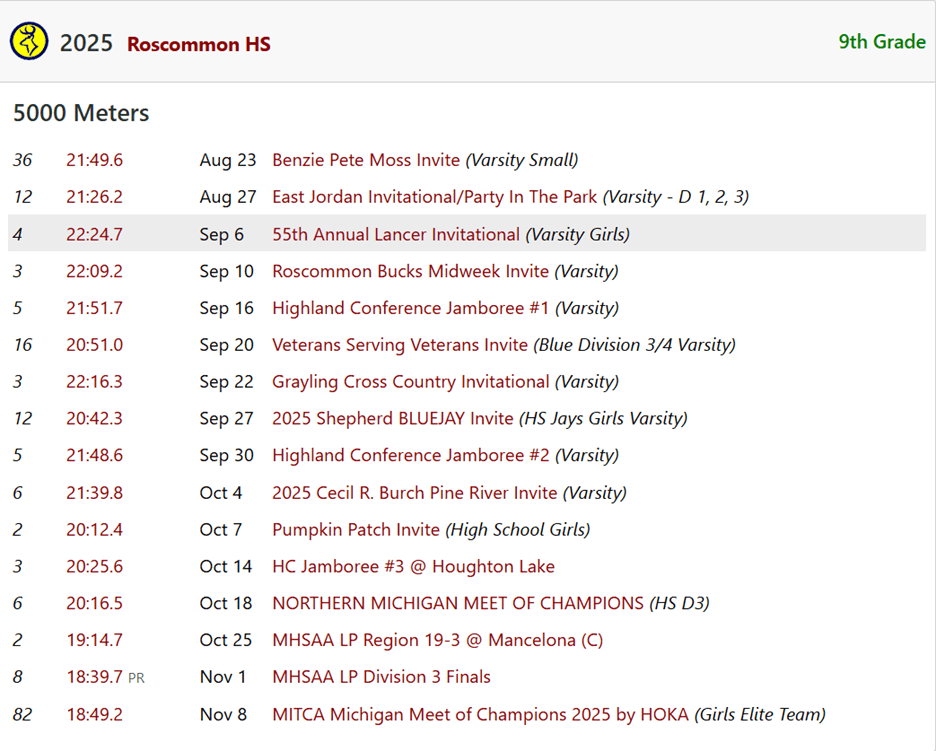
I didn’t have Jennalynn Bronstein in the projections, but it’s worth noting that the freshman slipped under 22:00 in three of her final four races of the year. And of course, I must give mention to Avery Turk, who maybe didn’t have the best race of her season, but has much to be proud of. Avery competed at MIS all four years and was a standout in the Huron League for her entire career.
Unexpected All-Staters
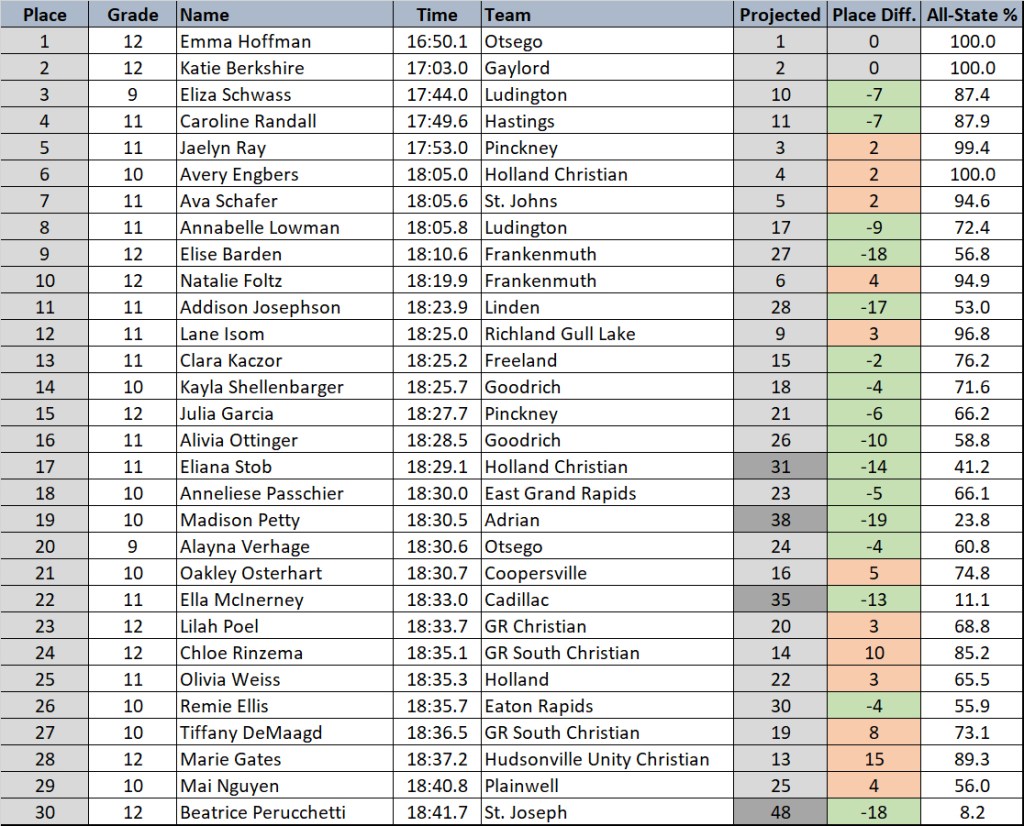
Eliana Stob, Holland Christian – projected 31st with a 41.2% chance, placed 17th
What did it take? An effort that was nearly a minute faster than she ran at MIS as a sophomore. Her 18:29 was a personal best and her 4th sub-19 of the year.
Madison Petty, Adrian – projected 38th with a 23.8% chance, placed 19th
What did it take? A nice lil’ 28 second personal best. Before the State Finals, Petty had slipped under 19:00 twice, both by a second or two. Her MIS performance was much, much lower.
Ella McInerney, Cadillac – projected 35th with a 11.1% chance, placed 22nd
What did it take? Nearly matching her State race from her sophomore year. Over the past two seasons, McInerney has sure shown a penchant for bringing it in early November.
Beatrice Perucchetti, St. Joseph – projected 48th with an 8.2% chance, placed 30th
What did it take? Dropping two minutes from her 2023 MIS race and a minute from her 2024 version. Perucchetti’s 18:41 was her second sub-19 ever and nearly a 20 sec. PR.
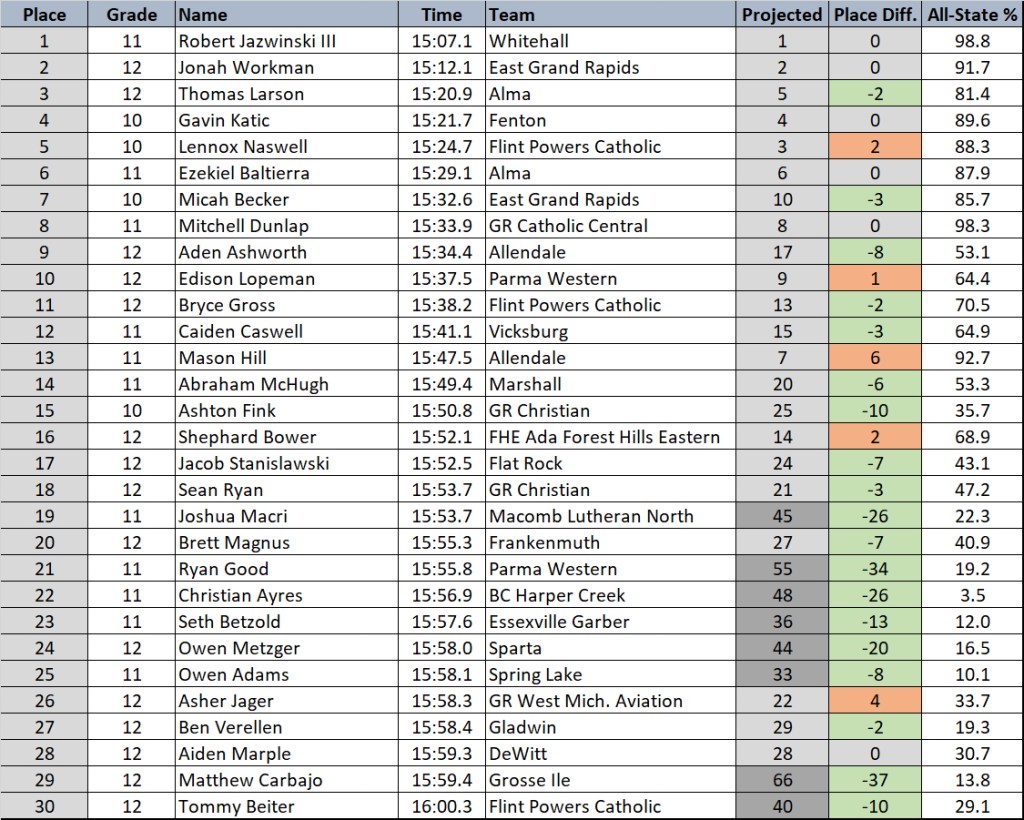
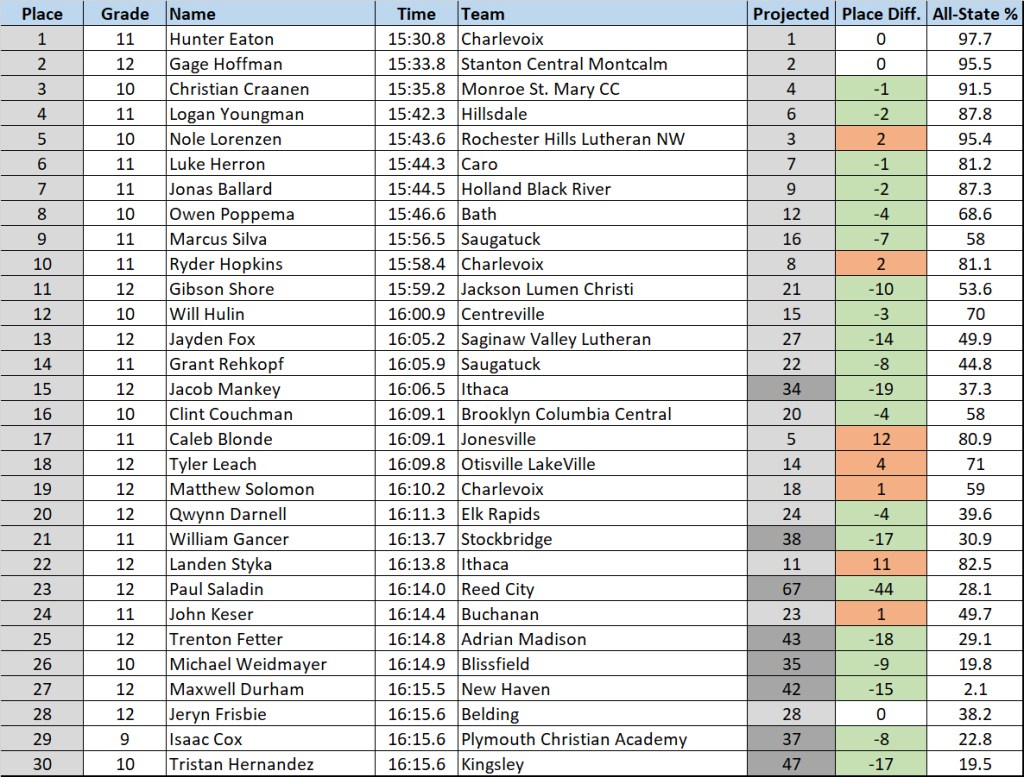
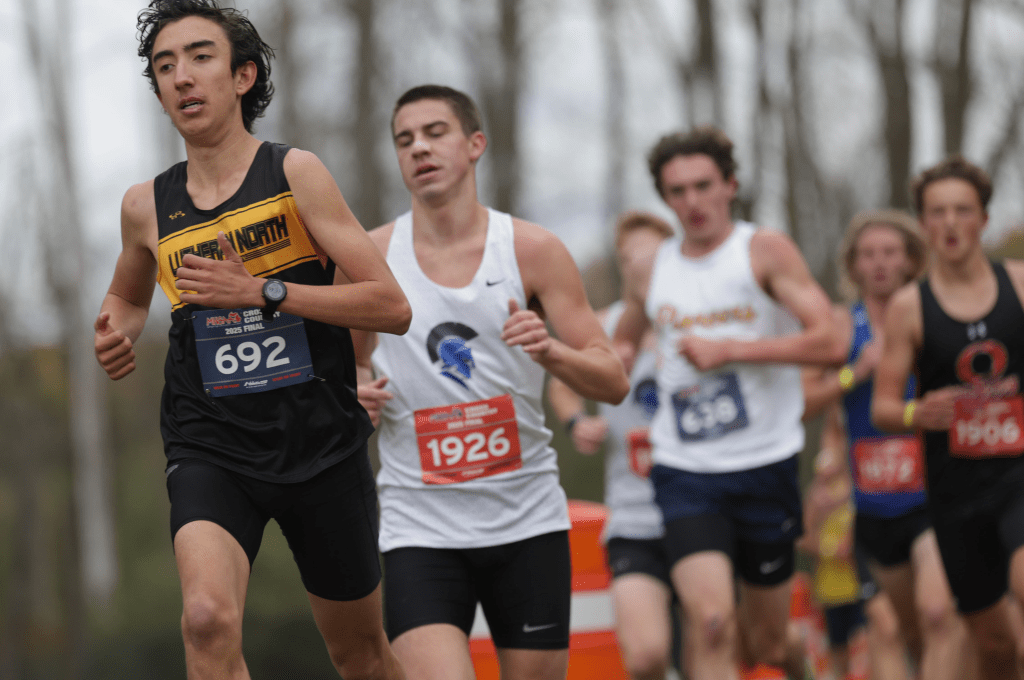
Joshua Macri, Macomb Lutheran North – projected 45th with 22.3% chance, placed 19th
What did it take? His first sub-16 since early September. Macri had been on the cusp on multiple occasions, under 16:10 on four separate occasions throughout September and October, before breaking through with a personal best.
Ryan Good, Parma Western – projected 55th with a 19.2% chance, placed 21st
What did it take? A repeat of his regional performance, as Good matched his 15:55 season best. As with McInerney, has shown the ability to rise to the occasion in November, earning back-to-back podium finishes.
Christian Ayres, Battle Creek Harper Creek – projected 48th with a 3.5% chance, placed 22nd
What did it take? Breaking into the 15’s for the first time ever. Ayres had flirted with the 15’s on a few occasions – once at Bulldog and again in the Battle Creek City Championship. With his 15:56, the third time was the charm.
Seth Betzold, Essexville Garber – projected 36th with a 12% chance, placed 23rd
What did it take? A championship season where he was on another level in comparison to the rest of the fall. At Regionals, State, and MITCA, Betzold averaged a 16-flat. Everything else, above 16:30.
Owen Metzger, Sparta – projected 44th with a 16.5% chance, placed 24th
What did it take? Just being on the line. Unfortunately, Owen wasn’t able to compete here as a junior, but he was able to make up for lost time. His 15:58 was his first sub-16 of the year and a memorable way to end his Sparta career.
Owen Adams, Spring Lake – projected 33rd with a 10.1% chance, placed 25th
What did it take? A tremendous improvement from his sophomore year. For one, Adams had never toed the line at MIS, so even without his medal-earning 15:58, the season was a success. But that sub-16 was the second in as many weeks, a sharp drop from the mid-16’s he had been hitting throughout the fall.
Matthew Carbajo, Grosse Ile – projected 66th with a 13.8% chance, placed 29th
What did it take? Another athlete with a significant time drop, Carbajo’s coming between his junior and senior seasons. His 11th grade version set a personal best here with a 16:32, a year later, he’d broken 16:00 for the second time.
Tommy Beiter, Flint Powers Catholic – projected 40th with a 29.1% chance, placed 30th
What did it take? The continuation of his late-season form. With the exception of Bluejay, Beiter had hovered in the mid-16’s for much of his important races. Championship season was a different story, as Tommy reeled off three straight 16:0x efforts, the best of which coming here at State.
Perfectly Paced
Just as it’s described, the runners that hit as close to their average pace as possible. Pace is based on their overall time, though the figures include the mile splits.
| Place | Grade | Name | Time | Pace | Team | 1st Mile | 2nd Mile | 3rd Mile | Overall Diff. |
| 150 | 12 | Katelynn Boyd | 20:33.2 | 6:36.9 | Hudsonville Unity Christian | 6:37.5 | 6:41.7 | 6:36.4 | 5.9 |
| 11 | 11 | Addison Josephson | 18:23.9 | 5:55.3 | Linden | 5:54.0 | 5:58.1 | 5:57.7 | 6.5 |
| 135 | 12 | Emily Agnew | 20:19.2 | 6:32.4 | DeWitt | 6:32.3 | 6:38.7 | 6:32.7 | 6.7 |
| 134 | 11 | Noelle Wielhouwer | 20:19.1 | 6:32.4 | Hudsonville Unity Christian | 6:32.1 | 6:36.1 | 6:35.5 | 7.1 |
| 65 | 9 | Brooklyn Takagishi | 19:35.9 | 6:18.5 | DeWitt | 6:16.7 | 6:20.8 | 6:22.4 | 8.0 |
| 18 | 10 | Anneliese Passchier | 18:30.0 | 5:57.3 | East Grand Rapids | 5:58.1 | 6:03.4 | 5:56.0 | 8.2 |
| 14 | 10 | Kayla Shellenbarger | 18:25.7 | 5:55.9 | Goodrich | 5:53.8 | 5:58.0 | 6:00.1 | 8.4 |
| 60 | 10 | Courtney Floeter | 19:28.7 | 6:16.2 | Linden | 6:22.3 | 6:14.1 | 6:16.4 | 8.4 |
| 149 | 12 | Sadie Schout | 20:32.2 | 6:36.6 | Hudsonville Unity Christian | 6:35.2 | 6:44.0 | 6:36.5 | 8.9 |
| Place | Grade | Name | Time | Overall Pace | Team | 1st Mile | 2nd Mile | 3rd Mile | Overall Diff. |
| 44 | 11 | Omar Elbashir | 16:14.5 | 5:13.6 | Detroit Country Day | 5:13.1 | 5:15.0 | 5:15.1 | 3.4 |
| 36 | 12 | Ronnie Silveira | 16:07.3 | 5:11.3 | Allendale | 5:09.7 | 5:12.7 | 5:10.4 | 3.9 |
| 40 | 12 | Henry Fredenberg | 16:13.1 | 5:13.2 | Chelsea | 5:12.0 | 5:15.0 | 5:14.5 | 4.3 |
| 160 | 10 | Jack Mechenbier | 17:05.1 | 5:29.9 | Richland Gull Lake | 5:28.9 | 5:33.0 | 5:30.4 | 4.6 |
| 15 | 10 | Ashton Fink | 15:50.8 | 5:06.0 | GR Christian | 5:06.5 | 5:05.2 | 5:10.0 | 5.3 |
| 141 | 10 | Eddie Radtke | 16:58.6 | 5:27.8 | Shepherd | 5:29.5 | 5:31.9 | 5:27.4 | 6.2 |
| 37 | 11 | Wyeth Angus | 16:09.8 | 5:12.1 | Chelsea | 5:15.1 | 5:14.9 | 5:11.6 | 6.3 |
| 95 | 11 | Jakin Whitney | 16:41.4 | 5:22.3 | Shepherd | 5:24.8 | 5:26.4 | 5:20.5 | 8.4 |
| 9 | 12 | Aden Ashworth | 15:34.4 | 5:00.7 | Allendale | 4:58.5 | 5:06.3 | 5:00.1 | 8.4 |
| 53 | 11 | Steven Zawacki | 16:20.1 | 5:15.4 | FHE Ada Forest Hills Eastern | 5:13.2 | 5:19.6 | 5:17.7 | 8.7 |

Quickest Kick
Once again, just as it sounds. The fastest times from the 3 mile mark to the finish. I hope everyone listed tries their hand at a 400 or 800 this spring. If you have this sort of energy at the end of a 5k, you might have some secret mid-distance skill we didn’t know about.
| Place | Grade | Name | Time | Team | Kick | Places Moved | Kick Pace |
| 107 | 9 | Julia Geisz | 20:04.6 | Marian (Bloomfield Hills) | 28.4 | -22 | 4:25.4 |
| 146 | 12 | Lauryn Byker | 20:29.7 | Hudsonville Unity Christian | 30.6 | -8 | 4:46.0 |
| 8 | 11 | Annabelle Lowman | 18:05.8 | Ludington | 31.0 | 0 | 4:49.7 |
| 3 | 9 | Eliza Schwass | 17:44.0 | Ludington | 31.1 | 0 | 4:50.7 |
| 178 | 10 | Alayna Smith | 21:07.0 | Marian (Bloomfield Hills) | 31.2 | -8 | 4:51.6 |
| 198 | 9 | Kamille Fitzpatrick | 21:27.2 | Armada | 31.3 | -8 | 4:52.5 |
| 214 | 10 | Astrid Leininger | 21:47.6 | Adrian | 31.5 | -7 | 4:54.4 |
| 43 | 9 | Hailey Kuhn | 19:04.7 | Cadillac | 32.0 | -3 | 4:59.1 |
| 12 | 11 | Lane Isom | 18:25.0 | Richland Gull Lake | 32.1 | -3 | 5:00.0 |
| 24 | 12 | Chloe Rinzema | 18:35.1 | GR South Christian | 32.1 | -2 | 5:00.0 |

| Place | Grade | Name | Time | Team | Kick | Places Moved | Kick Pace |
| 10 | 12 | Edison Lopeman | 15:37.5 | Parma Western | 25.6 | -2 | 3:59.3 |
| 73 | 12 | Tyler VanKuiken | 16:32.9 | East Grand Rapids | 26.6 | -8 | 4:08.6 |
| 72 | 11 | Lincoln Reed | 16:32.6 | Pinckney | 26.7 | -7 | 4:09.5 |
| 130 | 12 | Dayton Moran | 16:55.3 | Richland Gull Lake | 26.7 | -14 | 4:09.5 |
| 81 | 12 | Thad VanderLaan | 16:36.5 | GR South Christian | 26.8 | -10 | 4:10.5 |
| 103 | 12 | Raymond Herek | 16:45.7 | Williamston | 27.0 | -9 | 4:12.3 |
| 202 | 11 | Owen VanDyke | 17:30.8 | Allendale | 27.4 | -10 | 4:16.1 |
| 23 | 11 | Seth Betzold | 15:57.6 | Essexville Garber | 27.4 | -6 | 4:16.1 |
| 78 | 10 | Roan VanSumeren | 16:35.3 | Parma Western | 27.6 | -7 | 4:17.9 |
| 124 | 12 | Isaiah Lindstrom | 16:53.4 | GR Christian | 27.6 | -14 | 4:17.9 |
Girls Adjustment: +20
Boys Adjustment: +13
| Place | Grade | Name | Time | Team | Rating |
| 1 | 12 | Emma Hoffman | 16:50.1 | Otsego | 176.6 |
| 2 | 12 | Katie Berkshire | 17:03.0 | Gaylord | 172.3 |
| 3 | 9 | Eliza Schwass | 17:44.0 | Ludington | 158.7 |
| 4 | 11 | Caroline Randall | 17:49.6 | Hastings | 156.8 |
| 5 | 11 | Jaelyn Ray | 17:53.0 | Pinckney | 155.7 |
| 6 | 10 | Avery Engbers | 18:05.0 | Holland Christian | 151.7 |
| 7 | 11 | Ava Schafer | 18:05.6 | St. Johns | 151.5 |
| 8 | 11 | Annabelle Lowman | 18:05.8 | Ludington | 151.4 |
| 9 | 12 | Elise Barden | 18:10.6 | Frankenmuth | 149.8 |
| 10 | 12 | Natalie Foltz | 18:19.9 | Frankenmuth | 146.7 |
| 11 | 11 | Addison Josephson | 18:23.9 | Linden | 145.4 |
| 12 | 11 | Lane Isom | 18:25.0 | Richland Gull Lake | 145.0 |
| 13 | 11 | Clara Kaczor | 18:25.2 | Freeland | 144.9 |
| 14 | 10 | Kayla Shellenbarger | 18:25.7 | Goodrich | 144.8 |
| 15 | 12 | Julia Garcia | 18:27.7 | Pinckney | 144.1 |
| 16 | 11 | Alivia Ottinger | 18:28.5 | Goodrich | 143.8 |
| 17 | 11 | Eliana Stob | 18:29.1 | Holland Christian | 143.6 |
| 18 | 10 | Anneliese Passchier | 18:30.0 | East Grand Rapids | 143.3 |
| 19 | 10 | Madison Petty | 18:30.5 | Adrian | 143.2 |
| 20 | 9 | Alayna Verhage | 18:30.6 | Otsego | 143.1 |
| 21 | 10 | Oakley Osterhart | 18:30.7 | Coopersville | 143.1 |
| 22 | 11 | Ella McInerney | 18:33.0 | Cadillac | 142.3 |
| 23 | 12 | Lilah Poel | 18:33.7 | GR Christian | 142.1 |
| 24 | 12 | Chloe Rinzema | 18:35.1 | GR South Christian | 141.6 |
| 25 | 11 | Olivia Weiss | 18:35.3 | Holland | 141.6 |
| 26 | 10 | Remie Ellis | 18:35.7 | Eaton Rapids | 141.4 |
| 27 | 10 | Tiffany DeMaagd | 18:36.5 | GR South Christian | 141.2 |
| 28 | 12 | Marie Gates | 18:37.2 | Hudsonville Unity Christian | 140.9 |
| 29 | 10 | Mai Nguyen | 18:40.8 | Plainwell | 139.7 |
| 30 | 12 | Beatrice Perucchetti | 18:41.7 | St. Joseph | 139.4 |
| 31 | 11 | Adeline Armstrong | 18:42.2 | East Grand Rapids | 139.3 |
| 32 | 9 | Addelyn Sabatke | 18:43.0 | Otsego | 139.0 |
| 33 | 10 | Annika Stob | 18:45.1 | Holland Christian | 138.3 |
| 34 | 12 | Brooklynn Brown | 18:48.7 | Cadillac | 137.1 |
| 35 | 12 | Alexis Kotkowicz | 18:49.5 | Spring Lake | 136.8 |
| 36 | 11 | Zoe Hoekstra | 18:52.6 | GR Christian | 135.8 |
| 37 | 9 | Vittoria Perucchetti | 18:53.2 | St. Joseph | 135.6 |
| 38 | 10 | Ana Lovell | 18:55.2 | Lake Fenton | 134.9 |
| 39 | 12 | Ellie Scholma | 18:56.5 | GR Christian | 134.5 |
| 40 | 11 | Ayda Skeels | 18:59.5 | Adrian | 133.5 |
| 41 | 11 | Johanna Mulder | 19:03.3 | Holland | 132.2 |
| 42 | 12 | Layla Geurink | 19:03.8 | Holland Christian | 132.1 |
| 43 | 9 | Hailey Kuhn | 19:04.7 | Cadillac | 131.8 |
| 44 | 9 | Lily VanEyk | 19:05.8 | GR South Christian | 131.4 |
| 45 | 12 | Linnea Paige | 19:06.6 | Fremont | 131.1 |
| 46 | 10 | Rory Doepker | 19:08.3 | DeWitt | 130.6 |
| 47 | 11 | Lucy Waalkes | 19:08.3 | GR Christian | 130.6 |
| 48 | 11 | Bridget Fidkowski | 19:09.4 | Ann Arbor Fr Gabriel Richard | 130.2 |
| 49 | 11 | Skylar Mejeur | 19:11.3 | Otsego | 129.6 |
| 50 | 10 | Danica Redes | 19:13.3 | Shepherd | 128.9 |
| 51 | 10 | Quinn McWilliams | 19:14.8 | Coopersville | 128.4 |
| 52 | 9 | Taylee Fox | 19:16.3 | Otsego | 127.9 |
| 53 | 10 | Grace Leman | 19:16.4 | Edwardsburg | 127.9 |
| 54 | 11 | Ellery Lampen | 19:17.0 | Holland Christian | 127.7 |
| 55 | 11 | Mackenzie Huizenga | 19:18.3 | Holland Christian | 127.2 |
| 56 | 10 | Eva Lindstrom | 19:24.8 | GR Christian | 125.1 |
| 57 | 11 | Monica Lynn | 19:26.1 | Ann Arbor Fr Gabriel Richard | 124.6 |
| 58 | 11 | Ahna Woltjer | 19:27.5 | GR West Mich. Aviation | 124.2 |
| 59 | 9 | Adelyn Verhage | 19:28.2 | Otsego | 123.9 |
| 60 | 10 | Courtney Floeter | 19:28.7 | Linden | 123.8 |
| 61 | 10 | Abree VanDenBrink | 19:30.5 | Wayland Union | 123.2 |
| 62 | 11 | Samantha Whitlam | 19:33.1 | Macomb Lutheran North | 122.3 |
| 63 | 12 | Tessa Hatt | 19:34.7 | Sturgis | 121.8 |
| 64 | 12 | Samantha Brown | 19:35.8 | Clio | 121.4 |
| 65 | 9 | Brooklyn Takagishi | 19:35.9 | DeWitt | 121.4 |
| 66 | 10 | Abby Crandell | 19:37.4 | Owosso | 120.9 |
| 68 | 12 | Rebekah Stachura | 19:37.8 | Otsego | 120.7 |
| 67 | 12 | Miriam Kloha | 19:37.8 | St. Johns | 120.7 |
| 69 | 10 | Saige Cole | 19:38.1 | Yale | 120.6 |
| 70 | 10 | Addison Bixler | 19:38.9 | Coopersville | 120.4 |
| 71 | 11 | Sawyer Reagan | 19:40.9 | Allendale | 119.7 |
| 72 | 9 | Jordane Falvey | 19:42.5 | Dearborn Divine Child | 119.2 |
| 73 | 10 | Ava Benedict | 19:43.5 | Ionia | 118.8 |
| 74 | 12 | Amerie Wilson | 19:44.3 | Milan | 118.6 |
| 75 | 11 | Melody Meckstroth | 19:44.4 | Linden | 118.5 |
| 76 | 11 | Claire Brown | 19:44.6 | Goodrich | 118.5 |
| 77 | 10 | Sophie Jones | 19:44.7 | Holland Christian | 118.4 |
| 78 | 9 | Zoey Cheney | 19:45.1 | New Boston Huron | 118.3 |
| 79 | 10 | Eastynn Charder | 19:45.3 | Pinckney | 118.2 |
| 80 | 12 | Jillian Clason | 19:46.2 | FHE Ada Forest Hills Eastern | 117.9 |
| 81 | 12 | Joelle Patten | 19:47.9 | Fremont | 117.4 |
| 82 | 12 | Ava Pawlick | 19:48.9 | Petoskey | 117.0 |
| 83 | 11 | Colette Charchut | 19:49.0 | Haslett | 117.0 |
| 84 | 10 | Kaleigh Clark | 19:50.3 | Spring Lake | 116.6 |
| 85 | 10 | Vivienne Conflitti | 19:51.1 | FHE Ada Forest Hills Eastern | 116.3 |
| 86 | 12 | Isabella Taber | 19:51.6 | DeWitt | 116.1 |
| 87 | 10 | Claire Miller | 19:51.7 | Monroe Jefferson | 116.1 |
| 88 | 10 | Bridget Fullerton | 19:52.1 | Parma Western | 116.0 |
| 89 | 11 | Baylor Lauinger | 19:53.7 | Goodrich | 115.4 |
| 90 | 9 | Kalynn Young | 19:54.2 | Richland Gull Lake | 115.3 |
| 91 | 9 | Myah Breuker | 19:54.7 | Fremont | 115.1 |
| 92 | 9 | Noelle Hulst | 19:55.6 | GR South Christian | 114.8 |
| 93 | 11 | Zora Ziolkowski | 19:56.0 | Chelsea | 114.7 |
| 94 | 9 | Annalise Wiltjer | 19:57.2 | GR South Christian | 114.3 |
| 95 | 12 | Maddy Takagishi | 19:57.6 | DeWitt | 114.1 |
| 96 | 9 | Isabelle Oostema | 19:58.3 | GR South Christian | 113.9 |
| 97 | 11 | Lucille Clark | 19:58.7 | Marian (Bloomfield Hills) | 113.8 |
| 98 | 10 | Chloe Mazza | 19:59.0 | Cadillac | 113.7 |
| 99 | 10 | Molly Bruggink | 19:59.1 | Plainwell | 113.6 |
| 100 | 12 | Avery Turk | 19:59.6 | New Boston Huron | 113.5 |
| 101 | 9 | Cecilia Kelly | 20:01.1 | Williamston | 113.0 |
| 102 | 11 | Mia May | 20:02.0 | Sparta | 112.7 |
| 103 | 12 | Lydia Huisman | 20:02.1 | GR South Christian | 112.6 |
| 104 | 9 | Lulu Park | 20:03.0 | Sturgis | 112.3 |
| 105 | 11 | Sophia Schafer | 20:03.7 | Williamston | 112.1 |
| 106 | 11 | Kylie Mausolf | 20:04.0 | Birch Run | 112.0 |
| 107 | 9 | Julia Geisz | 20:04.6 | Marian (Bloomfield Hills) | 111.8 |
| 108 | 12 | Georgia Babcock | 20:04.9 | Edwardsburg | 111.7 |
| 109 | 10 | Cailyn Baker | 20:05.2 | Shepherd | 111.6 |
| 110 | 10 | Natalie Hayes | 20:05.4 | DeWitt | 111.5 |
| 111 | 12 | Alanis Povey | 20:05.9 | Gladwin | 111.4 |
| 112 | 10 | Peyhton Beardsley | 20:06.2 | Fruitport | 111.3 |
| 113 | 10 | Lily Phillips | 20:06.7 | FHE Ada Forest Hills Eastern | 111.1 |
| 114 | 10 | Chloe Boright | 20:06.9 | Macomb Lutheran North | 111.0 |
| 115 | 12 | Evelyn Kuhn | 20:07.0 | Ann Arbor Fr Gabriel Richard | 111.0 |
| 116 | 11 | Hannah Haines | 20:07.2 | Madison Heights Lamphere | 110.9 |
| 117 | 11 | Claire Arnold | 20:07.3 | Essexville Garber | 110.9 |
| 118 | 10 | Lexi Gibson | 20:07.9 | Holland | 110.7 |
| 119 | 12 | Falyn Doss | 20:08.0 | New Boston Huron | 110.7 |
| 120 | 10 | Ellia Egle | 20:08.8 | New Boston Huron | 110.4 |
| 121 | 10 | Audrey Kline | 20:09.1 | St. Joseph | 110.3 |
| 123 | 10 | Lucy Bott | 20:09.9 | Fenton | 110.0 |
| 122 | 11 | Lucy Conzelmann | 20:09.9 | Frankenmuth | 110.0 |
| 124 | 12 | Annika TerBeek | 20:10.0 | GR Christian | 110.0 |
| 125 | 10 | Valyntina Garcia | 20:10.3 | Pinckney | 109.9 |
| 126 | 11 | Diya Goyal | 20:11.5 | Cranbrook Kingswood | 109.5 |
| 127 | 10 | Karina Mihai-Grammes | 20:13.2 | Adrian | 108.9 |
| 128 | 10 | Gabby Schuff | 20:13.9 | Marian (Bloomfield Hills) | 108.7 |
| 129 | 10 | Alexis White | 20:14.4 | New Boston Huron | 108.5 |
| 130 | 12 | Joselyn Chapman | 20:15.5 | Marysville | 108.2 |
| 131 | 11 | Natalie Kuhl | 20:15.9 | Parma Western | 108.0 |
| 132 | 10 | Molly Roberts | 20:17.3 | Linden | 107.6 |
| 133 | 10 | Addy Nesbitt | 20:19.1 | Cedar Springs | 107.0 |
| 134 | 11 | Noelle Wielhouwer | 20:19.1 | Hudsonville Unity Christian | 107.0 |
| 135 | 12 | Emily Agnew | 20:19.2 | DeWitt | 106.9 |
| 136 | 11 | Hayden Lemieux | 20:19.8 | Paw Paw | 106.7 |
| 137 | 11 | Iris Zylstra | 20:22.0 | East Grand Rapids | 106.0 |
| 138 | 11 | Elliana Hufton | 20:22.7 | Lake Fenton | 105.8 |
| 139 | 11 | Zoe German | 20:23.1 | Fruitport | 105.6 |
| 140 | 10 | Grace Mingerink | 20:24.5 | DeWitt | 105.2 |
| 141 | 9 | Claire Albrecht | 20:26.5 | Armada | 104.5 |
| 142 | 9 | Lucy Straveler | 20:27.4 | East Grand Rapids | 104.2 |
| 143 | 10 | Lucy Gump | 20:27.7 | Macomb Lutheran North | 104.1 |
| 144 | 9 | Katie Niederquell | 20:28.5 | Freeland | 103.8 |
| 145 | 9 | Tessa Nienhuis | 20:28.5 | Holland | 103.8 |
| 146 | 12 | Lauryn Byker | 20:29.7 | Hudsonville Unity Christian | 103.4 |
| 147 | 11 | Cora Parker | 20:29.8 | Spring Lake | 103.4 |
| 148 | 9 | Breslyn Klein | 20:31.0 | Coopersville | 103.0 |
| 149 | 12 | Sadie Schout | 20:32.2 | Hudsonville Unity Christian | 102.6 |
| 150 | 12 | Katelynn Boyd | 20:33.2 | Hudsonville Unity Christian | 102.3 |
| 151 | 10 | Jamie Glatfelter | 20:33.7 | Trenton | 102.1 |
| 152 | 9 | Matia Battjes | 20:34.3 | Spring Lake | 101.9 |
| 153 | 10 | Ruth Hanson | 20:35.3 | Cadillac | 101.6 |
| 154 | 10 | Ava Clark | 20:35.6 | Goodrich | 101.5 |
| 155 | 12 | Abigail Denoyer | 20:36.0 | Armada | 101.3 |
| 156 | 11 | Avery Silvas | 20:36.4 | Charlotte | 101.2 |
| 157 | 10 | Joy Van Wyk | 20:38.2 | GR Christian | 100.6 |
| 158 | 9 | Anna McCarthy | 20:42.0 | Marian (Bloomfield Hills) | 99.3 |
| 159 | 12 | Alyssa Korte | 20:43.3 | Grosse Ile | 98.9 |
| 160 | 10 | Gabriella Dallas | 20:44.3 | Freeland | 98.6 |
| 161 | 10 | Madelyn Barkley | 20:46.7 | Croswell-Lexington | 97.8 |
| 162 | 11 | Clare Assaf | 20:47.0 | East Grand Rapids | 97.7 |
| 163 | 9 | Natalie Christoffersen | 20:47.3 | Fremont | 97.6 |
| 165 | 12 | Catherine Schellhammer | 20:49.2 | East Grand Rapids | 96.9 |
| 164 | 12 | Megan Gimmey | 20:49.2 | Shepherd | 96.9 |
| 166 | 9 | Charly Braidwood | 20:50.3 | Spring Lake | 96.6 |
| 167 | 12 | Roisin Whelan | 20:50.8 | Marian (Bloomfield Hills) | 96.4 |
| 168 | 11 | Lily Cummings | 20:54.7 | St. Joseph | 95.1 |
| 169 | 11 | Kenzie LeVey | 20:56.3 | Marysville | 94.6 |
| 170 | 12 | Brooklyn Reason | 20:56.7 | Pinckney | 94.4 |
| 171 | 9 | Katelyn Schweihofer | 20:57.8 | Yale | 94.1 |
| 172 | 9 | Kate Duffy | 20:58.1 | Williamston | 94.0 |
| 173 | 12 | Reese Supianoski | 21:01.6 | Williamston | 92.8 |
| 174 | 9 | Jillian Morris | 21:01.9 | St. Joseph | 92.7 |
| 175 | 12 | Chloe Khon | 21:02.0 | Jackson Northwest | 92.7 |
| 176 | 12 | Avery Faut | 21:06.1 | Ann Arbor Fr Gabriel Richard | 91.3 |
| 177 | 11 | Ava Pfaffenbach | 21:06.4 | Ann Arbor Fr Gabriel Richard | 91.2 |
| 178 | 10 | Alayna Smith | 21:07.0 | Marian (Bloomfield Hills) | 91.0 |
| 179 | 9 | Grace Kloha | 21:09.0 | Freeland | 90.3 |
| 180 | 10 | Ashlyn DePoy | 21:09.1 | Holland | 90.3 |
| 181 | 10 | Briella Kohley | 21:10.4 | Spring Lake | 89.9 |
| 182 | 12 | Jada Prescott | 21:10.8 | Freeland | 89.7 |
| 183 | 12 | Berkley Holtz | 21:11.0 | Sturgis | 89.7 |
| 184 | 12 | Andie Wildern | 21:11.8 | Charlotte | 89.4 |
| 185 | 9 | Emma Durling | 21:13.2 | Linden | 88.9 |
| 186 | 11 | Kayla Christesen | 21:13.3 | New Boston Huron | 88.9 |
| 187 | 10 | Sarah Warner | 21:14.4 | Shepherd | 88.5 |
| 188 | 11 | Aubrey Hare | 21:14.8 | Saginaw Swan Valley | 88.4 |
| 190 | 12 | Emilee Young | 21:15.7 | Shepherd | 88.1 |
| 189 | 10 | Reggie Cooke | 21:15.7 | Williamston | 88.1 |
| 191 | 11 | Evelyn Buckley | 21:18.4 | Macomb Lutheran North | 87.2 |
| 192 | 10 | Peyton Simmons | 21:18.6 | Marysville | 87.1 |
| 193 | 9 | Loretta Frasca | 21:19.1 | Ann Arbor Fr Gabriel Richard | 87.0 |
| 194 | 12 | Zeva Hathaway | 21:19.4 | Pinckney | 86.9 |
| 195 | 10 | Emily Lasceski | 21:19.9 | Freeland | 86.7 |
| 196 | 12 | Avari Montgomery | 21:20.7 | Charlotte | 86.4 |
| 197 | 9 | Megyn Allers | 21:21.1 | Coopersville | 86.3 |
| 198 | 9 | Kamille Fitzpatrick | 21:27.2 | Armada | 84.3 |
| 199 | 10 | Abigail Adams | 21:27.7 | Pinckney | 84.1 |
| 200 | 12 | Carly Gaylord | 21:30.3 | Cadillac | 83.2 |
| 201 | 12 | Samantha Frank | 21:30.6 | Frankenmuth | 83.1 |
| 202 | 12 | Molly McNabb | 21:31.4 | St. Clair | 82.9 |
| 203 | 11 | Lillian Bender | 21:31.9 | Yale | 82.7 |
| 204 | 12 | Gabby Cleveland | 21:32.3 | Frankenmuth | 82.6 |
| 205 | 12 | Samantha Bieber | 21:32.4 | Chelsea | 82.5 |
| 206 | 11 | Olivia Mielke | 21:34.3 | Freeland | 81.9 |
| 207 | 11 | Eleanor Park | 21:35.9 | Sturgis | 81.4 |
| 208 | 10 | Regan Faut | 21:36.2 | Ann Arbor Fr Gabriel Richard | 81.3 |
| 209 | 12 | Olivia Droski | 21:37.1 | Coopersville | 81.0 |
| 210 | 10 | Stella Inchauste | 21:37.3 | East Grand Rapids | 80.9 |
| 211 | 10 | Adrianna Hepinstall | 21:39.4 | Marysville | 80.2 |
| 212 | 11 | Jean Holland | 21:44.8 | Cadillac | 78.4 |
| 213 | 12 | Kaily McDaniel | 21:45.8 | Milan | 78.1 |
| 214 | 10 | Astrid Leininger | 21:47.6 | Adrian | 77.5 |
| 215 | 12 | Ava Krohn | 21:48.9 | Fremont | 77.0 |
| 216 | 11 | Madison Moeggenborg | 21:49.4 | Shepherd | 76.9 |
| 217 | 12 | Elizabeth Smoes | 21:49.6 | Coopersville | 76.8 |
| 218 | 12 | Sydney Bir | 21:50.9 | Sturgis | 76.4 |
| 219 | 9 | Melanie Clark | 21:51.5 | Marian (Bloomfield Hills) | 76.2 |
| 220 | 9 | Jennalynn Bronstein | 21:52.1 | New Boston Huron | 76.0 |
| 221 | 11 | Sidney Shepard | 21:55.1 | Linden | 75.0 |
| 222 | 9 | Addyson Campbell | 21:55.3 | Goodrich | 74.9 |
| 223 | 10 | Bryleigh Belcher | 21:57.6 | Linden | 74.1 |
| 224 | 12 | Kenzie Eicher | 21:58.8 | Sturgis | 73.7 |
| 225 | 11 | Brynn Robinson | 21:59.8 | Shepherd | 73.4 |
| 226 | 11 | Ella Thornton | 22:01.0 | St. Clair | 73.0 |
| 227 | 11 | Avery Stallmann | 22:01.4 | Macomb Lutheran North | 72.9 |
| 228 | 11 | Ava Childers | 22:05.9 | Yale | 71.4 |
| 229 | 9 | Madison Thomas | 22:06.6 | Williamston | 71.1 |
| 230 | 12 | Isabella Dunn | 22:08.9 | Goodrich | 70.4 |
| 231 | 12 | Nancy Gordon | 22:10.2 | Adrian | 69.9 |
| 232 | 12 | Isabelle Goulding | 22:12.5 | Yale | 69.2 |
| 233 | 12 | Lydia McBride | 22:13.7 | Marysville | 68.8 |
| 234 | 11 | Emma Richardson | 22:14.9 | St. Joseph | 68.4 |
| 235 | 9 | Ariana Macri | 22:23.8 | Macomb Lutheran North | 65.4 |
| 236 | 10 | Annie McMahon | 22:25.8 | Macomb Lutheran North | 64.7 |
| 237 | 10 | Chloe Koskinen | 22:26.2 | Birch Run | 64.6 |
| 238 | 9 | Meredith Bauer | 22:28.4 | Frankenmuth | 63.9 |
| 239 | 11 | Gabriella Komarowski | 22:28.9 | St. Clair | 63.7 |
| 240 | 9 | Hazel Cherney | 22:29.2 | Spring Lake | 63.6 |
| 241 | 10 | Klair Baker | 22:29.3 | Adrian | 63.6 |
| 242 | 11 | Alaina Wheaton | 22:30.9 | St. Joseph | 63.0 |
| 243 | 11 | Eisele Prutch | 22:32.5 | Holland | 62.5 |
| 244 | 11 | Addison Sirianni | 22:33.0 | Bay City Central | 62.3 |
| 245 | 11 | Kira Manchip | 22:33.4 | Fremont | 62.2 |
| 246 | 11 | Harper Schoon-Tanis | 22:34.4 | Holland | 61.9 |
| 247 | 10 | Veronica Shimkus | 22:35.1 | Marysville | 61.6 |
| 248 | 11 | Helena Goodrich | 22:42.2 | Charlotte | 59.3 |
| 249 | 9 | Kendall Dorey | 22:42.2 | Charlotte | 59.3 |
| 250 | 9 | Addison King | 22:56.8 | Frankenmuth | 54.4 |
| 251 | 12 | Haylee Vore | 22:58.3 | Adrian | 53.9 |
| 252 | 12 | Rocquel Richards | 22:58.5 | Fremont | 53.8 |
| 253 | 10 | Sofia Sporman | 22:59.4 | Flint Kearsley | 53.5 |
| 254 | 12 | Jackson Harlan | 23:19.8 | Williamston | 46.7 |
| 255 | 10 | Noelle Marsh | 23:20.8 | Yale | 46.4 |
| 256 | 11 | Eliza Milarch | 23:29.6 | Charlotte | 43.5 |
| 257 | 10 | Madelyn Bean | 23:33.2 | Marysville | 42.3 |
| 258 | 10 | Zyana Wadsworth | 23:41.6 | Yale | 39.5 |
| 259 | 10 | Carolina Garcia | 23:44.7 | Sturgis | 38.4 |
| 260 | 12 | Baylee Moore | 24:17.8 | Charlotte | 27.4 |
| Place | Grade | Name | Time | Team | Rating |
| 1 | 11 | Robert Jazwinski III | 15:07.1 | Whitehall | 213.3 |
| 2 | 12 | Jonah Workman | 15:12.1 | East Grand Rapids | 211.6 |
| 3 | 12 | Thomas Larson | 15:20.9 | Alma | 208.7 |
| 4 | 10 | Gavin Katic | 15:21.7 | Fenton | 208.4 |
| 5 | 10 | Lennox Naswell | 15:24.7 | Flint Powers Catholic | 207.4 |
| 6 | 11 | Ezekiel Baltierra | 15:29.1 | Alma | 206.0 |
| 7 | 10 | Micah Becker | 15:32.6 | East Grand Rapids | 204.8 |
| 8 | 11 | Mitchell Dunlap | 15:33.9 | GR Catholic Central | 204.4 |
| 9 | 12 | Aden Ashworth | 15:34.4 | Allendale | 204.2 |
| 10 | 12 | Edison Lopeman | 15:37.5 | Parma Western | 203.2 |
| 11 | 12 | Bryce Gross | 15:38.2 | Flint Powers Catholic | 202.9 |
| 12 | 11 | Caiden Caswell | 15:41.1 | Vicksburg | 202.0 |
| 13 | 11 | Mason Hill | 15:47.5 | Allendale | 199.8 |
| 14 | 11 | Abraham McHugh | 15:49.4 | Marshall | 199.2 |
| 15 | 10 | Ashton Fink | 15:50.8 | GR Christian | 198.7 |
| 16 | 12 | Shephard Bower | 15:52.1 | FHE Ada Forest Hills Eastern | 198.3 |
| 17 | 12 | Jacob Stanislawski | 15:52.5 | Flat Rock | 198.2 |
| 19 | 11 | Joshua Macri | 15:53.7 | Macomb Lutheran North | 197.8 |
| 18 | 12 | Sean Ryan | 15:53.7 | GR Christian | 197.8 |
| 20 | 12 | Brett Magnus | 15:55.3 | Frankenmuth | 197.2 |
| 21 | 11 | Ryan Good | 15:55.8 | Parma Western | 197.1 |
| 22 | 11 | Christian Ayres | 15:56.9 | BC Harper Creek | 196.7 |
| 23 | 11 | Seth Betzold | 15:57.6 | Essexville Garber | 196.5 |
| 24 | 12 | Owen Metzger | 15:58.0 | Sparta | 196.3 |
| 25 | 11 | Owen Adams | 15:58.1 | Spring Lake | 196.3 |
| 26 | 12 | Asher Jager | 15:58.3 | GR West Mich. Aviation | 196.2 |
| 27 | 12 | Ben Verellen | 15:58.4 | Gladwin | 196.2 |
| 28 | 12 | Aiden Marple | 15:59.3 | DeWitt | 195.9 |
| 29 | 12 | Matthew Carbajo | 15:59.4 | Grosse Ile | 195.9 |
| 30 | 12 | Tommy Beiter | 16:00.3 | Flint Powers Catholic | 195.6 |
| 31 | 11 | Bryce Cahoon | 16:02.4 | Shepherd | 194.9 |
| 32 | 9 | Logan Cristian | 16:03.1 | Parma Western | 194.6 |
| 33 | 12 | Cooper Gardner | 16:03.6 | BC Harper Creek | 194.5 |
| 34 | 11 | Lucas Aardema | 16:05.1 | East Grand Rapids | 194.0 |
| 35 | 9 | Jackson Pant | 16:05.9 | Richland Gull Lake | 193.7 |
| 36 | 12 | Ronnie Silveira | 16:07.3 | Allendale | 193.2 |
| 37 | 11 | Wyeth Angus | 16:09.8 | Chelsea | 192.4 |
| 38 | 11 | Cole McCraw | 16:10.0 | Pinckney | 192.3 |
| 39 | 10 | Carson Wiersbe | 16:12.7 | St. Joseph | 191.4 |
| 40 | 12 | Henry Fredenberg | 16:13.1 | Chelsea | 191.3 |
| 42 | 12 | Charlie Brauer | 16:14.1 | Three Rivers | 191.0 |
| 41 | 10 | Duncan Palmer | 16:14.1 | Williamston | 191.0 |
| 43 | 11 | Reeve Oberman | 16:14.2 | Petoskey | 190.9 |
| 44 | 11 | Omar Elbashir | 16:14.5 | Detroit Country Day | 190.8 |
| 45 | 12 | Jacob Hylton | 16:15.7 | Ortonville Brandon | 190.4 |
| 46 | 11 | Jonathan Rapoza | 16:16.7 | Ann Arbor Fr Gabriel Richard | 190.1 |
| 47 | 11 | Seth Randall | 16:17.4 | St. Joseph | 189.9 |
| 48 | 12 | Caleb Carignan | 16:17.5 | Flint Powers Catholic | 189.8 |
| 49 | 12 | Moises Salazar Jr. | 16:18.2 | Adrian | 189.6 |
| 50 | 12 | Vincent Pattison | 16:18.7 | Goodrich | 189.4 |
| 51 | 10 | Ryan Rathsburg | 16:19.6 | Flint Powers Catholic | 189.1 |
| 52 | 10 | Teddy Weber | 16:20.0 | Williamston | 189.0 |
| 53 | 11 | Steven Zawacki | 16:20.1 | FHE Ada Forest Hills Eastern | 189.0 |
| 54 | 12 | Carson Wood | 16:21.4 | Sparta | 188.5 |
| 55 | 12 | Sam Hillary | 16:23.5 | East Grand Rapids | 187.8 |
| 56 | 9 | Grant Lampen | 16:23.6 | Holland Christian | 187.8 |
| 57 | 11 | Nick Parker | 16:24.2 | Frankenmuth | 187.6 |
| 58 | 12 | Kenny Sheffer | 16:24.6 | Otsego | 187.5 |
| 59 | 10 | Gerard Gilmour | 16:24.7 | Fenton | 187.4 |
| 60 | 12 | Jack Edison | 16:24.8 | East Grand Rapids | 187.4 |
| 62 | 12 | Benjamin Morales | 16:25.2 | Sturgis | 187.3 |
| 61 | 10 | Christian Pavlige | 16:25.2 | Fruitport | 187.3 |
| 63 | 12 | Gavin Markucki | 16:25.7 | Richland Gull Lake | 187.1 |
| 64 | 12 | Lucas Taraszkiewicz | 16:25.8 | Flat Rock | 187.1 |
| 65 | 12 | Alex Culver | 16:27.0 | Howard City Tri-County | 186.7 |
| 66 | 12 | Joseph Horn | 16:28.1 | Ann Arbor Fr Gabriel Richard | 186.3 |
| 67 | 11 | Kevin Terpstra | 16:28.5 | Alma | 186.2 |
| 68 | 12 | Luke Dulecki | 16:29.2 | New Boston Huron | 185.9 |
| 69 | 12 | Murphy Wagner | 16:30.1 | Saginaw Swan Valley | 185.6 |
| 70 | 12 | Jonah Zietlow | 16:30.6 | Three Rivers | 185.5 |
| 71 | 10 | Aiden Lambers | 16:31.3 | Holland | 185.2 |
| 72 | 11 | Lincoln Reed | 16:32.6 | Pinckney | 184.8 |
| 73 | 12 | Tyler VanKuiken | 16:32.9 | East Grand Rapids | 184.7 |
| 74 | 9 | John Rochowiak | 16:33.0 | Pinckney | 184.7 |
| 75 | 12 | Jack Estelle | 16:33.1 | Hopkins | 184.6 |
| 76 | 12 | Zahar Rush | 16:33.4 | Petoskey | 184.5 |
| 77 | 10 | Jack Hincks | 16:34.8 | Detroit Country Day | 184.1 |
| 78 | 10 | Roan VanSumeren | 16:35.3 | Parma Western | 183.9 |
| 79 | 11 | Christopher Vogt | 16:35.7 | Paw Paw | 183.8 |
| 80 | 9 | Zander Stewart | 16:36.0 | Holland Christian | 183.7 |
| 81 | 12 | Thad VanderLaan | 16:36.5 | GR South Christian | 183.5 |
| 82 | 10 | Samuel Johnson | 16:37.6 | Alma | 183.1 |
| 83 | 12 | Reece Howes | 16:37.6 | Three Rivers | 183.1 |
| 84 | 10 | Grayson Michels | 16:38.3 | FHE Ada Forest Hills Eastern | 182.9 |
| 85 | 10 | Macen White | 16:38.5 | Holland Christian | 182.8 |
| 86 | 10 | Eli Morris | 16:38.7 | Tecumseh | 182.8 |
| 87 | 12 | Elijah Baltierra | 16:39.0 | Alma | 182.7 |
| 88 | 10 | Rex Pumford | 16:39.8 | Whitehall | 182.4 |
| 89 | 12 | Aiden Weller | 16:40.2 | Cedar Springs | 182.3 |
| 90 | 11 | Gunnar Djerf | 16:40.5 | Otsego | 182.2 |
| 91 | 12 | Will Johnson | 16:40.8 | Holland Christian | 182.1 |
| 92 | 12 | Nolan Korolden | 16:41.0 | Yale | 182.0 |
| 93 | 10 | Liam Dewitt | 16:41.1 | Haslett | 182.0 |
| 94 | 10 | Jackson Butts | 16:41.3 | Lake Fenton | 181.9 |
| 95 | 11 | Jakin Whitney | 16:41.4 | Shepherd | 181.9 |
| 96 | 9 | Ryan Brown | 16:41.8 | Freeland | 181.7 |
| 97 | 10 | Kaleb Koestner | 16:41.9 | Otsego | 181.7 |
| 98 | 11 | Samuel Organ | 16:42.3 | Cedar Springs | 181.6 |
| 99 | 10 | Easton Coscarelli | 16:43.7 | Adrian | 181.1 |
| 100 | 10 | Kash Moored | 16:43.8 | Hopkins | 181.1 |
| 102 | 12 | Micah Small | 16:44.2 | GR Christian | 180.9 |
| 101 | 12 | Landon Gerritsma | 16:44.2 | Holland Christian | 180.9 |
| 103 | 12 | Raymond Herek | 16:45.7 | Williamston | 180.4 |
| 104 | 9 | Parker Smith | 16:46.2 | Adrian | 180.3 |
| 105 | 12 | Reagan Ward | 16:46.6 | St. Johns | 180.1 |
| 106 | 10 | Tadhg Shoffner | 16:46.9 | Cedar Springs | 180.0 |
| 107 | 12 | Braylon Lenneman | 16:47.1 | DeWitt | 180.0 |
| 108 | 9 | Ryan Long | 16:47.7 | Otsego | 179.8 |
| 109 | 12 | Xavier Roman | 16:48.6 | Macomb Lutheran North | 179.5 |
| 110 | 9 | George Whitaker | 16:49.4 | Otsego | 179.2 |
| 111 | 9 | Leonidas Erfourth | 16:49.6 | Owosso | 179.1 |
| 112 | 11 | Samuel Clifton | 16:50.1 | Chelsea | 179.0 |
| 113 | 12 | Brodie Licata | 16:50.5 | Lake Fenton | 178.8 |
| 114 | 11 | Caleb Lynd | 16:50.9 | Parma Western | 178.7 |
| 115 | 11 | Thomas Fisher | 16:51.0 | East Grand Rapids | 178.7 |
| 117 | 10 | Mason Pietrykowski | 16:51.4 | Richmond | 178.5 |
| 116 | 12 | Hiro Nguyen | 16:51.4 | Plainwell | 178.5 |
| 119 | 9 | Micah Good | 16:52.6 | Parma Western | 178.1 |
| 120 | 12 | Brayden Prieskorn | 16:52.6 | St. Clair | 178.1 |
| 118 | 11 | Bryce Falbe | 16:52.6 | Muskegon Oakridge | 178.1 |
| 121 | 9 | Dane Trask | 16:52.7 | Spring Lake | 178.1 |
| 122 | 11 | Elias DeJong | 16:53.0 | GR Christian | 178.0 |
| 123 | 11 | Ariston Dallas | 16:53.2 | Owosso | 177.9 |
| 124 | 12 | Isaiah Lindstrom | 16:53.4 | GR Christian | 177.9 |
| 125 | 11 | Will Chelotti | 16:53.4 | DeWitt | 177.9 |
| 126 | 10 | Nicholas Ranka | 16:53.5 | Grosse Ile | 177.8 |
| 127 | 12 | Hunter Parsons | 16:54.4 | Whitehall | 177.5 |
| 128 | 11 | Cole Coffman | 16:54.6 | Holland Christian | 177.5 |
| 129 | 11 | Lukas Albright | 16:55.1 | Big Rapids | 177.3 |
| 130 | 12 | Dayton Moran | 16:55.3 | Richland Gull Lake | 177.2 |
| 131 | 12 | Cole Wisniewski | 16:56.3 | Orchard Lake St. Mary’s | 176.9 |
| 132 | 12 | Cole Fernandez | 16:56.4 | Flint Kearsley | 176.9 |
| 133 | 11 | Peyton Farrell | 16:56.5 | Cedar Springs | 176.8 |
| 134 | 11 | Ben Verlin | 16:56.9 | GR South Christian | 176.7 |
| 135 | 11 | Ben Bouchey | 16:57.0 | Flint Powers Catholic | 176.7 |
| 136 | 11 | Ethan Kreger | 16:57.6 | St. Clair | 176.5 |
| 137 | 10 | Ethan Bray | 16:57.8 | Detroit Country Day | 176.4 |
| 138 | 12 | Luca Lebron | 16:58.1 | Alma | 176.3 |
| 139 | 10 | Tate VanDaele | 16:58.2 | FHE Ada Forest Hills Eastern | 176.3 |
| 140 | 12 | Lukus Mendoza | 16:58.6 | Spring Lake | 176.1 |
| 141 | 10 | Eddie Radtke | 16:58.6 | Shepherd | 176.1 |
| 142 | 11 | Drew Davis | 16:58.7 | Shepherd | 176.1 |
| 143 | 10 | Brady VanConant | 16:59.0 | Yale | 176.0 |
| 144 | 9 | Brycen Stewart | 16:59.5 | Allendale | 175.8 |
| 145 | 11 | Ben Panter | 16:59.7 | Fenton | 175.8 |
| 146 | 11 | Hunter Smith | 16:59.7 | Vicksburg | 175.8 |
| 147 | 12 | George Scupham | 17:00.0 | Edwardsburg | 175.7 |
| 148 | 12 | Finn Tauren | 17:01.1 | Richland Gull Lake | 175.3 |
| 149 | 9 | Nico Lebron | 17:01.3 | Alma | 175.2 |
| 150 | 11 | Mason Fein | 17:01.3 | Wayland Union | 175.2 |
| 151 | 10 | Andrew Nunning | 17:01.4 | Pontiac Notre Dame Prep | 175.2 |
| 152 | 12 | Andrew Feldpausch | 17:01.9 | Portland | 175.0 |
| 153 | 11 | Cameron Crane | 17:02.2 | New Boston Huron | 174.9 |
| 154 | 9 | Seth Sytsma | 17:03.3 | GR Christian | 174.6 |
| 156 | 10 | Max Wolgast | 17:03.7 | Three Rivers | 174.4 |
| 155 | 9 | Leland Sowle | 17:03.7 | Parma Western | 174.4 |
| 157 | 9 | Reuben Riemersma | 17:03.8 | Hudsonville Unity Christian | 174.4 |
| 158 | 10 | Ben Kuhn | 17:04.8 | Ann Arbor Fr Gabriel Richard | 174.1 |
| 159 | 10 | Isaac Vandlen | 17:04.8 | Spring Lake | 174.1 |
| 160 | 10 | Jack Mechenbier | 17:05.1 | Richland Gull Lake | 174.0 |
| 161 | 9 | Hari Varma | 17:05.4 | Detroit Country Day | 173.9 |
| 162 | 11 | Owen Thorburn | 17:06.7 | Chelsea | 173.4 |
| 163 | 12 | Rocket Wilson | 17:07.1 | Howard City Tri-County | 173.3 |
| 164 | 12 | Owen Moore | 17:07.3 | Portland | 173.2 |
| 165 | 11 | Jack Frentz | 17:07.7 | Petoskey | 173.1 |
| 166 | 12 | Cooper Donovan | 17:08.4 | FHE Ada Forest Hills Eastern | 172.9 |
| 167 | 12 | Nate Sandula | 17:08.8 | Pinckney | 172.7 |
| 168 | 10 | Jack Krafft | 17:09.3 | Shepherd | 172.6 |
| 169 | 10 | Abram Larsen | 17:09.7 | Fenton | 172.4 |
| 170 | 12 | Ian McNeel | 17:09.8 | Shepherd | 172.4 |
| 171 | 10 | James Scholten-Holcomb | 17:11.4 | GR Christian | 171.9 |
| 172 | 9 | Alex Hagerty | 17:11.9 | Pinckney | 171.7 |
| 173 | 9 | Matthew McFall | 17:13.0 | Pinckney | 171.3 |
| 175 | 10 | David Kore | 17:13.8 | Three Rivers | 171.1 |
| 174 | 11 | Joseph Arriola | 17:13.8 | Dearborn Divine Child | 171.1 |
| 176 | 11 | Brendan Koza | 17:14.2 | Marysville | 170.9 |
| 178 | 9 | Livio Muzzin | 17:14.7 | DeWitt | 170.8 |
| 177 | 11 | Conley Poole | 17:14.7 | Ann Arbor Fr Gabriel Richard | 170.8 |
| 179 | 12 | Neil Orlowski | 17:15.1 | Grosse Pointe North | 170.6 |
| 180 | 9 | James Elliott | 17:15.4 | Cedar Springs | 170.5 |
| 181 | 10 | Liam Raseman | 17:15.6 | Otsego | 170.5 |
| 182 | 11 | Grant Hunault | 17:16.8 | Fenton | 170.1 |
| 183 | 9 | Caleb McBride | 17:16.9 | Marysville | 170.0 |
| 184 | 11 | Landin Fisher | 17:17.6 | Adrian | 169.8 |
| 185 | 10 | Alex Iordanou | 17:17.8 | Flint Powers Catholic | 169.7 |
| 186 | 11 | Jackson Defina | 17:17.9 | Fenton | 169.7 |
| 188 | 10 | Elliot Alef | 17:20.7 | Macomb Lutheran North | 168.8 |
| 187 | 10 | Jacob Kornoely | 17:20.7 | GR West Mich. Aviation | 168.8 |
| 189 | 11 | Leo Alafita | 17:21.1 | Chelsea | 168.6 |
| 190 | 11 | Antonino Biondo | 17:21.3 | Macomb Lutheran North | 168.6 |
| 191 | 12 | Linus Helzerman | 17:22.0 | Chelsea | 168.3 |
| 192 | 9 | Zach Diller | 17:22.1 | Holland Christian | 168.3 |
| 193 | 11 | Logan Rhodes | 17:23.5 | Yale | 167.8 |
| 195 | 12 | Cole Pergram | 17:25.0 | Frankenmuth | 167.3 |
| 194 | 11 | Caleb Maciag | 17:25.0 | Pinckney | 167.3 |
| 196 | 11 | Jackson Martin | 17:26.3 | Fenton | 166.9 |
| 197 | 11 | Carter Fenner | 17:26.7 | Adrian | 166.8 |
| 198 | 12 | Gordie Kaiton | 17:28.3 | FHE Ada Forest Hills Eastern | 166.2 |
| 199 | 10 | Declan Shoffner | 17:28.8 | Cedar Springs | 166.1 |
| 200 | 11 | Spencer Dammann | 17:29.7 | Saginaw Swan Valley | 165.8 |
| 201 | 12 | Judah Bakaitis | 17:30.4 | DeWitt | 165.5 |
| 202 | 11 | Owen VanDyke | 17:30.8 | Allendale | 165.4 |
| 203 | 12 | Matthew Wright | 17:31.9 | Ann Arbor Fr Gabriel Richard | 165.0 |
| 204 | 12 | Anthony Plana | 17:32.3 | Frankenmuth | 164.9 |
| 205 | 11 | Connor Pepin | 17:32.7 | Croswell-Lexington | 164.8 |
| 206 | 12 | Miles Dell | 17:33.1 | Chelsea | 164.6 |
| 207 | 11 | Tristan See | 17:34.4 | Cedar Springs | 164.2 |
| 208 | 11 | Braeden Conger | 17:34.8 | Frankenmuth | 164.1 |
| 209 | 10 | Ben Sushynski | 17:35.1 | Linden | 164.0 |
| 210 | 10 | Cole Raymond | 17:35.1 | Coopersville | 164.0 |
| 211 | 12 | Levi Vanderlaan | 17:35.4 | Spring Lake | 163.9 |
| 212 | 12 | Evan Keller | 17:35.9 | Coopersville | 163.7 |
| 213 | 11 | Brandon Peterson | 17:36.7 | Coopersville | 163.4 |
| 214 | 10 | Braylon Bigorowski | 17:36.8 | Coopersville | 163.4 |
| 215 | 12 | Trey Hall | 17:37.2 | Three Rivers | 163.3 |
| 216 | 11 | Quinn Sanderson | 17:38.1 | FHE Ada Forest Hills Eastern | 163.0 |
| 217 | 12 | Jackson Ellis | 17:38.8 | Ann Arbor Fr Gabriel Richard | 162.7 |
| 218 | 9 | John Fedewa | 17:39.2 | Ann Arbor Fr Gabriel Richard | 162.6 |
| 219 | 9 | Max Bobeda | 17:39.3 | DeWitt | 162.6 |
| 220 | 10 | Lucas Zeckner | 17:40.9 | Adrian | 162.0 |
| 221 | 11 | Ryder Woodwyk | 17:41.1 | Spring Lake | 162.0 |
| 222 | 10 | Gavin Schultz | 17:41.2 | Richland Gull Lake | 161.9 |
| 223 | 12 | Paul Stephens | 17:42.4 | Grosse Pointe North | 161.5 |
| 224 | 10 | Ty Inglis | 17:43.0 | DeWitt | 161.3 |
| 225 | 12 | Leo Bearss | 17:43.2 | Yale | 161.3 |
| 226 | 11 | Griffin Frentz | 17:46.3 | Petoskey | 160.2 |
| 227 | 10 | Liam Tiles | 17:48.3 | Spring Lake | 159.6 |
| 228 | 10 | Gavin McCarney | 17:48.6 | Richland Gull Lake | 159.5 |
| 229 | 10 | Zane Molewyk | 17:51.9 | Coopersville | 158.4 |
| 230 | 11 | Carson Brey | 17:52.9 | Petoskey | 158.0 |
| 231 | 12 | Dane Sprague | 17:53.3 | Allendale | 157.9 |
| 232 | 12 | Luke McDonell | 17:55.0 | St. Clair | 157.3 |
| 233 | 10 | Cole Carless | 17:57.0 | Yale | 156.7 |
| 234 | 9 | Elijah Harris | 17:57.7 | Three Rivers | 156.4 |
| 235 | 10 | Landen Bermudez | 17:59.2 | Dearborn Divine Child | 155.9 |
| 236 | 11 | Jeremy Johnson | 18:03.5 | Marysville | 154.5 |
| 237 | 10 | Logan Carrier | 18:04.5 | Yale | 154.2 |
| 238 | 10 | Griffin Kreger | 18:05.0 | St. Clair | 154.0 |
| 239 | 12 | Grant Garner | 18:06.9 | Macomb Lutheran North | 153.4 |
| 240 | 10 | Adam Ahmad | 18:10.5 | Detroit Country Day | 152.2 |
| 241 | 12 | Oliver Alef | 18:11.5 | Macomb Lutheran North | 151.8 |
| 242 | 11 | Edward Hedrick | 18:13.7 | Adrian | 151.1 |
| 243 | 12 | simon Licata | 18:14.7 | Petoskey | 150.8 |
| 244 | 11 | Gabe Grierson | 18:15.5 | Ludington | 150.5 |
| 245 | 12 | William Haskins | 18:17.2 | Macomb Lutheran North | 149.9 |
| 246 | 10 | Trevor Meyer | 18:17.5 | Otsego | 149.8 |
| 247 | 11 | Remy Cicotte | 18:17.6 | Detroit Country Day | 149.8 |
| 248 | 12 | Brody Sims | 18:20.9 | St. Clair | 148.7 |
| 249 | 11 | Nicolas Eisen | 18:24.9 | Allendale | 147.4 |
| 250 | 12 | Law Sholten | 18:31.2 | Frankenmuth | 145.3 |
| 251 | 12 | Gavin Bishop | 18:33.9 | St. Clair | 144.4 |
| 252 | 9 | David Matthews | 18:40.8 | St. Clair | 142.1 |
| 253 | 11 | Isaac Stebelton | 18:42.1 | Petoskey | 141.6 |
| 254 | 10 | Reid Barden | 18:58.4 | Frankenmuth | 136.2 |
| 255 | 10 | Thomas Schweihofer | 19:07.7 | Yale | 133.1 |
| 256 | 9 | Carsen Modderman | 19:23.9 | Coopersville | 127.7 |
| 257 | 11 | Nicholas Kostecke | 19:27.4 | Detroit Country Day | 126.5 |
| 258 | 11 | Ryan Potts | 19:38.3 | Coopersville | 122.9 |
| 259 | 11 | William McDonald | 22:12.4 | Shepherd | 71.5 |