Finally, the start of the season we’ve all been waiting for. Throw out all the fast times from September, but apply all the lessons learned through the summer and fall. Regional week is here and with it comes the many projections and previews I’ll write.
Just as last year and throughout the season, I’m projecting these using race simulations. Through a season’s worth of speed ratings, one can determine a runner’s average rating and the variability of those ratings. Both those factors are then weighed towards more recent meets, which are then simulated thousands of times using a Monte Carlo analysis (also described by TullyRunners here). Over those thousands of race simulations, one can determine a team’s average place and average score, a runner’s average place, odds on winning, and odds on qualifying.
These are useful in cross country scenarios, where you have consistent runners and those who are a bit more up and down. For example:
| Tanner Time | Tanner Rating | Tanner Avg. | Tanner StDev. |
| 15:30 | 210 | ||
| 15:45 | 205 | ||
| 16:00 | 200 | ||
| 16:15 | 195 | ||
| 16:30 | 190 | 200 | 7.91 |
| MIXCSR Time | MIXCSR Rating | MIXCSR Avg. | MIXCSR StDev. |
| 16:09 | 197 | ||
| 16:12 | 196 | ||
| 16:15 | 195 | ||
| 16:18 | 194 | ||
| 16:21 | 193 | 195 | 1.58 |
Jacob at his best might be faster than I in four of the five races during the season. I’d almost never be All-State in Division 1, but he might contend for a top-5 spot or place 60th.
If we did 20 simulations, this is how it might turn out:
| Race | Tanner Avg. | Tanner StDev | Tanner Rating | MIXCSR Avg. | MIXCSR StDev | MIXCSR Rating |
| 1 | 200 | 7.9 | 202.1 | 195 | 1.6 | 195.6 |
| 2 | 200 | 7.9 | 196.2 | 195 | 1.6 | 194.1 |
| 3 | 200 | 7.9 | 190.0 | 195 | 1.6 | 199.2 |
| 4 | 200 | 7.9 | 193.4 | 195 | 1.6 | 192.5 |
| 5 | 200 | 7.9 | 206.8 | 195 | 1.6 | 195.7 |
| 6 | 200 | 7.9 | 201.8 | 195 | 1.6 | 196.1 |
| 7 | 200 | 7.9 | 171.6 | 195 | 1.6 | 194.9 |
| 8 | 200 | 7.9 | 189.2 | 195 | 1.6 | 195.9 |
| 9 | 200 | 7.9 | 205.5 | 195 | 1.6 | 197.0 |
| 10 | 200 | 7.9 | 203.8 | 195 | 1.6 | 192.6 |
| 11 | 200 | 7.9 | 192.3 | 195 | 1.6 | 196.5 |
| 12 | 200 | 7.9 | 196.9 | 195 | 1.6 | 196.4 |
| 13 | 200 | 7.9 | 198.5 | 195 | 1.6 | 195.6 |
| 14 | 200 | 7.9 | 203.2 | 195 | 1.6 | 194.1 |
| 15 | 200 | 7.9 | 193.9 | 195 | 1.6 | 192.6 |
| 16 | 200 | 7.9 | 199.3 | 195 | 1.6 | 193.2 |
| 17 | 200 | 7.9 | 208.7 | 195 | 1.6 | 194.2 |
| 18 | 200 | 7.9 | 213.7 | 195 | 1.6 | 194.6 |
| 19 | 200 | 7.9 | 212.6 | 195 | 1.6 | 197.1 |
| 20 | 200 | 7.9 | 206.3 | 195 | 1.6 | 193.9 |
I’d win four times, but I’d never have the ability to win a title like he had in Race 18. He’s usually All-State, but may cost his team a title through his effort in Race 7.
The simulations give the possibilities of those scenarios and all the various scoring scripts. A sixth girl that can pop off on any certain day, a reliable boy who always runs 17-flat, you name it. Hopefully, they better elucidate our contenders, qualifiers, and how these races play out over the weekend.
But always remember, races aren’t run on paper or on a computer. These projections are meant to better our sport, give more attention where little is given. Although I take pride in their accuracy, this endeavor would be quite boring if it were always perfect. I look forward to these being proven wrong and I expect to hear about it as well.
Is this the same intro from last year? Heck yeah. Let’s roll through these regionals!
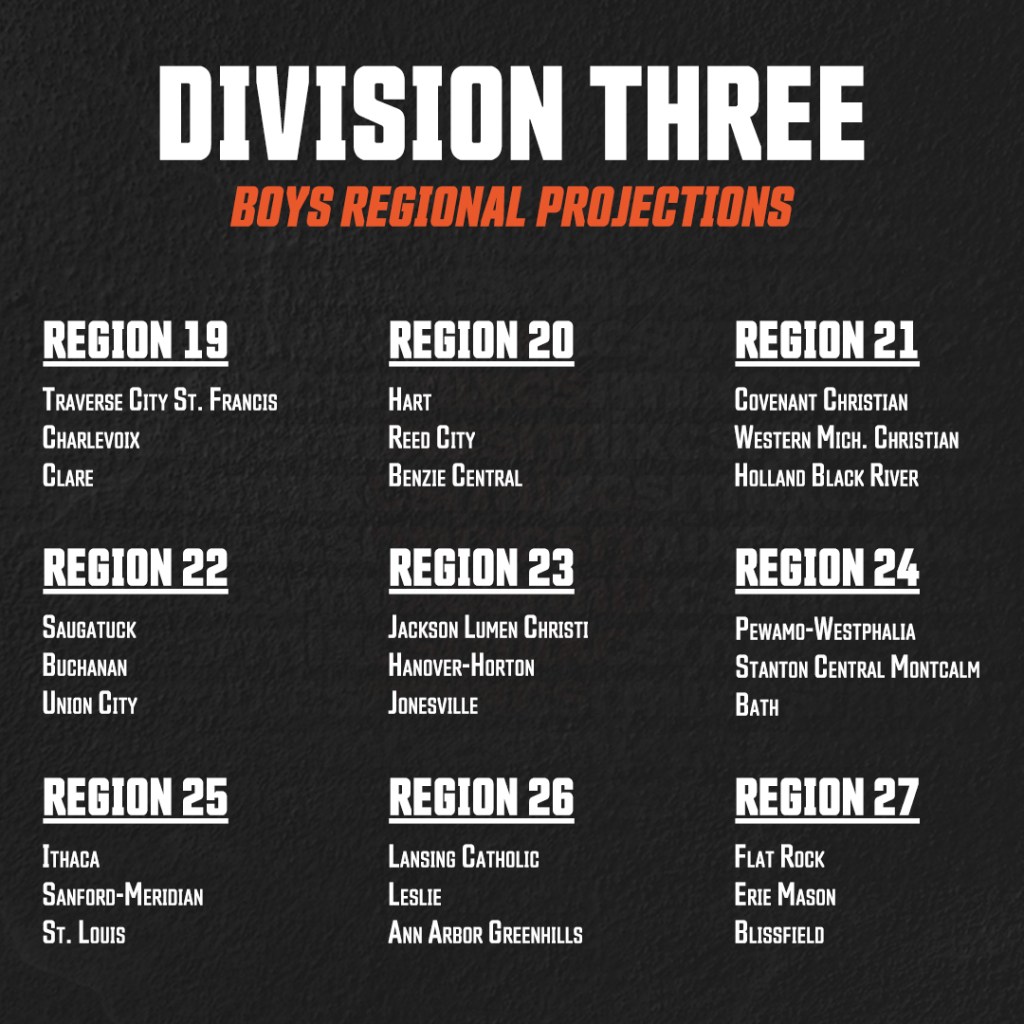
Region 19
What’s the Battle?
Traverse City St. Francis vs. the world. Last fall, the Glads placed all seven varsity runners in the top-11, then went onto claim a win at the State Finals. Next week, the competition will be a bit stronger, but this week can be a nice springboard into a repeat. By the way, the projections again have all seven in the top-11.
Team
| Projected Place | Team | Avg. Score | Avg. Place | Win % | Qualify % | State Rank |
| 1 | Traverse City St. Francis | 21 | 1.0 | 95+ | 95+ | 1 |
| 2 | Charlevoix | 57 | 2.0 | 95+ | 10 | |
| 3 | Clare | 102 | 3.0 | 95+ | 29 | |
| 4 | Roscommon | 160 | 4.1 | 46 | ||
| 5 | Boyne City | 182 | 5.4 | 57 | ||
| 6 | Elk Rapids | 189 | 6.1 | 58 | ||
| 7 | Kalkaska | 207 | 7.2 | 71 | ||
| 8 | Grayling | 207 | 7.4 | 69 | ||
| 9 | Standish-Sterling | 234 | 9.2 | 77 | ||
| 10 | Cheboygan | 242 | 9.7 | 80 | ||
| 11 | Beaverton | 290 | 11.3 | 89 | ||
| 12 | Harrison | 303 | 11.8 | 100 | ||
| 13 | Tawas | 344 | 13.4 | 108 | ||
| 14 | Farwell | 348 | 13.6 | 107 |
Individual
| Place | Grade | Name | Team | Avg. Place |
| 1 | 12 | Josh Slocum | Traverse City St. Francis | 1.3 |
| 2 | 10 | William Ready | Traverse City St. Francis | 2.2 |
| 3 | 10 | Hunter Eaton | Charlevoix | 2.6 |
| 4 | 12 | Owen Read | Traverse City St. Francis | 4.9 |
| 5 | 12 | Robby Myler | Traverse City St. Francis | 5.6 |
| 6 | 10 | Ryder Hopkins | Charlevoix | 5.9 |
| 7 | 11 | Matthew Solomon | Charlevoix | 6.9 |
| 8 | 12 | Riley Pattinson | Traverse City St. Francis | 8.1 |
| 9 | 12 | Joseph Carlson | Traverse City St. Francis | 8.4 |
| 10 | 11 | Qwynn Darnell | Elk Rapids | 10.1 |
| 11 | 12 | Lewis Walter | Traverse City St. Francis | 10.9 |
| 12 | 10 | Connor Schmidt | Clare | 12.6 |
| 13 | 12 | David Dhaseleer | Charlevoix | 13.2 |
| 14 | 12 | Anthony Cole | Roscommon | 14.2 |
| 15 | 10 | Isaac Dionne | Boyne City | 14.8 |
| 16 | 12 | Tristan Demlow | Grayling | 19.0 |
| 17 | 9 | Owen McGlone | Kalkaska | 19.1 |
| 18 | 10 | Jake Klemmer | Roscommon | 19.9 |
| 19 | 10 | Finn Parish | Boyne City | 20.9 |
| 20 | 10 | Sutton Klaus | Clare | 21.1 |
| 21 | 11 | Coltrane Paryani | Kalkaska | 21.3 |
| 22 | 12 | Caidan Gaskill | Clare | 23.7 |
| 23 | 9 | William (Liam) Mahaffy | Grayling | 25.0 |
| 24 | 11 | Neiko Ketchum | Clare | 25.1 |
| 25 | 11 | Clayton Peacock | Clare | 25.3 |
| 26 | 10 | Christian Villa-Bilton | Clare | 26.1 |
| 27 | 11 | Carson Kiefer | Cheboygan | 27.7 |
| 28 | 11 | Gage Spencer | Beaverton | 28.5 |
| 29 | 11 | Jacob Veurink | Charlevoix | 29.5 |
| 30 | 10 | Eli Williamson | Standish-Sterling | 30.8 |
Region 20
What’s the Battle?
Three teams vying for the win. A projected 16 point separate Reed City, Hart, and Benzie Central. The Pirates will come with depth, hoping to displace both the Huskies and ‘Yotes. Of course, Benzie will be at home, using course knowledge to their advantage. And with the reliable Gus Rohde up front, Reed City only has to score four. At Bluejay, the trio came together for one matchup, Hart scoring considerably less than the other two. But you must take into account that depth is a greater advantage in larger fields.
Team
| Projected Place | Team | Avg. Score | Avg. Place | Win % | Qualify % | State Rank |
| 1 | Hart | 60 | 1.3 | 70 | 95+ | 16 |
| 2 | Reed City | 66 | 2.0 | 22 | 95+ | 15 |
| 3 | Benzie Central | 76 | 2.7 | 8 | 95+ | 21 |
| 4 | Lake City | 106 | 4.0 | 27 | ||
| 5 | Leroy Pine River | 179 | 5.5 | 55 | ||
| 6 | Manton | 182 | 5.6 | 52 | ||
| 7 | Manistee | 215 | 7.0 | 67 | ||
| 8 | Kingsley | 244 | 8.5 | 75 | ||
| 9 | Remus Chippewa Hills | 262 | 9.6 | 81 | ||
| 10 | Hesperia | 269 | 10.0 | 82 | ||
| 11 | Shelby | 270 | 10.1 | 83 | ||
| 12 | McBain | 303 | 12.2 | 91 | ||
| 13 | Morley-Stanwood | 314 | 12.8 | 95 | ||
| 14 | Mason County Central | 332 | 13.7 | 103 |
Individual
| Place | Grade | Name | Team | Avg. Place |
| 1 | 12 | August Rohde | Reed City | 1.0 |
| 2 | 11 | Robert Dykhouse | Manton | 2.1 |
| 3 | 11 | Jackson Schaub | Benzie Central | 4.2 |
| 4 | 10 | Cooper Tiffany | Lakeview | 4.9 |
| 5 | 9 | Eli Vanpoortfliet | Benzie Central | 5.3 |
| 6 | 11 | Caiden Helsel | Lake City | 6.0 |
| 7 | 9 | Silas Ackley | Hart | 6.5 |
| 8 | 11 | Paul Saladin | Reed City | 8.0 |
| 9 | 12 | Jacob Simon | Remus Chippewa Hills | 9.0 |
| 10 | 11 | Jack Slotman | Hart | 13.1 |
| 11 | 11 | Connor Helsel | Lake City | 13.9 |
| 12 | 9 | Tanner Dozier | Reed City | 14.1 |
| 13 | 10 | Aiden Schaner | Hart | 14.4 |
| 14 | 9 | Abraham Kiaunis | Reed City | 15.3 |
| 15 | 10 | Pascal Miller | Hart | 15.5 |
| 16 | 9 | Grant Ackley | Hart | 16.8 |
| 17 | 10 | Nathan Lenington | Leroy Pine River | 20.1 |
| 18 | 10 | Mason Opalewski | Hart | 20.6 |
| 19 | 12 | Benjamin Deridder | Benzie Central | 20.6 |
| 20 | 11 | Wyatt Vanpoortfliet | Benzie Central | 21.4 |
| 21 | 11 | Owen Butkovich | Lake City | 22.0 |
| 22 | 10 | Carson Ackley | Hart | 22.8 |
| 23 | 11 | Ethan Baker | Leroy Pine River | 23.9 |
| 24 | 9 | Tristan Hernandez | Kingsley | 25.3 |
| 25 | 11 | Kaden Worch | Manistee | 25.8 |
| 26 | 10 | Braydn Winkel | McBain | 26.0 |
| 27 | 11 | Iziquiel Picon | Shelby | 27.4 |
| 28 | 12 | Christian Schramski | Manistee | 28.0 |
| 29 | 11 | Jack Helsel | Manton | 29.7 |
| 30 | 11 | Kyle Vincent | Benzie Central | 30.3 |
Region 21
What’s the Battle?
A rare scenario here where three teams will vie for one spot. Holland Black River, The Potter’s House, and Montague come in closely for the third qualifying place. Black River has been in the driver’s seat all year, Potter’s House is closing fast, especially helped by the progressions of Edward Mugisha and Reed Osterink.
Team
| Projected Place | Team | Avg. Score | Avg. Place | Win % | Qualify % | State Rank |
| 1 | Grand Rapids Covenant Christian | 49 | 1.0 | 95+ | 95+ | 7 |
| 2 | Muskegon Western Michigan Christian | 73 | 2.0 | 95+ | 12 | |
| 3 | Holland Black River | 101 | 3.4 | 62 | 20 | |
| 4 | The Potter’s House | 110 | 4.3 | 18 | 22 | |
| 5 | Montague | 110 | 4.2 | 20 | 23 | |
| 6 | Olivet | 199 | 6.2 | 41 | ||
| 7 | Saranac | 219 | 7.0 | 51 | ||
| 8 | Grand Rapids NorthPointe Christian | 248 | 8.5 | 59 | ||
| 9 | Parchment | 260 | 9.3 | 63 | ||
| 10 | Kent City | 268 | 9.9 | 64 | ||
| 11 | Newaygo | 279 | 10.8 | 73 | ||
| 12 | Grandville Calvin Christian | 291 | 11.3 | 72 | ||
| 13 | Delton-Kellogg | 351 | 13.6 | 90 | ||
| 14 | North Muskegon | 351 | 13.6 | 96 | ||
| 15 | Ravenna | 376 | 14.9 | 101 |
Individual
| Place | Grade | Name | Team | Avg. Place |
| 1 | 12 | Levi Kamps | Grand Rapids Covenant Christian | 1.3 |
| 2 | 12 | Matthias Morse | Muskegon Western Michigan Christian | 1.7 |
| 3 | 11 | Edward Mugisha | The Potter’s House | 3.5 |
| 4 | 10 | Jonas Ballard | Holland Black River | 3.9 |
| 5 | 10 | Micah Kuiper | Grand Rapids Covenant Christian | 6.2 |
| 6 | 10 | Barrett Nance | North Muskegon | 6.6 |
| 7 | 10 | David Castrejon | Newaygo | 7.5 |
| 8 | 12 | Luke Dykstra | Grand Rapids Covenant Christian | 9.9 |
| 9 | 9 | Nolan Kessler | Montague | 10.3 |
| 10 | 12 | Tyler N. Kooienga | Grand Rapids Covenant Christian | 10.8 |
| 11 | 12 | Isaac Edgington | Holland Black River | 11.4 |
| 12 | 11 | Noah Raeth | Montague | 11.4 |
| 13 | 9 | Casper Banner | Holland Black River | 14.3 |
| 14 | 10 | Caleb Swiney | The Potter’s House | 14.5 |
| 15 | 10 | Owen Sytsema | Muskegon Western Michigan Christian | 15.3 |
| 16 | 12 | Elliot Cole | Parchment | 16.8 |
| 17 | 12 | Alexander Lawrence | Muskegon Western Michigan Christian | 17.4 |
| 18 | 12 | Alix Draves | Montague | 17.8 |
| 19 | 11 | Reuben Anderson | Muskegon Western Michigan Christian | 19.0 |
| 20 | 10 | Josiah Scholma | Muskegon Western Michigan Christian | 20.5 |
| 21 | 10 | Levi Schimmel | Grand Rapids Covenant Christian | 22.2 |
| 22 | 11 | Kaden Mingerink | Grand Rapids Covenant Christian | 25.3 |
| 23 | 11 | Isaac Struck-Vanderhaak | The Potter’s House | 26.1 |
| 24 | 11 | Isaac Johnson | Holland Black River | 26.5 |
| 25 | 10 | Easton McCloy | Grand Rapids NorthPointe Christian | 27.2 |
| 26 | 11 | Brandon McCullough | Kent City | 28.0 |
| 27 | 11 | Max McDowell | Olivet | 28.4 |
| 28 | 12 | Reed Osterink | The Potter’s House | 29.1 |
| 29 | 11 | Isaac Westra | Grand Rapids Covenant Christian | 29.4 |
| 30 | 12 | Bucky Aney | Montague | 29.8 |
Region 22
What’s the Battle?
Will Daniel Mandujano complete the process? In three years, he’s gone from 13th to 5th to now holding the fastest time of any Region 22 boy. He’s been in the low-16’s for the past month, racing to a 2nd place finish in the SAC and I believe, a school record. The contender that may give him trouble is Ben Gautsche, who hit a 16:27 at Stockbridge and a 16:21 this past week.
Team
| Projected Place | Team | Avg. Score | Avg. Place | Win % | Qualify % | State Rank |
| 1 | Saugatuck | 38 | 1.0 | 95+ | 95+ | 4 |
| 2 | Buchanan | 62 | 2.0 | 95+ | 11 | |
| 3 | Union City | 83 | 3.0 | 95+ | 19 | |
| 4 | Schoolcraft | 147 | 4.1 | 35 | ||
| 5 | Watervliet | 180 | 5.9 | 48 | ||
| 6 | Centreville | 181 | 6.3 | 54 | ||
| 7 | Hartford | 190 | 6.8 | 53 | ||
| 8 | Bangor | 206 | 8.4 | 61 | ||
| 9 | Constantine | 209 | 8.5 | 60 | ||
| 10 | Galesburg-Augusta | 216 | 9.0 | 62 | ||
| 11 | Bloomingdale | 259 | 11.0 | 78 | ||
| 12 | Coloma | 327 | 12.0 | 98 | ||
| 13 | Fennville | 388 | 13.0 | 112 | ||
| 14 | Comstock | 420 | 14.0 | 115 |
Individual
| Place | Grade | Name | Team | Avg. Place |
| 1 | 12 | Daniel Mandujano | Watervliet | 1.2 |
| 2 | 11 | Ben Gautsche | Union City | 2.7 |
| 3 | 9 | Jackson Bowman | Saugatuck | 4.8 |
| 4 | 11 | Liam McBeth | Buchanan | 5.4 |
| 5 | 10 | Grant Rehkopf | Saugatuck | 6.5 |
| 6 | 10 | Sawyer Monroe | Saugatuck | 6.5 |
| 7 | 12 | Dante Pillot | Schoolcraft | 7.0 |
| 8 | 10 | Marcus Silva | Saugatuck | 8.8 |
| 9 | 11 | Jack Sherwood | Buchanan | 9.1 |
| 10 | 12 | Jason Shoop | Union City | 10.7 |
| 11 | 10 | John Keser | Buchanan | 12.1 |
| 12 | 11 | Sammy Gamboa | Saugatuck | 12.1 |
| 13 | 12 | Landen Bouchard | Galesburg-Augusta | 13.5 |
| 14 | 11 | Alessandro Avila | Constantine | 14.0 |
| 15 | 11 | Jacob Kuntz | Buchanan | 15.5 |
| 16 | 0 | Will Hulin | Centreville | 15.7 |
| 17 | 10 | Aiden Mcdonald | Hartford | 16.3 |
| 18 | 12 | Carlos Ruiz | Hartford | 19.7 |
| 19 | 12 | Coy Weinberg | Buchanan | 20.3 |
| 20 | 12 | Carter Stevens | Galesburg-Augusta | 20.7 |
| 21 | 12 | Cohen Burdick | Union City | 21.6 |
| 22 | 9 | Ira Brown | Saugatuck | 22.1 |
| 23 | 12 | Robbie King | Constantine | 22.9 |
| 24 | 12 | Malachi Payne | Union City | 24.5 |
| 25 | 9 | Ashton Skinner | Saugatuck | 26.0 |
| 26 | 12 | Tyler Caruso | Bangor | 26.4 |
| 27 | 12 | Zack Mitchell | Kalamazoo Christian | 27.8 |
| 28 | 10 | Cullen Decker | Union City | 28.1 |
| 29 | 10 | Josaias Robles | Hartford | 30.2 |
| 30 | 10 | Noah June | Union City | 31.2 |
Region 23
What’s the Battle?
The top end talent in Region 23 is absurd. Mitchell Hiatt would be the heavy favorite in pretty much every region, but here, the odds are a bit tighter. The top-4 seeds in terms of time have gone under 16:00, by my estimation, there are 5 legitimate contenders for top-10 spots at MIS. Hiatt is increasingly looking like a candidate to take it all, but if he has a subpar race here, any of Caleb Blonde, Ziggy Dinverno, Leo Swager, or Landen Boulis could swoop in for the win.
Team
| Projected Place | Team | Avg. Score | Avg. Place | Win % | Qualify % | State Rank |
| 1 | Jackson Lumen Christi | 38 | 1.0 | 95+ | 95+ | 2 |
| 2 | Hanover-Horton | 63 | 2.0 | 95+ | 6 | |
| 3 | Jonesville | 84 | 3.0 | 95+ | 14 | |
| 4 | Onsted | 130 | 4.1 | 30 | ||
| 5 | Brooklyn Columbia Central | 145 | 4.9 | 31 | ||
| 6 | Sand Creek | 191 | 6.1 | 50 | ||
| 7 | Homer | 219 | 7.7 | 68 | ||
| 8 | Bronson | 220 | 7.6 | 70 | ||
| 9 | Napoleon | 246 | 9.7 | 79 | ||
| 10 | Quincy | 247 | 9.7 | 76 | ||
| 11 | Hillsdale | 254 | 10.2 | 84 | ||
| 12 | Hudson | 304 | 12.0 | 99 | ||
| 13 | Springport | 352 | 13.0 | 111 | ||
| 14 | Michigan Center | 400 | 14.0 | 116 |
Individual
| Place | Grade | Name | Team | Avg. Place |
| 1 | 12 | Mitchell Hiatt | Onsted | 1.6 |
| 2 | 12 | Isaiah Dinverno | Jackson Lumen Christi | 2.0 |
| 3 | 12 | Landen Boulis | Hanover-Horton | 4.0 |
| 4 | 12 | Leo Swager | Jackson Lumen Christi | 4.0 |
| 5 | 10 | Caleb Blonde | Jonesville | 4.1 |
| 6 | 11 | Gibson Shore | Jackson Lumen Christi | 6.9 |
| 7 | 10 | Cooper Flick | Hanover-Horton | 7.1 |
| 8 | 11 | Nicholas Fowler | Jonesville | 7.8 |
| 9 | 10 | Logan Youngman | Hillsdale | 8.5 |
| 10 | 10 | Rocky Bolton | Jackson Lumen Christi | 11.0 |
| 11 | 11 | John Edler | Homer | 11.2 |
| 12 | 10 | Avery Morrow | Jackson Lumen Christi | 14.4 |
| 13 | 10 | Silas Daniels | Sand Creek | 15.6 |
| 14 | 12 | James Bayes | Onsted | 15.9 |
| 15 | 10 | Chad Tyson | Hanover-Horton | 16.0 |
| 16 | 10 | Collin Fucile | Jonesville | 16.9 |
| 17 | 11 | Zach Hassenzahl | Hanover-Horton | 17.9 |
| 18 | 12 | Isaac St. John | Hudson | 20.5 |
| 19 | 10 | Ethan Huff | Homer | 21.4 |
| 20 | 9 | Wyatt Hassenzahl | Hanover-Horton | 21.7 |
| 21 | 9 | Chris Durfey | Onsted | 21.7 |
| 22 | 11 | Wyatt Vowell | Brooklyn Columbia Central | 21.8 |
| 23 | 12 | Jack Gorton | Brooklyn Columbia Central | 22.0 |
| 24 | 9 | Ashton Potwin | Jonesville | 22.1 |
| 25 | 9 | Clint Couchman | Brooklyn Columbia Central | 24.7 |
| 26 | 9 | Tyler Harris | Hanover-Horton | 26.4 |
| 27 | 9 | Carson Beach | Hanover-Horton | 27.5 |
| 28 | 11 | Karl Swager | Jackson Lumen Christi | 28.9 |
| 29 | 11 | Peter Soltis | Jackson Lumen Christi | 28.9 |
| 30 | 11 | Nate Ostrosky | Brooklyn Columbia Central | 30.8 |
Region 24
What’s the Battle?
Depth vs. top end speed. Stanton Central Montcalm is extremely strong through three, even extending to four. Pewamo-Westphalia claims the ability to find seven runners under 18:00. At a larger meet, it’s likely the Pirates. A condensed field at the regional level, Central Montcalm’s odds improve.
Team
| Projected Place | Team | Avg. Score | Avg. Place | Win % | Qualify % | State Rank |
| 1 | Pewamo-Westphalia | 48 | 1.2 | 81 | 95+ | 5 |
| 2 | Stanton Central Montcalm | 53 | 1.8 | 19 | 95+ | 9 |
| 3 | Bath | 83 | 3.0 | 95+ | 17 | |
| 4 | Ovid-Elsie | 133 | 4.6 | 36 | ||
| 5 | Laingsburg | 134 | 4.7 | 39 | ||
| 6 | Otisville LakeVille | 144 | 5.7 | 44 | ||
| 7 | Montrose | 181 | 7.6 | 65 | ||
| 8 | Chesaning | 183 | 7.6 | 66 | ||
| 9 | New Lothrop | 201 | 8.9 | 74 | ||
| 10 | Perry | 252 | 10.0 | 93 | ||
| 11 | Mt Morris | 346 | 11.0 | 119 |
Individual
| Place | Grade | Name | Team | Avg. Place |
| 1 | 11 | Gage Hoffman | Stanton Central Montcalm | 1.0 |
| 2 | 11 | Noah Devereaux | Laingsburg | 2.9 |
| 3 | 11 | Tyler Leach | Otisville LakeVille | 3.0 |
| 4 | 9 | Owen Poppema | Bath | 3.5 |
| 5 | 11 | Sylus Wilson | Stanton Central Montcalm | 6.3 |
| 6 | 10 | John Kowatch | Pewamo-Westphalia | 6.7 |
| 7 | 11 | Kyler Fertig | Stanton Central Montcalm | 7.5 |
| 8 | 12 | Allan George | Pewamo-Westphalia | 8.0 |
| 9 | 10 | Wyatt Werner | Pewamo-Westphalia | 9.1 |
| 10 | 10 | Charlie George | Pewamo-Westphalia | 10.4 |
| 11 | 12 | Clay Powell | Ovid-Elsie | 11.4 |
| 12 | 9 | Wyatt Roberts | Otisville LakeVille | 12.6 |
| 13 | 9 | Tate Smith | Bath | 13.0 |
| 14 | 9 | Johnny Coston | Stanton Central Montcalm | 13.6 |
| 15 | 10 | River Fox | Bath | 14.8 |
| 16 | 10 | Nolan Mitchell | Pewamo-Westphalia | 15.2 |
| 17 | 12 | Jason Weber | Pewamo-Westphalia | 19.5 |
| 18 | 12 | Connor Kennedy | Otisville LakeVille | 19.5 |
| 19 | 12 | Lieu Vincke | New Lothrop | 21.7 |
| 20 | 12 | Luke Skidmore | Bath | 21.7 |
| 21 | 12 | Sam Muirhead | Pewamo-Westphalia | 22.1 |
| 22 | 11 | Joshua Miller | Ovid-Elsie | 23.5 |
| 23 | 9 | Eli Hobson | Montrose | 23.9 |
| 24 | 12 | Felix Ramirez | Laingsburg | 24.3 |
| 25 | 12 | James Kelly | Ovid-Elsie | 24.6 |
| 26 | 11 | Evan Rolston | Stanton Central Montcalm | 24.7 |
| 27 | 10 | Jaxon Hemgesberg | Chesaning | 25.2 |
| 28 | 11 | Cole Maier | Chesaning | 25.7 |
| 29 | 9 | Austin Hodges | Laingsburg | 29.1 |
| 30 | 9 | Mario Baker | Bath | 31.9 |
Region 25
What’s the Battle?
St. Louis vs. the projections. Every year during championship time, those Sharks outperform the numbers. They’ve moved into the three spot here, so I’m safe with regard to qualifying. Absolutely no one will be surprised if they score considerably less than projected.
Team
| Projected Place | Team | Avg. Score | Avg. Place | Win % | Qualify % | State Rank |
| 1 | Ithaca | 38 | 1.0 | 95+ | 95+ | 3 |
| 2 | Sanford-Meridian | 88 | 2.3 | 95+ | 26 | |
| 3 | St. Louis | 92 | 2.7 | 95+ | 28 | |
| 4 | Pigeon-Laker | 112 | 4.5 | 34 | ||
| 5 | Midland Bullock Creek | 113 | 4.8 | 37 | ||
| 6 | Reese | 123 | 5.7 | 42 | ||
| 7 | Cass City | 221 | 7.5 | 94 | ||
| 8 | Carrollton | 236 | 8.1 | 102 | ||
| 9 | Millington | 237 | 8.4 | 106 | ||
| 10 | Hemlock | 266 | 10.0 | 109 | ||
| 11 | Saginaw Valley Lutheran | 287 | 11.0 | 110 | ||
| 12 | Vassar | 308 | 12.0 | 114 |
Individual
| Place | Grade | Name | Team | Avg. Place |
| 1 | 11 | Landen Styka | Ithaca | 1.1 |
| 2 | 12 | Landon Pestrue | St. Louis | 2.5 |
| 3 | 12 | Miingen Bertrand | Ithaca | 3.0 |
| 4 | 12 | Tyler Heal | Sanford-Meridian | 4.1 |
| 5 | 10 | Luke Herron | Caro | 6.0 |
| 6 | 11 | Jayden Fox | Saginaw Valley Lutheran | 6.2 |
| 7 | 10 | Marshall Brandt | Midland Bullock Creek | 7.3 |
| 8 | 12 | Brayden Sweeney | Midland Bullock Creek | 7.7 |
| 9 | 11 | Jacob Mankey | Ithaca | 9.6 |
| 10 | 12 | Cade Truemner | Pigeon-Laker | 11.1 |
| 11 | 10 | Evan Olson | Pigeon-Laker | 11.9 |
| 12 | 10 | Evan MacLaren | Ithaca | 13.3 |
| 13 | 11 | Alex Rodriguez | St. Louis | 13.8 |
| 14 | 12 | Colin Kuhn | St. Louis | 13.9 |
| 15 | 11 | Thad Whitmore | Ithaca | 14.8 |
| 16 | 9 | Remyngton Clish | Sanford-Meridian | 16.3 |
| 17 | 10 | Xander Huckins | Reese | 18.3 |
| 18 | 12 | Brent DeSaegher | Ithaca | 18.4 |
| 19 | 11 | Wesley Haines | Reese | 18.7 |
| 20 | 11 | Logan Brawt | Sanford-Meridian | 19.9 |
| 21 | 9 | Christopher Shemes | Ithaca | 21.4 |
| 22 | 9 | Kale Miklovic | Pigeon-Laker | 22.4 |
| 23 | 11 | Hayden Shattuck | St. Louis | 23.2 |
| 24 | 11 | James Schroder | Sanford-Meridian | 23.7 |
| 25 | 12 | Jacob Moore | Caro | 24.0 |
| 26 | 10 | Sebastian Seifferlein | Sandusky | 25.7 |
| 27 | 10 | Mayson McIntosh | Caro | 26.0 |
| 28 | 12 | Nathaniel Seney | Reese | 29.2 |
| 29 | 10 | Henry Haag | Pigeon-Laker | 29.5 |
| 30 | 10 | Connor Czolgosz | Midland Bullock Creek | 29.7 |
Region 26
What’s the Battle?
Noel Lorenzen in his quest to be the best D3 freshman. He’s passed the test thus far, ripping it on fast courses such as Whitmore Lake, double hills at Possum Hollow, and in the heat at Holly. This weekend at Columbus County Park, the latter two characteristics will be present.
Team
| Projected Place | Team | Avg. Score | Avg. Place | Win % | Qualify % | State Rank |
| 1 | Lansing Catholic | 33 | 1.0 | 95+ | 95+ | 8 |
| 2 | Leslie | 74 | 2.1 | 95+ | 18 | |
| 3 | Ann Arbor Greenhills | 90 | 3.0 | 89 | 24 | |
| 4 | Rochester Hills Lutheran NW | 109 | 3.9 | 11 | 33 | |
| 5 | Algonac | 153 | 5.2 | 49 | ||
| 6 | Almont | 165 | 5.8 | 56 | ||
| 7 | Clawson | 254 | 8.3 | 86 | ||
| 8 | Madison Heights Bishop Foley | 254 | 8.5 | 88 | ||
| 9 | Stockbridge | 258 | 8.9 | 87 | ||
| 10 | University Liggett | 267 | 9.7 | 92 | ||
| 11 | Charyl Stockwell Academy | 268 | 9.7 | 97 | ||
| 12 | Marine City | 301 | 11.9 | 104 | ||
| 13 | New Haven | 347 | 13.0 | 113 | ||
| 14 | Communication Media Arts | 418 | 14.0 | 118 |
Individual
| Place | Grade | Name | Team | Avg. Place |
| 1 | 9 | Nole Lorenzen | Rochester Hills Lutheran NW | 1.2 |
| 2 | 11 | Lucas Gates | Lansing Catholic | 2.3 |
| 3 | 10 | Kenneth Mangles | Leslie | 5.2 |
| 4 | 10 | William Gancer | Stockbridge | 5.3 |
| 5 | 10 | Everett Beach | Lansing Catholic | 5.5 |
| 6 | 11 | Julian Walker | Algonac | 6.6 |
| 7 | 9 | Grady Richey | Lansing Catholic | 6.7 |
| 8 | 10 | Téo Krumm | Lansing Catholic | 8.3 |
| 9 | 9 | Jack Songer | Rochester Hills Lutheran NW | 8.3 |
| 10 | 11 | Owen Beindit | Algonac | 12.3 |
| 11 | 12 | Joseph Treadwell | Lansing Catholic | 12.6 |
| 12 | 10 | Finn Korte | Lansing Catholic | 12.8 |
| 13 | 11 | Henry Beck | Ann Arbor Greenhills | 14.7 |
| 14 | 12 | Jose Domecq | Leslie | 15.9 |
| 15 | 11 | Nico Aagesen | Ann Arbor Greenhills | 15.9 |
| 16 | 12 | Mason Stranahan | Ann Arbor Greenhills | 16.6 |
| 17 | 9 | Carson Potter | Lansing Catholic | 16.9 |
| 18 | 10 | Matthew Killeen | Leslie | 16.9 |
| 19 | 10 | Cooper Schmelter | Leslie | 17.5 |
| 20 | 9 | Oscar Wordell | Rochester Hills Lutheran NW | 18.4 |
| 21 | 11 | Grason Weber | Leslie | 20.7 |
| 22 | 10 | Naveen Kulkarni | Ann Arbor Greenhills | 21.3 |
| 23 | 11 | Parth Ashok | Ann Arbor Greenhills | 21.5 |
| 24 | 12 | Kyan Isham | Leslie | 24.3 |
| 25 | 11 | Adam SaintOnge | Almont | 25.4 |
| 26 | 10 | Colton Grzyb | Almont | 25.6 |
| 27 | 10 | Owen Windgaston | Clawson | 28.9 |
| 28 | 11 | Earl Beattie | Marine City | 30.0 |
| 29 | 12 | Gavin Campbell | Almont | 30.2 |
| 30 | 11 | Dylan Hile | Leslie | 30.2 |
Region 27
What’s the Battle?
Flat Rock’s assault on the finish line. The Rams have a very real possibility of their first three crossing the line in succession. Jacob Stanislawski, Nathan Vargo, and Lucas Taraszkiewicz own the fastest three times in the region and the fastest three ratings. A good formula and starting point for regional domination.
Team
| Projected Place | Team | Avg. Score | Avg. Place | Win % | Qualify % | State Rank |
| 1 | Flat Rock | 50 | 1.1 | 95+ | 95+ | 13 |
| 2 | Erie Mason | 73 | 2.0 | 5 | 95+ | 25 |
| 3 | Blissfield | 106 | 3.1 | 90 | 32 | |
| 4 | Grass Lake | 125 | 4.9 | 6 | 40 | |
| 5 | Monroe Jefferson | 127 | 5.0 | 38 | ||
| 6 | Clinton | 141 | 6.4 | 45 | ||
| 7 | Adrian Madison | 144 | 6.7 | 43 | ||
| 8 | Monroe St. Mary CC | 146 | 7.0 | 47 | ||
| 9 | Ottawa Lake-Whiteford | 230 | 9.0 | 85 | ||
| 10 | Ida | 257 | 10.0 | 105 | ||
| 11 | Detroit Northwestern | 335 | 11.0 | 117 |
Individual
| Place | Grade | Name | Team | Avg. Place |
| 1 | 11 | Jacob Stanislawski | Flat Rock | 1.4 |
| 2 | 12 | Nathan Vargo | Flat Rock | 2.7 |
| 3 | 11 | Lucas Taraszkiewicz | Flat Rock | 3.8 |
| 4 | 9 | Christian Craanen | Monroe St. Mary CC | 3.9 |
| 5 | 11 | Trenton Fetter | Adrian Madison | 4.8 |
| 6 | 12 | Austin Sulier | Erie Mason | 5.8 |
| 7 | 12 | Ian Waddell | Blissfield | 6.0 |
| 8 | 12 | Gabe Manchester | Clinton | 8.2 |
| 9 | 12 | Parker Campbell | Erie Mason | 8.9 |
| 10 | 11 | Luke Masserant | Monroe Jefferson | 10.9 |
| 11 | 12 | Andrew Hintz | Monroe Jefferson | 13.5 |
| 12 | 11 | Luke Stanley | Ida | 14.1 |
| 13 | 11 | Connor Sherwood | Grass Lake | 14.3 |
| 14 | 9 | Phineas Totten | Monroe St. Mary CC | 14.7 |
| 15 | 9 | Michael Weidmayer | Blissfield | 15.2 |
| 16 | 9 | Noah Sills | Blissfield | 15.9 |
| 17 | 10 | Joseph Colaluca | Erie Mason | 17.1 |
| 18 | 12 | Adam Brodie | Flat Rock | 18.0 |
| 19 | 12 | Eric Ramsey | Clinton | 20.4 |
| 20 | 11 | Paul McClure | Adrian Madison | 21.8 |
| 21 | 9 | Weston Albright | Erie Mason | 22.9 |
| 22 | 10 | Connor Boteler | Grass Lake | 24.0 |
| 23 | 9 | Brayden Brodie | Flat Rock | 24.9 |
| 24 | 9 | Caleb Healey | Erie Mason | 26.0 |
| 25 | 11 | Jackson Carner | Erie Mason | 26.0 |
| 26 | 11 | Alex Holda | Grass Lake | 28.9 |
| 27 | 12 | Kevin Roberts | Ypsilanti Arbor Preparatory | 29.2 |
| 28 | 11 | Emmet Van Cleave | Grass Lake | 29.3 |
| 29 | 10 | Zack Buttigieg | Grass Lake | 30.3 |
| 30 | 10 | Austin Strand | Clinton | 30.7 |