The Best Crews have been a thing around here for the past few years. They take their cues from USTFCCCA’s event squads and the World Athletics scoring system, combining the two ideas in order to compare Michigan’s teams against events in their common areas.
The goal of this is to help recognize the athletes and coaches that create cultures, history, and traditions in their respective event areas. Think about it like this: Minnesota always has great hockey, basketball hoops are nailed to Indiana barns, Texas churns out football talent, every Iowa boy has cauliflower ear. Where in Michigan does hurdling reign supreme? Is there a town where kids learn to shot put before they can tie their shoes?
2023’s explanation goes through much of it, but two things have changed for 2025 (and now, 2026).
the Boys 200m points have been re-mathed and edited, as previous versions sold short athletes such as Jeremy Dixon and Jake Machiniak when it came to season end rankings.
instead of using a team’s top-four athletes to generate their total for an event, I’m using their top-three. Belleville’s hurdlers are the main reason for this, there’s no way they shouldn’t have been the top D1 squad in 2024. I feel this will better portray a team’s top athletes.
Here are the figures that show the points for each mark:
Very simply, one had to have hit a regional qualifier to earn points. If a team had three regional qualifiers, all three earn points. And so on with two and one. For these sprint crews, the 100m, 200m, 400m, 4×1, 4×2, and 4×4 are all included. That’s a full list of events and these celebrate the teams that excelled in ALL.
As each relay team gets a regional entry, these are extrapolations based on the individual RQ’s (from 2025, I didn’t even think I’d be doing these best crews for 2026).
Est. RQ
D1 Boys
D2 Boys
D3 Boys
D4 Boys
4×1
45.10
46.30
47.30
48.80
4×2
1:34.5
1:36.6
1:38.6
1:41.5
4×4
3:35.6
3:41.0
3:45.1
3:56.4
Est. RQ
D1 Girls
D2 Girls
D3 Girls
D4 Girls
4×1
52.50
54.20
55.50
57.50
4×2
1:52.8
1:54.8
1:57.6
2:04.4
4×4
4:20.0
4:31.1
4:39.4
4:51.8
Scroll to the bottom to see which programs have made the top-10 all four years.
Grade
Name
Event
Team
Mark
Points
4×2
East Kentwood
1:26.76
1121
4×4
East Kentwood
3:21.10
988
4×1
East Kentwood
41.76
985
10
De-Mani Roberts
400m
East Kentwood
47.31
514
10
De-Mani Roberts
200m
East Kentwood
21.18
500
10
De-Mani Roberts
100m
East Kentwood
10.63
463
12
Jhavon Alexander
100m
East Kentwood
10.64
462
12
Jhavon Alexander
200m
East Kentwood
21.88
437
12
Jhavon Alexander
400m
East Kentwood
49.92
421
10
Donovan Rubens
100m
East Kentwood
10.99
394
11
Jathan Rucker
200m
East Kentwood
22.38
393
12
Treyvon Tyler
100m
East Kentwood
11.02
388
11
Shukuru Makechi
200m
East Kentwood
22.44
387
11
Jathan Rucker
100m
East Kentwood
11.03
386
12
Myles Gesselman
400m
East Kentwood
51.09
380
11
Seth Strong
100m
East Kentwood
11.10
373
10
Donovan Rubens
200m
East Kentwood
22.62
371
12
Jacarvion Johnson
100m
East Kentwood
11.13
367
12
Jacarvion Johnson
200m
East Kentwood
22.78
357
12
Ethan Quibell
400m
East Kentwood
51.87
352
12
Devin Wroten
100m
East Kentwood
11.22
350
11
Lorenzo Reynolds
100m
East Kentwood
11.25
344
11
Bryce Barnes
200m
East Kentwood
23.00
337
11
Bryce Barnes
100m
East Kentwood
11.29
336
11
Lorenzo Reynolds
200m
East Kentwood
23.07
331
10
DeSharion Bass-Hughes
100m
East Kentwood
11.33
329
12
Levi Karsten
200m
East Kentwood
23.10
328
12
Treyvon Tyler
200m
East Kentwood
23.17
322
12
Devin Wroten
200m
East Kentwood
23.17
322
12
Malachi Daly
100m
East Kentwood
11.37
321
12
Reece Emeott
100m
East Kentwood
11.40
315
10
Austin Nelson
100m
East Kentwood
11.41
313
12
Abdul Aziz Ghriri
100m
East Kentwood
11.43
310
Rank
Team
100m
200m
400m
4×1
4×2
4×4
Total
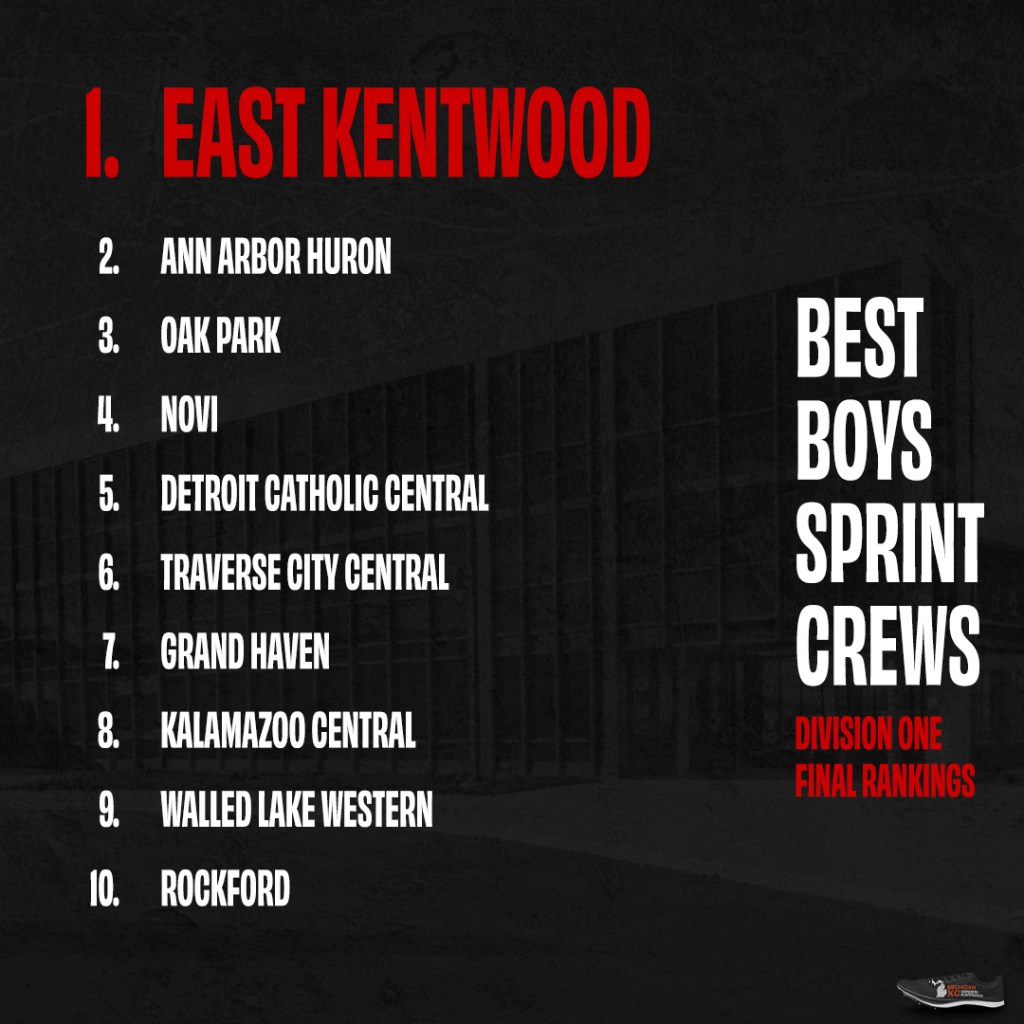
1
East Kentwood
1319
1330
1316
985
1121
988
7059
2
Ann Arbor Huron
1248
1277
1362
880
1060
1062
6890
3
Oak Park
1123
1230
1338
878
1068
1214
6851
4
Novi
1273
1268
1198
1023
961
985
6707
5
Detroit Catholic Central
1283
1281
1294
1034
989
812
6693
6
Traverse City Central
1223
1343
1193
819
960
975
6513
7
Grand Haven
1227
1235
1145
1028
1008
686
6329
8
Kalamazoo Central
1036
1112
1293
868
1005
978
6293
9
Walled Lake Western
1104
1225
903
864
1142
1043
6280
10
Rockford
1206
1101
1147
918
1040
844
6256
11
Grandville
1079
1103
1133
793
768
1012
5888
12
Detroit Renaissance
365
1216
1363
752
1052
1137
5885
13
Forest Hills Northern
1184
1202
748
955
982
758
5830
14
Saginaw Heritage
1319
1289
486
886
994
851
5825
15
Grand Ledge
1123
1066
815
983
937
877
5800
16
Grand Rapids Ottawa Hills
1209
1157
862
810
937
795
5771
17
Jenison
1086
1136
769
913
890
912
5706
18
Hudsonville
1102
1062
815
920
869
921
5688
19
Chippewa Valley
1138
1218
796
841
961
708
5663
20
Saline
319
1127
1247
587
1044
1020
5344
21
Utica Eisenhower
1208
1220
764
711
587
758
5247
22
Romeo
1111
1104
406
805
905
901
5233
23
Troy Athens
619
1086
866
719
921
958
5170
24
Zeeland West
661
743
1159
711
916
873
5063
25
Holt
673
798
829
828
1018
900
5045
26
Northville
665
671
1188
705
860
938
5027
27
Muskegon Reeths-Puffer
1138
1052
453
719
959
656
4978
28
Lake Orion
311
750
1214
836
946
904
4962
29
Macomb Dakota
740
1083
751
714
883
711
4882
30
Farmington
758
1200
–
887
1139
792
4777
31
Detroit Cass Tech
1094
719
716
732
843
641
4745
32
Troy
1015
704
713
678
861
752
4722
33
Ypsilanti Community
1088
771
767
588
815
634
4664
34
Walled Lake Central
683
1085
371
623
940
917
4618
35
Rochester Adams
1086
1145
–
766
870
685
4552
36
Midland
1136
787
353
700
693
880
4549
37
Temperance Bedford
319
691
1119
620
872
916
4536
38
Detroit U-D Jesuit
1109
323
758
757
727
858
4533
39
Clarkston
756
749
834
650
698
802
4489
40
East Lansing
1034
707
350
810
938
617
4457
41
Ann Arbor Pioneer
769
724
732
656
801
705
4387
42
Gibraltar Carlson
415
775
739
836
959
646
4371
43
Detroit Martin Luther King
1183
789
–
909
797
669
4346
44
Portage Northern
1088
1071
401
812
921
–
4293
45
Woodhaven Brownstown
1027
996
–
725
910
632
4290
46
Ann Arbor Skyline
440
404
1186
570
730
861
4192
47
Alpena
673
1010
413
573
706
812
4186
48
Detroit Mumford
369
686
738
654
619
898
3964
49
Grosse Pointe South
417
694
379
790
901
778
3959
50
Davison
742
378
420
695
887
794
3916
Grade
Name
Event
Team
Mark
Points
4×2
Oak Park
1:37.22
1286
4×4
Oak Park
3:49.13
1193
4×1
Oak Park
47.26
1094
11
Nevaeh Burns
400m
Oak Park
53.63
537
11
Nevaeh Burns
200m
Oak Park
24.29
486
9
Aubrey Douglas
200m
Oak Park
24.35
482
9
Aubrey Douglas
100m
Oak Park
11.84
480
10
Payton Gee
400m
Oak Park
56.93
460
9
Jordan McNeely
400m
Oak Park
57.42
449
9
Jordan McNeely
200m
Oak Park
24.91
448
10
Payton Gee
200m
Oak Park
25.03
441
11
Nevaeh Burns
100m
Oak Park
12.19
432
10
Payton Gee
100m
Oak Park
12.20
431
10
Brooke Pettway
400m
Oak Park
58.78
417
9
Sophie Menker
400m
Oak Park
58.82
416
9
Jordan McNeely
100m
Oak Park
12.31
416
12
Rhian Jeffries
400m
Oak Park
58.87
415
11
Leah Thomas
400m
Oak Park
58.89
415
11
Londyn James
400m
Oak Park
59.51
400
12
Mekhi Thompson
400m
Oak Park
59.52
400
9
Brooklyn Chandler
400m
Oak Park
59.67
397
11
Londyn James
100m
Oak Park
12.50
391
11
India Moultrie
100m
Oak Park
12.57
381
12
Jaida Wilson
200m
Oak Park
26.26
367
11
India Moultrie
200m
Oak Park
26.37
360
12
Jaida Wilson
100m
Oak Park
12.73
359
10
Kahlia Hart
100m
Oak Park
12.77
354
10
Brooke Pettway
200m
Oak Park
26.50
353
9
Melody Dukes
400m
Oak Park
62.47
331
9
Brooklyn Chandler
200m
Oak Park
26.99
323
9
Brooklyn Chandler
100m
Oak Park
13.06
315
Rank
Team
100m
200m
400m
4×1
4×2
4×4
Total
1
Oak Park
1343
1416
1446
1094
1286
1193
7778
2
Detroit Cass Tech
1284
1449
1403
1037
1166
969
7308
3
East Kentwood
1227
1153
1169
1064
1110
927
6650
4
East Lansing
1201
1277
979
928
1146
1033
6564
5
Rockford
1108
1133
1258
908
979
1058
6444
6
West Bloomfield
1289
1256
890
1144
940
857
6375
7
DeWitt
987
1089
1134
847
983
844
5884
8
Ann Arbor Pioneer
1188
1035
1114
749
841
849
5776
9
Woodhaven Brownstown
751
1065
1115
861
1012
954
5759
10
Saginaw Heritage
1147
1241
886
697
1044
589
5605
11
Lake Orion
364
1078
1255
892
1011
1003
5603
12
Holland West Ottawa
681
1024
1213
807
750
1022
5497
13
Bay City Western
1018
774
1115
720
949
881
5455
14
Detroit Renaissance
745
1133
836
777
1062
828
5381
15
Traverse City West
730
1045
1183
698
824
883
5363
16
Northville
651
1029
1212
602
905
898
5298
17
Grand Haven
1159
1121
401
846
982
734
5243
18
Romeo
732
779
844
898
1006
921
5181
19
Caledonia
1032
770
705
892
918
710
5028
20
Belleville
1049
1064
697
717
812
681
5018
21
Salem
1005
703
771
841
864
832
5016
22
Novi
1059
1113
367
911
732
786
4969
23
Traverse City Central
1022
1052
355
897
878
681
4884
24
Zeeland East
359
705
1201
812
805
995
4877
25
Kalamazoo Central
1008
703
740
879
899
604
4834
26
Grand Blanc
372
1047
1078
641
943
742
4823
27
Middleville Thornapple-Kellogg
359
701
1082
727
810
1007
4687
28
Troy Athens
1016
1006
407
634
780
656
4500
29
Rochester
755
418
813
601
983
890
4460
30
Battle Creek Lakeview
318
959
722
795
840
824
4457
31
Grand Rapids Ottawa Hills
750
1066
–
903
913
811
4443
32
Rochester Adams
734
663
728
816
740
738
4420
33
Saline
755
772
383
847
835
695
4288
34
Ypsilanti Lincoln
381
343
1184
820
795
735
4258
35
Forest Hills Northern
764
835
364
794
720
656
4132
36
Grand Ledge
353
726
749
875
688
723
4113
37
Ann Arbor Huron
735
442
1178
–
893
851
4100
38
Royal Oak
655
374
384
830
827
934
4005
39
Detroit Martin Luther King
753
1166
333
826
886
–
3964
40
Farmington
323
350
764
839
838
814
3928
41
Walled Lake Central
680
712
427
534
731
770
3855
42
Midland
423
762
358
579
728
972
3821
43
Hudsonville
320
980
357
686
877
556
3778
44
Ann Arbor Skyline
–
342
1242
516
680
986
3767
45
Byron Center
1008
740
380
816
812
–
3756
46
Portage Northern
1172
1189
453
902
–
–
3715
47
Canton
396
423
331
780
735
977
3642
48
Midland Dow
773
1132
778
–
–
931
3614
49
Wyoming
769
1068
–
897
861
–
3595
50
North Farmington
732
694
724
717
709
–
3576
Grade
Name
Event
Team
Mark
Points
4×2
Flint Powers Catholic
1:27.56
1053
4×4
Flint Powers Catholic
3:23.50
903
4×1
Flint Powers Catholic
42.31
884
12
Grant Roberts
200m
Flint Powers Catholic
21.63
460
12
Grant Roberts
100m
Flint Powers Catholic
10.77
436
11
Jayce Beauchamp
100m
Flint Powers Catholic
10.80
431
12
Grant Roberts
400m
Flint Powers Catholic
50.81
390
11
Jayce Beauchamp
200m
Flint Powers Catholic
22.67
367
10
Princeton Clack
100m
Flint Powers Catholic
11.18
358
10
Princeton Clack
200m
Flint Powers Catholic
22.85
350
10
Princeton Clack
400m
Flint Powers Catholic
52.01
347
11
Hudson Miller
100m
Flint Powers Catholic
11.41
313
9
Joseph Cecchini
400m
Flint Powers Catholic
52.99
312
11
Quentin Cokley
400m
Flint Powers Catholic
53.60
290
9
Joseph Cecchini
200m
Flint Powers Catholic
23.88
258
Rank
Team
100m
200m
400m
4×1
4×2
4×4
Total
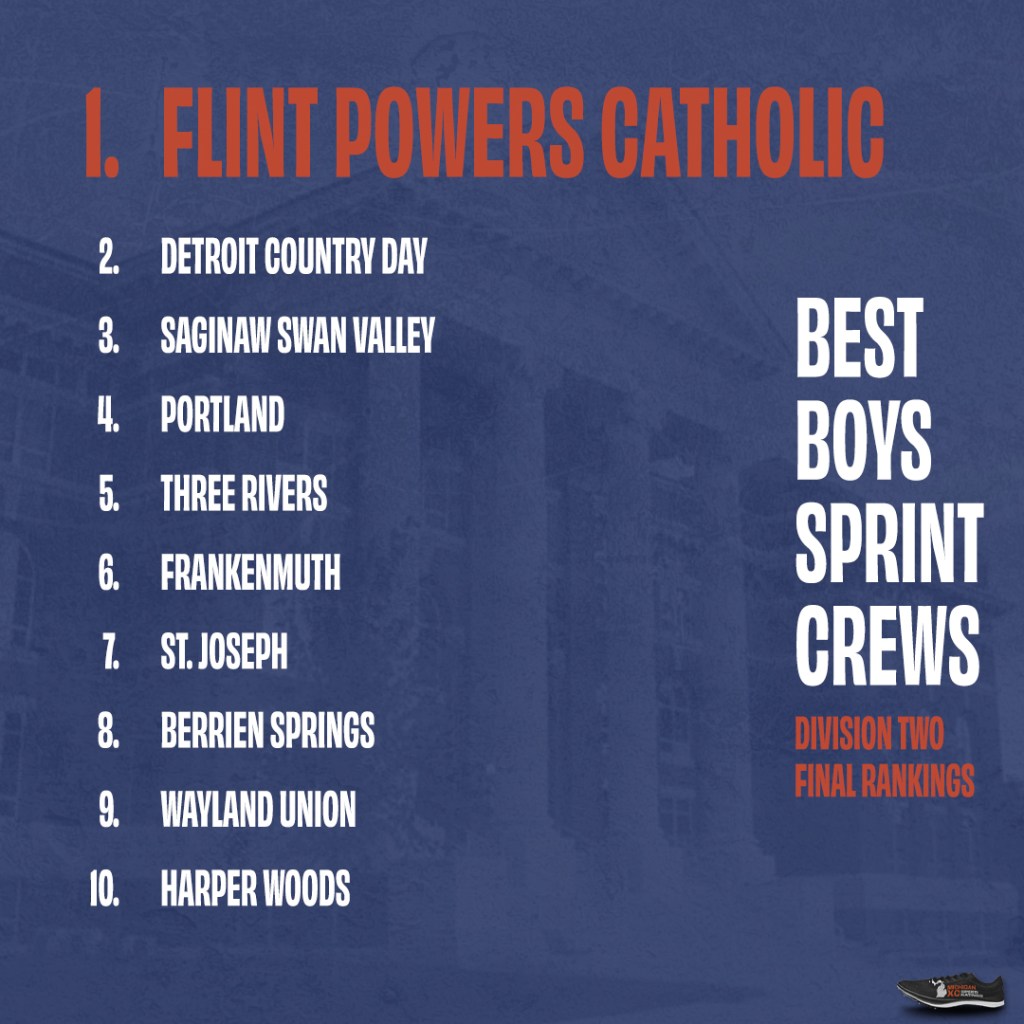
1
Flint Powers Catholic
1225
1177
1049
884
1053
903
6290
2
Detroit Country Day
1092
1056
1217
824
773
1012
5974
3
Saginaw Swan Valley
1171
1066
1121
854
768
876
5854
4
Portland
1046
1045
1189
745
931
833
5788
5
Three Rivers
1123
1172
1036
775
880
788
5772
6
Frankenmuth
852
1005
1242
641
986
1013
5738
7
St. Joseph
1104
996
1094
763
858
859
5673
8
Berrien Springs
1144
1037
994
914
877
595
5562
9
Wayland Union
1019
1151
754
732
948
790
5395
10
Harper Woods
1244
1304
676
1034
1097
–
5356
11
Orchard Lake St. Mary’s
1004
995
1160
617
891
657
5323
12
Williamston
1117
1084
411
841
956
770
5181
13
Redford Union
1096
1134
462
887
944
616
5139
14
Battle Creek Harper Creek
1059
1009
961
743
702
578
5052
15
Otsego
650
783
1169
578
951
895
5025
16
Vicksburg
1011
1008
959
727
548
750
5003
17
Edwardsburg
1196
596
1101
682
611
800
4986
18
Niles
1077
999
903
752
545
536
4812
19
Marshall
1017
642
706
734
938
699
4737
20
Monroe Jefferson
615
918
1073
599
723
805
4732
21
Parma Western
285
823
1278
635
820
853
4693
22
Muskegon Oakridge
1021
614
1022
760
456
798
4671
23
Charlotte
638
926
1021
615
665
770
4635
24
Grand Rapids Christian
882
607
1081
506
715
807
4598
25
Coldwater
402
689
1066
657
913
868
4596
26
Coopersville
1019
721
699
765
734
582
4521
27
Detroit Voyageur
742
1000
589
729
806
625
4490
28
Owosso
890
981
695
362
729
754
4412
29
Macomb Lutheran North
892
887
1023
390
591
587
4369
30
Wyoming Kelloggsville
360
1020
818
489
880
742
4309
31
Chelsea
702
939
613
597
793
661
4305
32
Shepherd
302
960
971
636
698
702
4270
33
Bay City John Glenn
1027
1027
649
698
799
–
4200
34
Corunna
781
810
767
574
455
779
4166
35
Freeland
1036
777
616
540
598
523
4091
36
Dearborn Divine Child
652
646
658
644
861
601
4061
37
Cedar Springs
673
985
337
675
886
505
4060
38
Linden
1021
1007
308
834
855
–
4026
39
Howard City Tri-County
608
562
1016
499
630
645
3959
40
Allendale
394
714
1044
411
731
649
3943
41
Grand Rapids South Christian
686
861
687
461
710
538
3943
42
Cranbrook Kingswood
931
881
338
551
623
526
3850
43
Hopkins
408
689
927
647
632
533
3835
44
Grosse Pointe North
740
639
314
740
805
542
3781
45
Hamilton
617
972
332
609
805
437
3772
46
Plainwell
615
886
705
315
589
634
3744
47
St. Johns
783
682
–
821
870
447
3602
48
East Grand Rapids
702
909
–
593
769
549
3521
49
Whitehall
313
603
997
455
570
578
3517
50
New Boston Huron
686
319
611
633
659
599
3507
Grade
Name
Event
Team
Mark
Points
4×4
Stevensville Lakeshore
3:59.03
961
4×2
Stevensville Lakeshore
1:45.48
863
4×1
Stevensville Lakeshore
51.31
628
12
Kate Ort
400m
Stevensville Lakeshore
56.60
468
11
Lucy Cross
200m
Stevensville Lakeshore
25.42
418
11
Lucy Cross
100m
Stevensville Lakeshore
12.41
403
12
Kate Ort
200m
Stevensville Lakeshore
25.82
393
11
Lucy Cross
400m
Stevensville Lakeshore
60.95
367
9
Addison Marquardt
200m
Stevensville Lakeshore
27.09
317
10
Leah Garrity
200m
Stevensville Lakeshore
27.42
297
10
Leah Garrity
100m
Stevensville Lakeshore
13.23
292
9
Addison Marquardt
100m
Stevensville Lakeshore
13.24
291
11
Leigha Whitman
200m
Stevensville Lakeshore
27.56
289
10
Leah Garrity
400m
Stevensville Lakeshore
64.44
286
Rank
Team
100m
200m
400m
4×1
4×2
4×4
Total
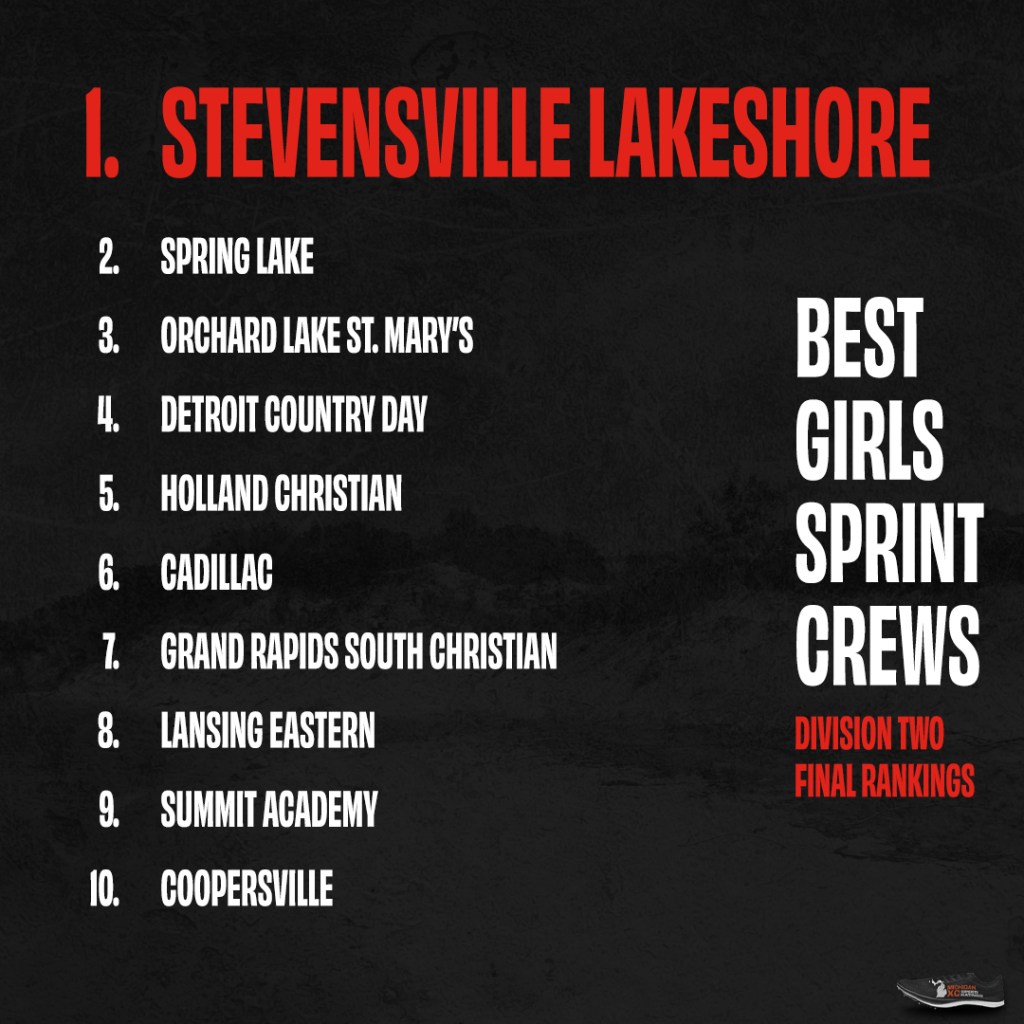
1
Stevensville Lakeshore
985
1128
1121
628
863
961
5686
2
Spring Lake
977
1038
1229
384
972
1047
5647
3
Orchard Lake St. Mary’s
877
1019
1102
767
989
804
5558
4
Detroit Country Day
978
896
1025
695
743
768
5105
5
Holland Christian
900
921
1077
659
559
865
4980
6
Cadillac
578
870
1080
683
782
843
4836
7
Grand Rapids South Christian
577
920
1211
434
633
1007
4783
8
Lansing Eastern
918
938
602
745
903
607
4713
9
Summit Academy North
1039
1117
301
795
987
436
4674
10
Coopersville
874
878
613
735
695
663
4458
11
Shepherd
869
615
762
641
879
676
4443
12
Grand Rapids Christian
1077
1021
1009
889
–
382
4378
13
Tecumseh
923
846
312
798
869
544
4293
14
St. Joseph
447
727
1088
612
751
646
4272
15
Vicksburg
861
802
628
716
692
573
4271
16
Sturgis
303
921
741
703
820
768
4256
17
Plainwell
1020
613
578
695
673
505
4083
18
Goodrich
543
856
761
477
654
725
4016
19
Berrien Springs
962
634
308
825
891
388
4008
20
Dearborn Divine Child
926
938
914
585
–
632
3994
21
Linden
622
543
900
593
562
645
3865
22
Battle Creek Harper Creek
277
867
660
660
784
586
3834
23
Hudsonville Unity Christian
653
300
773
579
796
679
3779
24
Milan
338
550
933
452
722
738
3732
25
Dearborn Henry Ford Academy
1065
672
643
–
764
551
3695
26
Remus Chippewa Hills
632
890
424
437
716
555
3654
27
Pinckney
–
600
932
590
781
729
3633
28
Owosso
680
722
413
646
758
384
3603
29
Chelsea
714
724
–
720
817
614
3590
30
Fruitport
397
380
851
432
787
724
3572
31
St. Johns
927
587
654
729
612
–
3510
32
Wayland Union
618
662
287
707
785
451
3509
33
Grosse Pointe North
334
545
659
577
774
590
3479
34
Coldwater
378
679
750
442
583
601
3432
35
Williamston
611
567
384
710
590
527
3389
36
Portland
915
299
306
735
560
488
3303
37
Haslett
300
426
489
509
813
727
3264
38
North Branch
704
639
325
715
875
–
3256
39
East Grand Rapids
320
649
789
–
650
835
3244
40
Parma Western
–
813
610
562
662
551
3197
41
Saginaw Swan Valley
332
550
402
560
615
609
3069
42
Frankenmuth
–
589
638
506
646
665
3044
43
Midland Bullock Creek
580
311
325
608
663
505
2991
44
Ferndale University
607
341
286
461
650
643
2988
45
Dundee
277
310
675
410
688
584
2945
46
Benton Harbor
973
559
–
663
648
–
2843
47
Three Rivers
624
533
287
673
706
–
2822
48
Riverview
870
568
–
708
665
–
2812
49
Macomb Lutheran North
351
670
757
–
532
498
2809
50
Flint Powers Catholic
331
380
609
397
494
594
2805
Grade
Name
Event
Team
Mark
Points
4×4
Elk Rapids
3:23.50
903
4×2
Elk Rapids
1:29.59
890
4×1
Elk Rapids
44.93
477
9
Garett Godden
400m
Elk Rapids
48.83
460
9
Garett Godden
200m
Elk Rapids
21.66
457
9
Garett Godden
100m
Elk Rapids
10.79
433
10
Gavin Hamilton
400m
Elk Rapids
50.78
391
10
Noah Liggett
100m
Elk Rapids
11.48
300
10
Miles Prabhaker
400m
Elk Rapids
53.78
284
10
Gavin Hamilton
200m
Elk Rapids
23.63
280
10
Miles Prabhaker
200m
Elk Rapids
23.66
278
10
Noah Liggett
200m
Elk Rapids
23.76
269
10
Ben Dyste
100m
Elk Rapids
11.66
265
12
Conner Carlisle
100m
Elk Rapids
11.73
252
10
Gavin Hamilton
100m
Elk Rapids
11.75
248
10
Miles Prabhaker
100m
Elk Rapids
11.79
240
Rank
Team
100m
200m
400m
4×1
4×2
4×4
Total
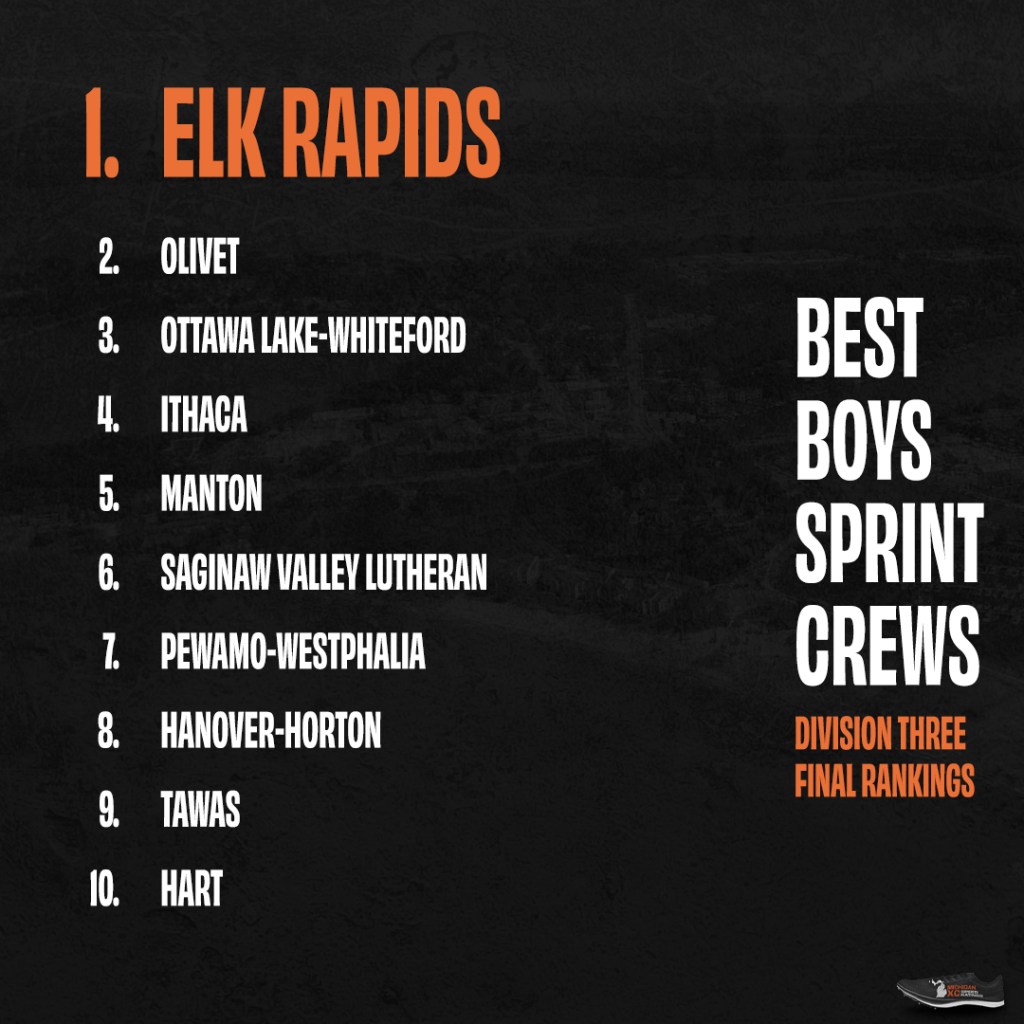
1
Elk Rapids
998
1015
1135
477
890
903
5418
2
Olivet
1133
1062
1015
671
682
672
5235
3
Ottawa Lake-Whiteford
819
909
1018
678
668
808
4899
4
Ithaca
802
897
1082
497
796
798
4872
5
Manton
933
912
1028
500
735
722
4829
6
Saginaw Valley Lutheran
844
1017
836
519
756
836
4809
7
Pewamo-Westphalia
715
913
1036
682
744
688
4779
8
Hanover-Horton
696
638
1062
698
821
751
4667
9
Tawas
886
910
977
583
581
684
4622
10
Hart
696
1005
1090
546
436
730
4503
11
Lansing Catholic
904
644
910
540
797
675
4469
12
Monroe St. Mary CC
1081
964
284
903
857
360
4450
13
Clinton
1119
1003
398
706
617
559
4402
14
Ann Arbor Greenhills
579
650
1248
281
755
870
4382
15
Buchanan
931
931
646
507
693
654
4361
16
Ovid-Elsie
886
970
804
578
755
333
4327
17
Cass City
967
1015
300
700
721
452
4155
18
Sanford-Meridian
646
667
1042
611
521
637
4123
19
Dearborn Advanced Technology
1040
936
388
532
805
394
4095
20
Adrian Madison
631
1018
320
650
857
605
4081
21
Laingsburg
948
577
664
491
441
646
3766
22
Reed City
823
1042
393
713
669
–
3640
23
Hillsdale
933
911
–
729
486
557
3616
24
Traverse City St. Francis
1013
670
671
570
645
–
3569
25
Saugatuck
679
644
649
430
511
641
3553
26
Kent City
775
256
643
512
617
630
3434
27
Jonesville
315
283
926
492
659
693
3368
28
North Muskegon
936
556
619
429
428
397
3364
29
Jackson Lumen Christi
386
716
752
392
603
496
3345
30
Belding
742
705
362
671
770
–
3251
31
LeRoy Pine River
856
655
276
568
534
318
3207
32
Kingsley
588
553
547
554
453
475
3169
33
Harbor Springs
263
249
886
415
588
733
3135
34
Brooklyn Columbia Central
336
415
421
373
777
799
3122
35
Mason County Central
546
333
929
314
619
376
3118
36
Carrollton
1052
614
275
597
549
–
3087
37
Burton Atherton
900
874
312
479
515
–
3080
38
Mt Clemens
706
330
358
472
480
681
3027
39
New Lothrop
559
924
343
267
571
340
3005
40
Blissfield
581
598
–
467
679
643
2967
41
Charlevoix
269
249
777
389
628
637
2949
42
Warren Michigan Collegiate
304
952
–
526
738
361
2880
43
Kalkaska
865
302
343
503
398
390
2801
44
Constantine
506
272
590
341
480
595
2785
45
Centreville
381
380
274
564
546
605
2750
46
Manistee
965
867
–
373
454
–
2660
47
Erie Mason
325
298
630
330
437
638
2660
48
Chesaning
252
316
599
362
473
646
2649
49
Almont
542
–
896
281
350
516
2584
50
Lawton
846
597
–
570
527
–
2539
Grade
Name
Event
Team
Mark
Points
4×2
Olivet
1:44.67
901
4×1
Olivet
49.32
841
4×4
Olivet
4:08.53
762
12
Celina Sinclair
100m
Olivet
11.92
469
12
Celina Sinclair
200m
Olivet
24.91
448
12
Celina Sinclair
400m
Olivet
58.82
416
12
Emily Peters
400m
Olivet
61.12
363
10
Lola Miars
100m
Olivet
12.73
359
12
Emily Peters
100m
Olivet
12.77
354
12
Emily Peters
200m
Olivet
26.55
350
9
Lily Britton
400m
Olivet
62.11
340
10
Lola Miars
200m
Olivet
27.61
286
12
Kendall Eggerstedt
200m
Olivet
27.68
281
10
Tiya Feldpausch
400m
Olivet
64.98
273
11
Bailey Powell
100m
Olivet
13.58
245
11
Bailey Powell
200m
Olivet
28.30
244
Rank
Team
100m
200m
400m
4×1
4×2
4×4
Total
1
Olivet
1182
1083
1119
841
901
762
5889
2
Traverse City St. Francis
1226
1021
913
790
857
587
5394
3
Kingsley
1062
1012
873
817
880
416
5061
4
Newaygo
903
955
949
756
756
729
5049
5
Pewamo-Westphalia
857
873
1075
628
771
797
5000
6
Lansing Catholic
285
902
1155
475
764
921
4502
7
Monroe St. Mary CC
958
974
270
755
484
623
4066
8
Adrian Madison
769
744
759
587
548
572
3978
9
McBain
918
683
322
538
754
670
3885
10
Caro
299
592
935
590
755
688
3859
11
Charyl Stockwell Academy
699
721
682
592
616
515
3826
12
Grandville Calvin Christian
911
909
276
568
785
373
3822
13
Erie Mason
747
733
415
636
666
494
3692
14
Ida
522
613
587
597
656
594
3569
15
Grass Lake
332
764
357
637
750
678
3519
16
Harbor Springs
605
845
272
537
694
529
3482
17
Hart
662
595
575
587
586
474
3479
18
Napoleon
799
601
296
647
742
278
3364
19
Chesaning
349
312
892
421
678
698
3351
20
Niles Brandywine
488
774
311
548
671
546
3339
21
University Liggett
972
934
–
638
694
–
3238
22
Rochester Hills Lutheran NW
–
699
1005
334
532
662
3232
23
Wyoming Potter’s House
919
809
249
627
625
–
3229
24
Centreville
530
516
560
582
404
621
3213
25
Red Arrow
320
609
575
631
475
594
3205
26
Clinton
605
589
1001
325
669
–
3190
27
Stanton Central Montcalm
787
257
606
332
560
613
3155
28
Manton
570
324
647
454
472
616
3083
29
Constantine
–
246
917
339
705
749
2957
30
Ottawa Lake-Whiteford
234
374
629
407
545
667
2855
31
Dearborn Heights Robichaud
908
–
251
763
447
442
2811
32
Ithaca
–
621
664
297
663
526
2771
33
Jackson Lumen Christi
687
261
258
602
506
383
2696
34
Reed City
616
606
531
352
586
–
2691
35
New Lothrop
695
327
391
545
444
281
2683
36
Clintondale
536
382
416
333
554
456
2678
37
Ovid-Elsie
847
820
–
455
517
–
2640
38
Homer
608
648
–
672
702
–
2630
39
Hillsdale
299
277
658
364
580
394
2571
40
Blissfield
231
247
604
463
543
454
2543
41
Perry
520
560
–
517
518
409
2524
42
Ann Arbor Greenhills
376
386
884
298
–
553
2498
43
Saginaw Valley Lutheran
–
310
669
358
642
517
2495
44
Saranac
255
–
569
497
623
545
2490
45
Grand Rapids NorthPointe Christian
311
316
555
554
–
709
2445
46
Hamady
568
542
256
484
582
–
2432
47
Quincy
236
566
384
–
556
636
2378
48
Union City
262
272
263
398
550
602
2347
49
Bad Axe
530
–
349
469
536
460
2344
50
Schoolcraft
637
287
–
661
422
299
2305
Grade
Name
Event
Team
Mark
Points
4×2
Eau Claire
1:30.07
853
4×1
Eau Claire
43.36
706
4×4
Eau Claire
3:31.83
637
11
Elijah Marlowe
200m
Eau Claire
22.04
423
10
Melvin Davis
400m
Eau Claire
50.11
415
11
Elijah Marlowe
100m
Eau Claire
11.05
383
12
Daquarius Travis
400m
Eau Claire
51.79
355
12
A’darion Fort
200m
Eau Claire
23.15
323
11
Devin Hill
200m
Eau Claire
23.17
322
12
A’darion Fort
100m
Eau Claire
11.52
292
11
Devin Hill
100m
Eau Claire
11.57
283
Rank
Team
100m
200m
400m
4×1
4×2
4×4
Total
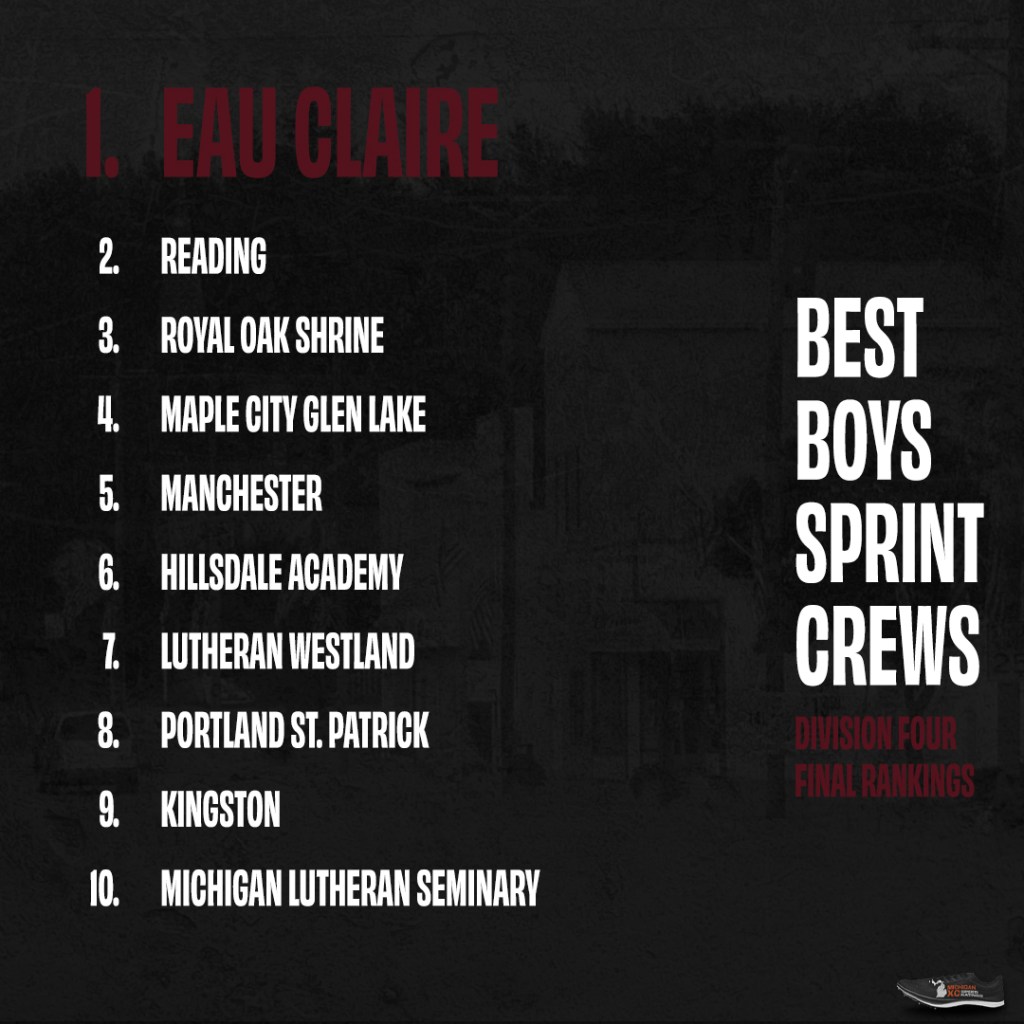
1
Eau Claire
958
1068
770
706
853
637
4991
2
Reading
990
925
899
600
689
529
4632
3
Royal Oak Shrine
954
890
906
586
684
583
4602
4
Maple City Glen Lake
938
834
809
609
672
474
4336
5
Manchester
571
918
886
454
726
507
4063
6
Hillsdale Academy
592
869
983
402
527
605
3978
7
Lutheran Westland
769
596
828
500
629
620
3943
8
Portland St. Patrick
613
679
934
362
624
668
3880
9
Kingston
809
849
765
496
672
200
3791
10
Saginaw Michigan Lutheran Seminary
788
703
643
525
641
476
3776
11
Kalamazoo Hackett
525
819
890
113
658
687
3692
12
Climax-Scotts
852
893
627
355
605
308
3639
13
Southfield Christian
542
830
760
264
521
528
3444
14
Brown City
565
748
795
471
371
476
3426
15
Concord
586
545
569
415
607
701
3423
16
Jackson Preparatory
927
926
783
–
521
215
3371
17
Gobles
313
506
613
547
595
573
3147
18
Allen Park Cabrini
459
468
879
207
357
514
2886
19
Fowler
636
615
504
279
416
417
2867
20
Lansing Christian
909
814
332
367
384
–
2808
21
Mendon
458
394
440
430
450
623
2794
22
Vassar
829
349
229
518
564
224
2713
23
Dansville
531
682
503
210
442
311
2679
24
Decatur
261
203
789
334
537
484
2608
25
Marlette
554
478
339
212
339
671
2593
26
Mt. Pleasant Sacred Heart
523
558
576
328
–
599
2585
27
Indian River Inland Lakes
206
428
618
390
431
475
2547
28
Mesick
558
590
607
171
289
316
2531
29
Beal City
600
339
779
255
–
545
2518
30
St. Charles
738
716
–
453
583
–
2489
31
Whitmore Lake
–
599
792
118
533
443
2485
32
Potterville
644
414
278
210
384
520
2448
33
Frankfort
661
431
218
295
457
375
2437
34
Grand Traverse Academy
521
569
–
443
474
235
2242
35
Byron
260
456
784
–
269
409
2177
36
Britton Deerfield
627
552
–
537
359
–
2075
37
Mayville
246
183
469
246
448
468
2062
38
Pittsford
188
777
–
393
530
147
2035
39
Marion
492
603
367
–
251
239
1952
40
Mancelona
206
546
407
213
248
292
1911
41
Detroit Frederick Douglass
–
215
605
383
–
704
1906
42
White Pigeon
250
–
289
514
504
335
1892
43
Leland
–
196
791
–
349
503
1838
44
Central Lake / Ellsworth
506
657
262
355
–
–
1780
45
Breckenridge
263
192
865
–
–
438
1758
46
East Jordan
608
628
383
106
–
–
1725
47
Montabella
661
374
–
481
–
203
1720
48
Southfield Bradford Academy
538
185
202
310
447
–
1683
49
Petoskey St. Michael
210
219
754
–
245
251
1679
50
Camden-Frontier
219
480
–
170
492
307
1668
Grade
Name
Event
Team
Mark
Points
4×2
Frankfort
1:44.25
921
4×1
Frankfort
50.03
762
4×4
Frankfort
4:10.58
722
12
Sofia Alaimo Schindler
400m
Frankfort
58.06
434
12
Sofia Alaimo Schindler
200m
Frankfort
25.43
417
12
Sofia Alaimo Schindler
100m
Frankfort
12.33
414
11
Alice Luther
200m
Frankfort
26.28
366
12
Addison Jarosz
400m
Frankfort
63.85
299
11
Alice Luther
400m
Frankfort
64.79
278
12
Addison Jarosz
100m
Frankfort
13.34
277
12
Addison Jarosz
200m
Frankfort
28.14
254
12
Willa Roth
400m
Frankfort
66.95
227
Rank
Team
100m
200m
400m
4×1
4×2
4×4
Total
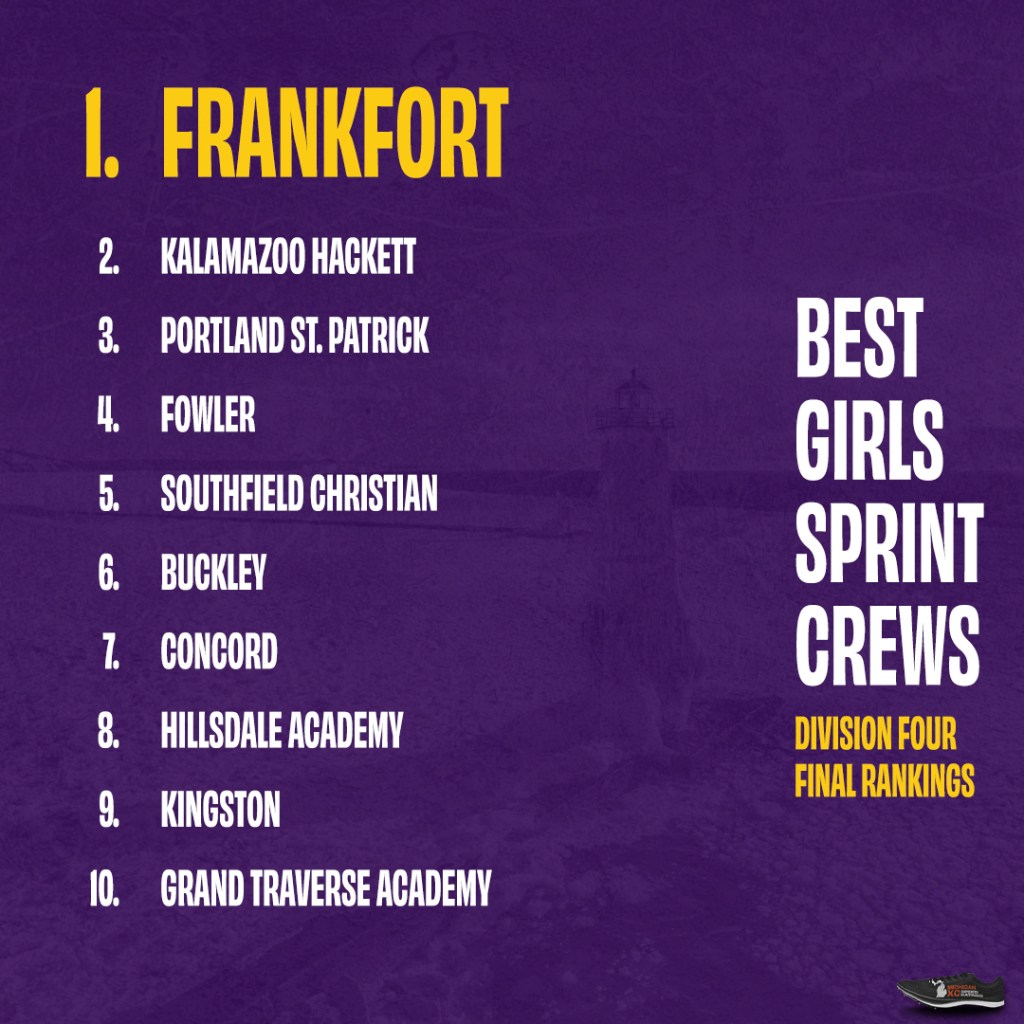
1
Frankfort
691
1036
1011
762
921
722
5142
2
Kalamazoo Hackett
993
1051
981
605
734
654
5018
3
Portland St. Patrick
855
925
1003
615
791
802
4991
4
Fowler
846
908
960
626
745
749
4833
5
Southfield Christian
946
897
845
715
689
559
4650
6
Buckley
641
880
858
609
765
639
4392
7
Concord
368
827
938
586
765
797
4280
8
Hillsdale Academy
697
638
934
383
646
669
3966
9
Kingston
555
268
961
423
601
812
3620
10
Grand Traverse Academy
603
454
722
415
626
596
3417
11
Gobles
232
509
867
503
697
608
3416
12
Marlette
491
762
713
283
461
521
3231
13
Breckenridge
832
613
288
702
526
194
3156
14
Indian River Inland Lakes
280
491
733
458
578
579
3118
15
St. Charles
455
482
201
623
603
727
3091
16
Whitmore Lake
409
500
700
299
356
544
2810
17
St Joseph Michigan Lutheran
669
749
251
719
360
–
2748
18
Mancelona
423
690
345
510
372
368
2708
19
Maple City Glen Lake
224
215
525
526
572
563
2625
20
Central Lake / Ellsworth
608
454
281
345
481
349
2518
21
Petersburg-Summerfield
412
227
498
469
440
455
2501
22
Saginaw Michigan Lutheran Seminary
288
289
510
461
468
412
2428
23
Vermontville Maple Valley
200
474
792
–
456
476
2398
24
Mt. Pleasant Sacred Heart
597
562
–
644
–
579
2383
25
Royal Oak Shrine
331
339
499
–
647
560
2377
26
Climax-Scotts
627
618
–
363
509
258
2375
27
Manchester
396
201
250
347
580
489
2263
28
Pittsford
235
303
455
412
556
291
2252
29
Reading
757
279
–
433
462
303
2234
30
Birmingham Roeper
568
346
423
323
559
–
2218
31
Dansville
566
575
–
256
459
204
2061
32
Bellaire
266
311
713
–
295
471
2057
33
Mendon
459
261
192
471
496
149
2029
34
Marion
539
239
268
447
301
201
1995
35
Beal City
711
199
210
426
271
176
1992
36
Onekama
–
219
780
–
506
458
1964
37
Merrill
241
219
257
414
478
249
1857
38
Camden-Frontier
331
340
362
–
368
442
1842
39
Harbor Beach
431
192
197
409
405
197
1832
40
Morenci
345
498
206
–
490
262
1801
41
Addison
247
–
247
421
547
330
1793
42
Hudson
411
423
404
–
–
522
1760
43
Allen Park Cabrini
292
237
–
372
492
340
1733
44
Petoskey St. Michael
191
238
586
–
351
355
1720
45
Bear Lake
204
283
569
–
376
265
1698
46
Byron
446
526
228
–
478
–
1678
47
Whittemore-Prescott
339
365
595
–
–
375
1675
48
Mesick
451
273
–
319
333
239
1615
49
Webberville
496
191
–
388
475
–
1550
50
Brown City
197
210
265
246
358
232
1508
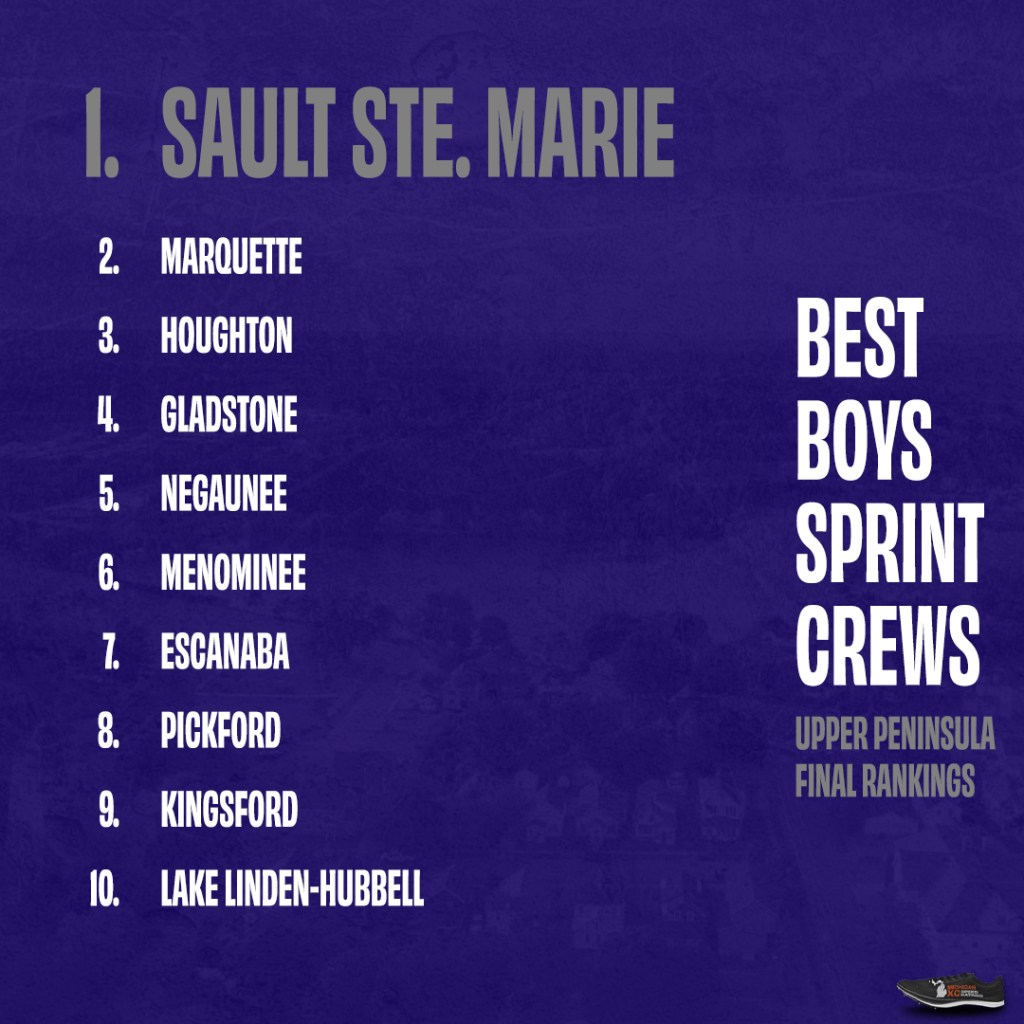
Rank
Team
100m
200m
400m
4×1
4×2
4×4
Total
1
Sault Ste. Marie
956
873
954
567
723
576
4648
2
Marquette
977
940
1073
457
597
459
4503
3
Houghton
940
754
830
538
342
501
3906
4
Gladstone
1050
859
227
594
260
180
3170
5
Negaunee
434
786
816
224
501
381
3143
6
Menominee
702
393
542
350
626
413
3026
7
Escanaba
458
456
587
344
508
502
2855
8
Pickford
523
532
757
344
402
294
2852
9
Kingsford
871
547
271
511
625
–
2826
10
Stephenson
433
409
482
300
419
418
2461
11
Lake Linden-Hubbell
261
415
541
286
416
286
2207
12
Rapid River
–
433
593
219
364
347
1956
13
Rudyard
600
209
–
272
360
321
1762
14
Newberry
–
201
554
216
292
370
1634
15
Ishpeming Westwood
367
192
–
297
396
261
1514
16
West Iron County
188
357
269
128
235
223
1401
17
Brimley
200
441
–
253
413
–
1308
18
Eben Jct. Superior Central
275
309
259
132
322
–
1298
19
Norway
–
297
–
286
440
153
1176
20
Bark River-Harris
213
–
495
112
–
297
1118
21
Bessemer
283
244
213
147
229
–
1116
22
Munising
273
258
300
–
–
228
1059
23
Gwinn
204
226
–
205
369
–
1003
24
Calumet
456
–
–
227
319
–
1002
25
Manistique
194
209
–
192
321
–
916
26
Ironwood
333
331
227
–
–
–
890
27
Baraga
269
273
273
–
–
–
815
28
Iron Mountain
186
185
257
–
–
–
629
29
Ishpeming
–
222
210
–
–
153
585
30
Cedarville
–
175
–
–
259
130
564
31
Dollar Bay
277
251
–
–
–
–
528
32
Rock Mid-Peninsula
260
262
–
–
–
–
522
33
Engadine
–
–
229
–
–
175
403
34
Powers North Central
192
182
–
–
–
–
374
35
St. Ignace
–
–
–
123
–
249
373
36
Forest Park
–
–
–
–
–
306
306
37
Wilson Hannahville-Nah Tah Wahsh PSA
–
–
251
–
–
–
251
38
North Dickinson County
–
–
–
–
–
177
177
Grade
Name
Event
Team
Mark
Points
4×2
Sault Ste. Marie
1:31.86
723
4×4
Sault Ste. Marie
3:33.98
576
4×1
Sault Ste. Marie
44.28
567
10
Ian Southwell
400m
Sault Ste. Marie
51.13
378
9
Kyan Hemenway
200m
Sault Ste. Marie
22.77
358
10
Dane Armentrout
100m
Sault Ste. Marie
11.30
335
9
Kyan Hemenway
100m
Sault Ste. Marie
11.41
313
12
Javonte Bellamy
100m
Sault Ste. Marie
11.44
308
9
Luke Roe
100m
Sault Ste. Marie
11.48
300
12
Caleb Klier
400m
Sault Ste. Marie
53.58
291
12
Adam Brandt
400m
Sault Ste. Marie
53.78
284
9
Luke Roe
200m
Sault Ste. Marie
23.59
284
9
Drew Burtt
400m
Sault Ste. Marie
54.83
247
12
Javonte Bellamy
200m
Sault Ste. Marie
24.18
231
10
Dane Armentrout
200m
Sault Ste. Marie
24.35
216
11
Dean Roe
100m
Sault Ste. Marie
12.03
194
12
Isaac Niebuhr
200m
Sault Ste. Marie
24.69
185
Rank
Team
100m
200m
400m
4×1
4×2
4×4
Total
1
Sault Ste. Marie
956
873
954
567
723
576
4648
2
Marquette
977
940
1073
457
597
459
4503
3
Houghton
940
754
830
538
342
501
3906
4
Gladstone
1050
859
227
594
260
180
3170
5
Negaunee
434
786
816
224
501
381
3143
6
Menominee
702
393
542
350
626
413
3026
7
Escanaba
458
456
587
344
508
502
2855
8
Pickford
523
532
757
344
402
294
2852
9
Kingsford
871
547
271
511
625
–
2826
10
Stephenson
433
409
482
300
419
418
2461
11
Lake Linden-Hubbell
261
415
541
286
416
286
2207
12
Rapid River
–
433
593
219
364
347
1956
13
Rudyard
600
209
–
272
360
321
1762
14
Newberry
–
201
554
216
292
370
1634
15
Ishpeming Westwood
367
192
–
297
396
261
1514
16
West Iron County
188
357
269
128
235
223
1401
17
Brimley
200
441
–
253
413
–
1308
18
Eben Jct. Superior Central
275
309
259
132
322
–
1298
19
Norway
–
297
–
286
440
153
1176
20
Bark River-Harris
213
–
495
112
–
297
1118
21
Bessemer
283
244
213
147
229
–
1116
22
Munising
273
258
300
–
–
228
1059
23
Gwinn
204
226
–
205
369
–
1003
24
Calumet
456
–
–
227
319
–
1002
25
Manistique
194
209
–
192
321
–
916
26
Ironwood
333
331
227
–
–
–
890
27
Baraga
269
273
273
–
–
–
815
28
Iron Mountain
186
185
257
–
–
–
629
29
Ishpeming
–
222
210
–
–
153
585
30
Cedarville
–
175
–
–
259
130
564
31
Dollar Bay
277
251
–
–
–
–
528
32
Rock Mid-Peninsula
260
262
–
–
–
–
522
33
Engadine
–
–
229
–
–
175
403
34
Powers North Central
192
182
–
–
–
–
374
35
St. Ignace
–
–
–
123
–
249
373
36
Forest Park
–
–
–
–
–
306
306
37
Wilson Hannahville-Nah Tah Wahsh PSA
–
–
251
–
–
–
251
38
North Dickinson County
–
–
–
–
–
177
177
Grade
Name
Event
Team
Mark
Points
4×4
Negaunee
4:02.64
883
4×2
Negaunee
1:48.29
738
4×1
Negaunee
50.47
715
11
Keira Waterman
400m
Negaunee
58.50
424
11
Sadie Rogers
400m
Negaunee
59.84
393
10
Elvera Coyne
100m
Negaunee
12.61
376
11
Sadie Rogers
200m
Negaunee
26.21
370
9
Brynn Wieciech
400m
Negaunee
61.93
344
11
Izzy Francisco
100m
Negaunee
12.90
336
11
Izzy Francisco
200m
Negaunee
26.80
334
11
Keira Waterman
200m
Negaunee
27.02
321
11
Riley Conklin
400m
Negaunee
63.91
298
9
Brynn Wieciech
200m
Negaunee
27.60
286
11
Sadie Rogers
100m
Negaunee
13.30
282
9
Brynn Wieciech
100m
Negaunee
13.54
250
11
Keira Waterman
100m
Negaunee
13.57
246
9
Ayla Reichel
100m
Negaunee
13.70
228
10
Elvera Coyne
200m
Negaunee
28.63
224
12
Nori Korsman
400m
Negaunee
67.89
205
Rank
Team
100m
200m
400m
4×1
4×2
4×4
Total
1
Negaunee
995
1026
1161
715
738
883
5516
2
Marquette
939
945
839
717
798
324
4562
3
Manistique
481
635
675
515
650
375
3331
4
Lake Linden-Hubbell
280
545
684
507
536
479
3031
5
Gladstone
319
355
587
413
648
489
2811
6
Calumet
630
329
275
358
636
569
2796
7
Houghton
224
401
848
211
446
542
2672
8
Bark River-Harris
468
515
211
480
594
248
2516
9
Sault Ste. Marie
188
500
250
317
536
424
2215
10
Stephenson
547
464
603
167
–
354
2135
11
Kingsford
418
193
–
454
601
440
2106
12
Forest Park
268
401
445
218
388
369
2090
13
Ontonagon Area
273
328
365
358
420
307
2051
14
St. Ignace
209
392
229
394
470
177
1872
15
West Iron County
193
483
200
344
406
159
1786
16
Rudyard
297
298
338
223
308
280
1745
17
Dollar Bay
674
–
–
442
285
304
1704
18
Ewen-Trout Creek
–
193
484
205
439
320
1642
19
Escanaba
–
206
447
224
362
358
1596
20
Eben Jct. Superior Central
214
219
283
325
446
–
1486
21
Menominee
–
410
–
309
470
286
1476
22
Gwinn
200
207
239
337
474
–
1457
23
Pickford
–
–
442
277
389
240
1348
24
Ishpeming Westwood
261
262
203
–
278
190
1193
25
Brimley
–
–
198
340
425
215
1177
26
Big Bay De Noc
346
382
434
–
–
–
1162
27
L’Anse
220
–
–
193
403
342
1158
28
Newberry
–
216
539
–
–
385
1140
29
Norway
301
336
317
–
–
–
955
30
Iron Mountain
–
–
–
170
299
273
742
31
Munising
–
–
270
–
226
178
675
32
North Dickinson County
–
–
–
–
269
298
567
33
Engadine
261
302
–
–
–
–
563
34
Hancock
–
–
235
–
–
309
544
35
Baraga
–
–
–
210
265
–
475
36
Ishpeming
239
–
211
–
–
–
450
37
Chassell
–
280
–
–
–
–
280
38
Powers North Central
238
–
–
–
–
–
238
39
Bessemer
–
–
–
–
227
–
227
40
Cedarville
211
–
–
–
–
–
211
41
Rock Mid-Peninsula
–
–
211
–
–
–
211
42
Carney-Nadeau
189
–
–
–
–
–
189
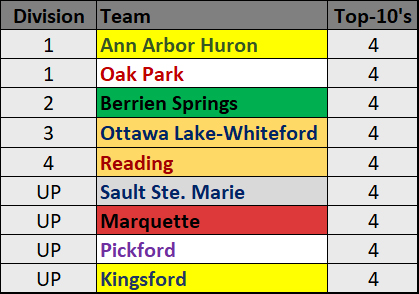
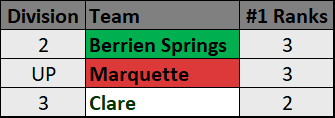
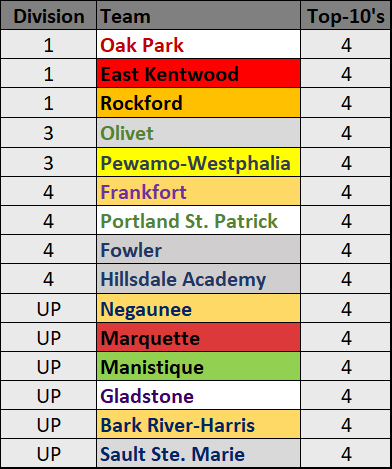
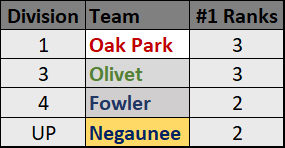
The Past Four Years
The Best Crews have been around for five seasons, four in the current format and methodology. I thought I’d look back and see how many crews have made it into the top-10 all four years and who has been ranked #1 more than once. A single year is a great piece of evidence. Multiple years of success and high achievement definitely speak highly of a program’s culture.