Finally, the start of the season we’ve all been waiting for. Throw out all the fast times from September, but apply all the lessons learned through the summer and fall. Regional week is here and with it comes the many projections and previews I’ll write.
Just as last year and throughout the season, I’m projecting these using race simulations. Through a season’s worth of speed ratings, one can determine a runner’s average rating and the variability of those ratings. Both those factors are then weighed towards more recent meets, which are then simulated thousands of times using a Monte Carlo analysis (also described by TullyRunners here). Over those thousands of race simulations, one can determine a team’s average place and average score, a runner’s average place, odds on winning, and odds on qualifying.
These are useful in cross country scenarios, where you have consistent runners and those who are a bit more up and down. For example:
| Tanner Time | Tanner Rating | Tanner Avg. | Tanner StDev. |
| 15:30 | 210 | ||
| 15:45 | 205 | ||
| 16:00 | 200 | ||
| 16:15 | 195 | ||
| 16:30 | 190 | 200 | 7.91 |
| MIXCSR Time | MIXCSR Rating | MIXCSR Avg. | MIXCSR StDev. |
| 16:09 | 197 | ||
| 16:12 | 196 | ||
| 16:15 | 195 | ||
| 16:18 | 194 | ||
| 16:21 | 193 | 195 | 1.58 |
Jacob at his best might be faster than I in four of the five races during the season. I’d almost never be All-State in Division 1, but he might contend for a top-5 spot or place 60th.
If we did 20 simulations, this is how it might turn out:
| Race | Tanner Avg. | Tanner StDev | Tanner Rating | MIXCSR Avg. | MIXCSR StDev | MIXCSR Rating |
| 1 | 200 | 7.9 | 202.1 | 195 | 1.6 | 195.6 |
| 2 | 200 | 7.9 | 196.2 | 195 | 1.6 | 194.1 |
| 3 | 200 | 7.9 | 190.0 | 195 | 1.6 | 199.2 |
| 4 | 200 | 7.9 | 193.4 | 195 | 1.6 | 192.5 |
| 5 | 200 | 7.9 | 206.8 | 195 | 1.6 | 195.7 |
| 6 | 200 | 7.9 | 201.8 | 195 | 1.6 | 196.1 |
| 7 | 200 | 7.9 | 171.6 | 195 | 1.6 | 194.9 |
| 8 | 200 | 7.9 | 189.2 | 195 | 1.6 | 195.9 |
| 9 | 200 | 7.9 | 205.5 | 195 | 1.6 | 197.0 |
| 10 | 200 | 7.9 | 203.8 | 195 | 1.6 | 192.6 |
| 11 | 200 | 7.9 | 192.3 | 195 | 1.6 | 196.5 |
| 12 | 200 | 7.9 | 196.9 | 195 | 1.6 | 196.4 |
| 13 | 200 | 7.9 | 198.5 | 195 | 1.6 | 195.6 |
| 14 | 200 | 7.9 | 203.2 | 195 | 1.6 | 194.1 |
| 15 | 200 | 7.9 | 193.9 | 195 | 1.6 | 192.6 |
| 16 | 200 | 7.9 | 199.3 | 195 | 1.6 | 193.2 |
| 17 | 200 | 7.9 | 208.7 | 195 | 1.6 | 194.2 |
| 18 | 200 | 7.9 | 213.7 | 195 | 1.6 | 194.6 |
| 19 | 200 | 7.9 | 212.6 | 195 | 1.6 | 197.1 |
| 20 | 200 | 7.9 | 206.3 | 195 | 1.6 | 193.9 |
I’d win four times, but I’d never have the ability to win a title like he had in Race 18. He’s usually All-State, but may cost his team a title through his effort in Race 7.
The simulations give the possibilities of those scenarios and all the various scoring scripts. A sixth girl that can pop off on any certain day, a reliable boy who always runs 17-flat, you name it. Hopefully, they better elucidate our contenders, qualifiers, and how these races play out over the weekend.
But always remember, races aren’t run on paper or on a computer. These projections are meant to better our sport, give more attention where little is given. Although I take pride in their accuracy, this endeavor would be quite boring if it were always perfect. I look forward to these being proven wrong and I expect to hear about it as well.

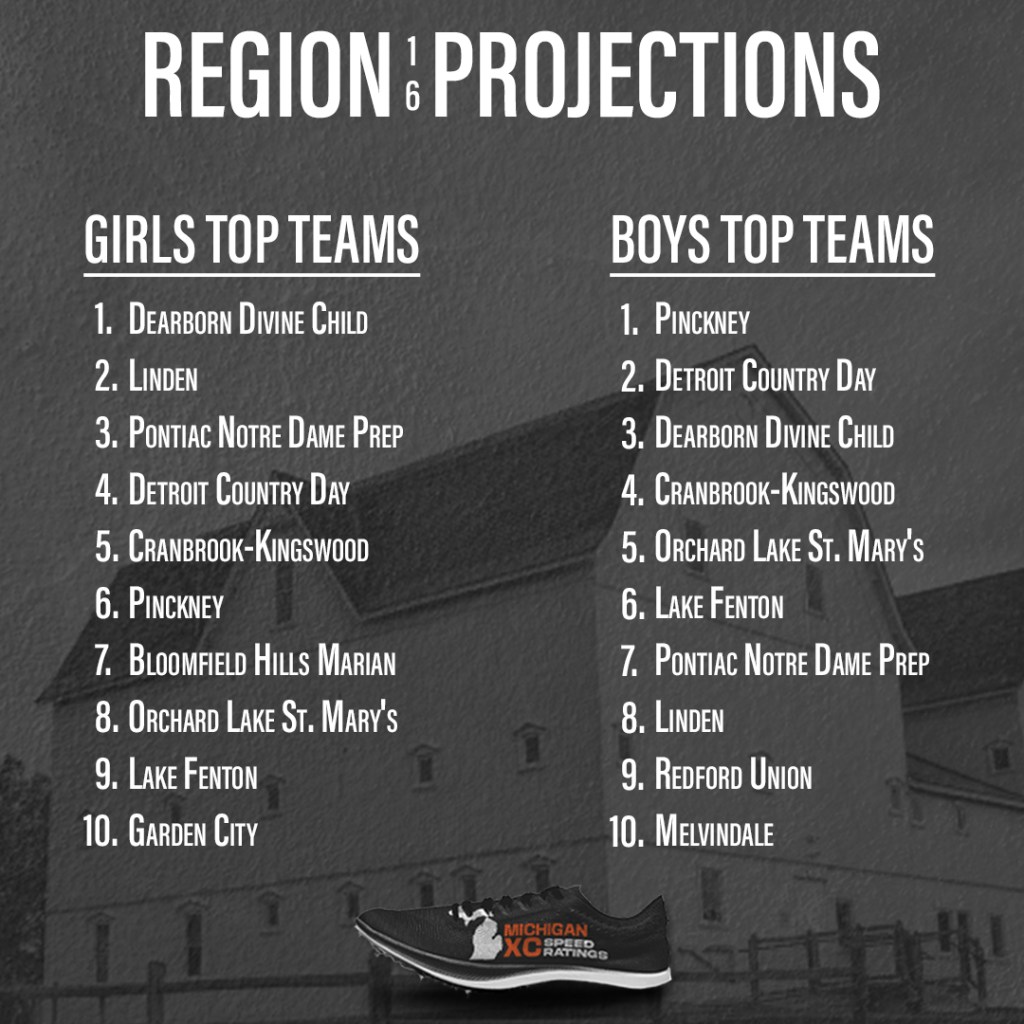
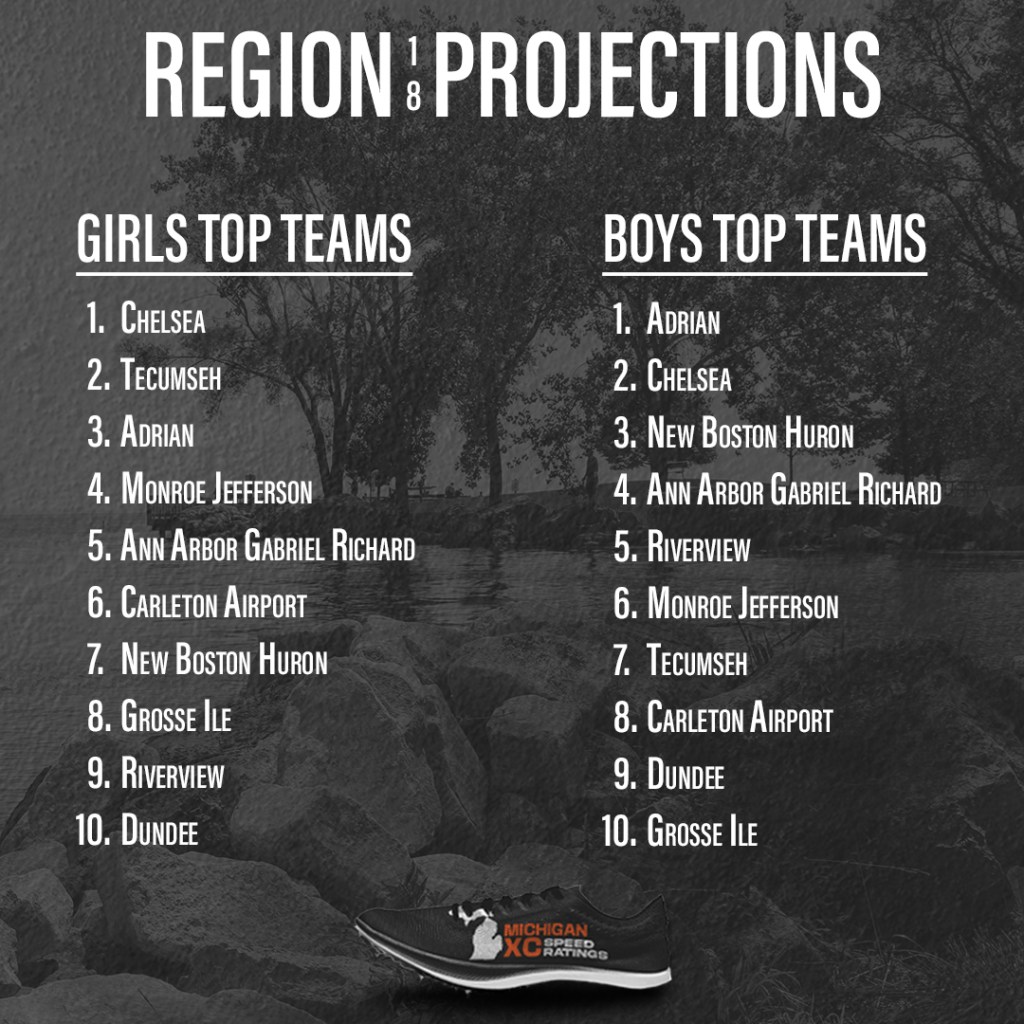
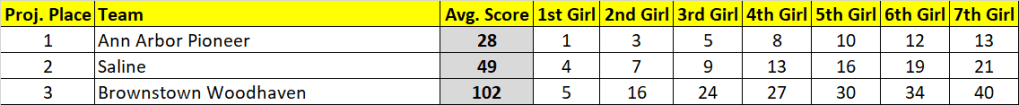
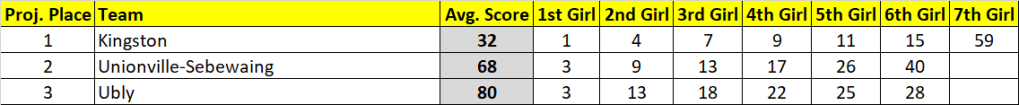
GIRLS
Ranked Teams
#8 Kingston
#20 Unionville-Sebewaing
#23 Ubly
Projected Individual Qualifier Cutoff
Tons of USA, Kingston, and Ubly girls occupying the 11th-20th spots moves the expected cutoff to 19th.
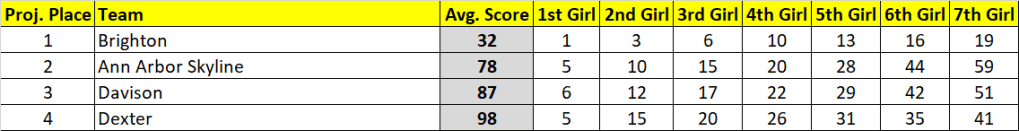
| Projected Place | Team | Avg. Score | Avg. Place | Win % | Top 3 % |
| 1 | Kingston | 32 | 1.0 | 95+ | 95+ |
| 2 | Unionville-Sebewaing | 68 | 2.1 | 95+ | |
| 3 | Ubly | 80 | 2.9 | 95+ | |
| 4 | Dryden | 107 | 4.7 | ||
| 5 | Brown City | 107 | 4.9 | ||
| 6 | Harbor Beach | 111 | 5.4 | ||
| 7 | Deckerville | 166 | 7.0 |
| Projected Place | Grade | Name | Team | Avg. Place |
| 1 | 10 | Lilah Kiley | Kingston | 1.3 |
| 2 | 12 | Alberta Reinbold | Unionville-Sebewaing | 3.4 |
| 3 | 10 | Katie Sweeney | Ubly | 3.6 |
| 4 | 12 | Lily Lemanski | Marlette | 3.9 |
| 5 | 12 | Gracy Walker | Kingston | 6.0 |
| 6 | 11 | Reece Wruble | Harbor Beach | 6.2 |
| 7 | 11 | Kyra Beemer | Brown City | 7.8 |
| 8 | 12 | Zoe Van Rijn | Kingston | 8.3 |
| 9 | 11 | Julia Rogers | New Life Christian Academy | 10.0 |
| 10 | 10 | Cara Prusakiewicz | Dryden | 10.4 |
| 11 | 11 | Meeghan Flikkie | Kingston | 10.8 |
| 12 | 10 | Molly Walker | Kingston | 10.9 |
| 13 | 11 | Sarah Nimtz | Unionville-Sebewaing | 12.0 |
| 14 | 11 | Cambree Torma | Unionville-Sebewaing | 13.6 |
| 15 | 12 | Audrey Napolitano | Dryden | 14.4 |
| 16 | 12 | Erica Klee | Ubly | 14.7 |
| 17 | 10 | Hailey McGuire | Kingston | 16.6 |
| 18 | 11 | Megan Peter | Unionville-Sebewaing | 19.4 |
| 19 | 11 | Bridget Anderson | Harbor Beach | 20.4 |
| 20 | 12 | Aran Harris | Ubly | 20.8 |
| 21 | 11 | Emma Ramisch | Harbor Beach | 22.5 |
| 22 | 12 | Lily Finnigan | Dryden | 22.9 |
| 23 | 10 | HarLee Leasher | Brown City | 23.2 |
| 24 | 11 | Skylar Vincent | Brown City | 24.9 |
| 25 | 9 | Nicole Klee | Ubly | 25.3 |
| 26 | 12 | Emily Greyerbiehl | Ubly | 27.9 |
| 27 | 10 | Mya Garza | Deckerville | 28.7 |
| 28 | 11 | Danielle Hunt | Unionville-Sebewaing | 28.7 |
| 29 | 12 | Johanna Kubacki | Deckerville | 29.3 |
| 30 | 10 | Maleah Roth | Ubly | 30.0 |
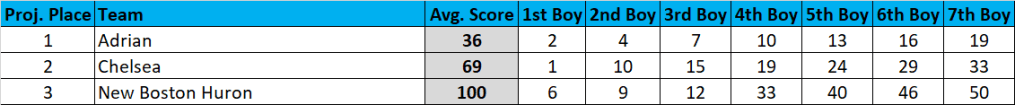
BOYS
Ranked Teams
#10 Harbor Beach
Projected Individual Qualifier Cutoff
15th place.
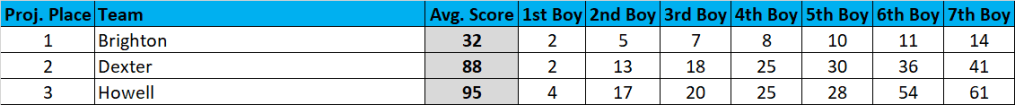
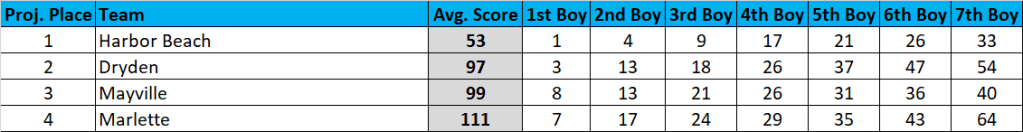
| Projected Place | Team | Avg. Score | Avg. Place | Win % | Top 3 % |
| 1 | Harbor Beach | 53 | 1.0 | 95+ | 95+ |
| 2 | Dryden | 97 | 2.5 | 93 | |
| 3 | Mayville | 99 | 2.8 | 84 | |
| 4 | Marlette | 111 | 3.7 | 23 | |
| 5 | Unionville-Sebewaing | 143 | 5.7 | ||
| 6 | Ubly | 146 | 6.0 | ||
| 7 | New Life Christian Academy | 158 | 7.1 | ||
| 8 | Kingston | 163 | 7.2 | ||
| 9 | Deckerville | 194 | 8.9 | ||
| 10 | Brown City | 241 | 10.0 |
| Projected Place | Grade | Name | Team | Avg. Place |
| 1 | 10 | Brody Karg | Harbor Beach | 1.2 |
| 2 | 12 | Aiden Fitchett | Dryden | 2.5 |
| 3 | 10 | Carson Burgess | Brown City | 3.5 |
| 4 | 12 | Utah Gusa | Ubly | 4.4 |
| 5 | 11 | Matthew Pasiak | Harbor Beach | 4.4 |
| 6 | 11 | Turlough Bennett | Marlette | 6.8 |
| 7 | 12 | Gavin Helgeson | Mayville | 7.6 |
| 8 | 11 | Zack Becker | Unionville-Sebewaing | 8.6 |
| 9 | 11 | Samuel Shatto | Harbor Beach | 9.4 |
| 10 | 10 | Michael Walsh | Ubly | 10.4 |
| 11 | 11 | Isaac Bignall | Unionville-Sebewaing | 11.3 |
| 12 | 9 | Thijs Van Rijn | Kingston | 12.6 |
| 13 | 11 | Noah Hall | Dryden | 13.5 |
| 14 | 11 | Joel Enos | Mayville | 13.5 |
| 15 | 12 | Ben Gura | New Life Christian Academy | 16.3 |
| 16 | 10 | Nino Perna | Marlette | 17.1 |
| 17 | 10 | Logan Romain | Dryden | 18.0 |
| 18 | 9 | Owen Wruble | Harbor Beach | 18.3 |
| 19 | 9 | Brennan Robinson | Kingston | 18.8 |
| 20 | 11 | Isaac Roggenbuck | Harbor Beach | 21.2 |
| 21 | 11 | Colin Beck | Deckerville | 22.1 |
| 22 | 12 | Sam Keller | New Life Christian Academy | 22.4 |
| 23 | 12 | Christopher Gonzales | Mayville | 24.3 |
| 24 | 12 | Jacob Bulgrien | Harbor Beach | 26.4 |
| 25 | 11 | Caden Meyer | Marlette | 26.7 |
| 26 | 10 | Kole Franzel | Mayville | 27.9 |
| 27 | 12 | Connor Wolff | Dryden | 28.0 |
| 28 | 10 | James Nelson | New Life Christian Academy | 28.3 |
| 29 | 10 | Luke Thomas | Marlette | 28.4 |
| 30 | 9 | Donovan Glasgow | Capac | 28.5 |