The description from the above link was nice and concise, so here you go:
“Yeah, this is a bit of a dead zone in my coverage, and while I’m having fun going back through previous state meet ratings, I do want to throw a little something out there.
This type of track coverage on my end started two years ago and was really honed in on during last spring. Last spring’s version broke down groups by event category, assigned my own version of World Athletics Scores to each time, and then compiling all those to rank each crew.
These are calculated similarly. Thankfully, all the main collegiate events (800m, Mile, 3000m, and 5000m) have World Athletics scores associated.
- For each of those four events, a team’s top times are averaged
- These are up to the top-4, depending on how many of their athletes have competed in the event
- From those averages, the corresponding World Athletics Score is found, then that score is multiplied by the number of athletes from each event
- A school’s top three events are added together and those sums are then ranked
- These are all marks that were on TFRRS as of Sunday night and contain those running for their school (no unattached athletes).
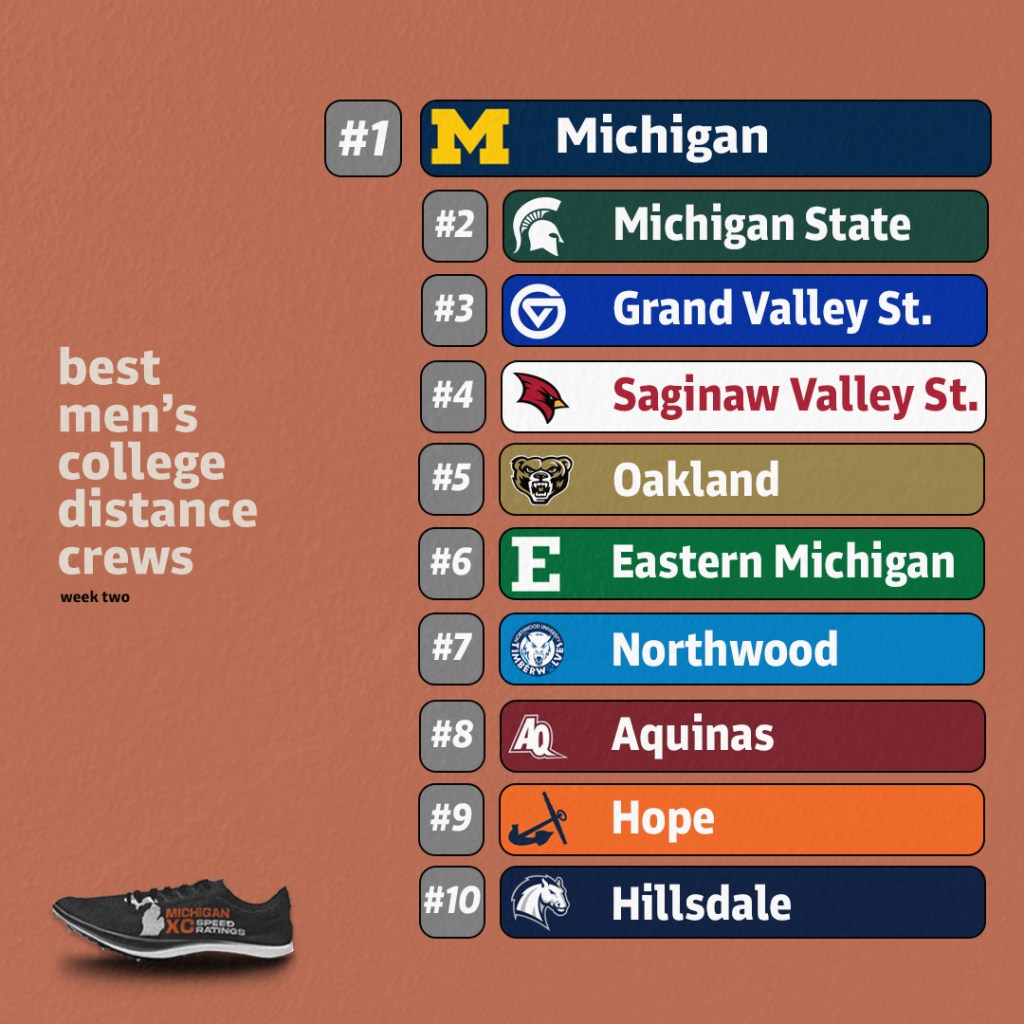
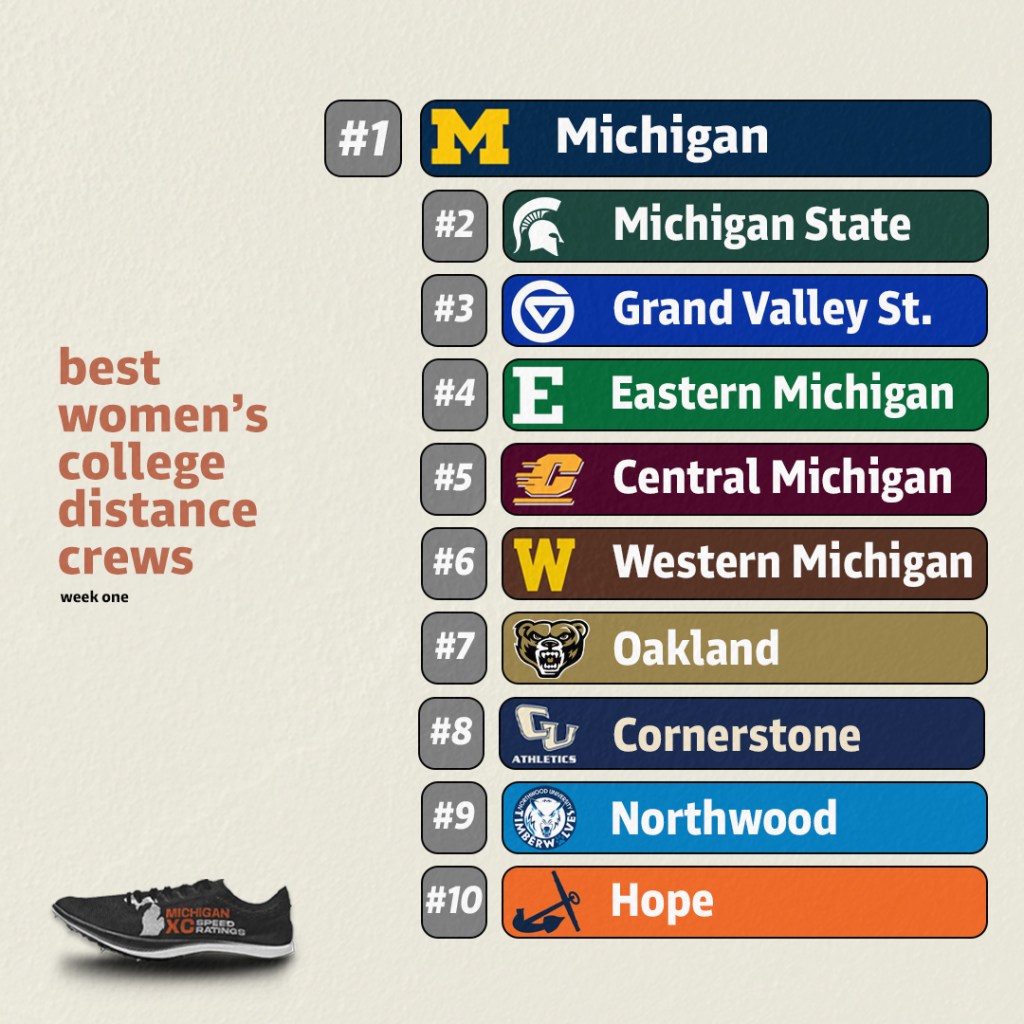
These aren’t predictive in any way, just a calculation based on what has already occurred. Hopefully, they’re a way to show which distance crews punch above their division and highlight which schools specialize in certain events. I’ll be doing these each week, alternating between women and men.“
| Rank | Team | Overall Score | Division | 800m | Mile | 3000m | 5000m |
| 1 | Michigan | 12208 | 1 | 4096 | 4068 | 4044 | 0 |
| 2 | Michigan State | 11972 | 1 | 4072 | 4040 | 3860 | 0 |
| 3 | Grand Valley St. | 11924 | 2 | 3708 | 4004 | 3948 | 3972 |
| 4 | Eastern Michigan | 11524 | 1 | 3864 | 3820 | 3840 | 3588 |
| 5 | Central Michigan | 11372 | 1 | 3680 | 3864 | 3828 | 3608 |
| 6 | Oakland | 10920 | 1 | 3576 | 3512 | 3732 | 3612 |
| 7 | Western Michigan | 10836 | 1 | 3396 | 3720 | 3720 | 2676 |
| 8 | Saginaw Valley | 10580 | 2 | 3576 | 3304 | 3528 | 3476 |
| 9 | Wayne State | 10200 | 2 | 3112 | 3464 | 3420 | 3316 |
| 10 | Northern Michigan | 10016 | 2 | 3280 | 3428 | 3308 | 3260 |
| 11 | Hope | 9816 | 3 | 3204 | 3040 | 3304 | 3308 |
| 12 | Northwood | 9732 | 2 | 1690 | 3340 | 3264 | 3128 |
| 13 | Ferris State | 9472 | 2 | 2298 | 3296 | 2980 | 3196 |
| 14 | Cornerstone | 9368 | NAIA | 2984 | 3144 | 3088 | 3136 |
| 15 | Hillsdale | 9332 | 2 | 3528 | 2840 | 2964 | 2172 |
| 16 | Detroit Mercy | 9152 | 1 | 1272 | 3068 | 3100 | 2984 |
| 17 | Davenport | 9052 | 2 | 2892 | 3164 | 2996 | 2091 |
| 18 | Calvin | 8804 | 3 | 2116 | 3328 | 3360 | 0 |
| 19 | Aquinas | 8752 | NAIA | 3112 | 2796 | 2844 | 0 |
| 20 | Siena Heights | 7960 | NAIA | 2528 | 2496 | 2744 | 2688 |
| 21 | Spring Arbor | 7588 | NAIA | 2272 | 2592 | 2724 | 1974 |
| 22 | Adrian | 7508 | 3 | 2412 | 2516 | 2580 | 0 |
| 23 | Madonna | 7168 | NAIA | 3052 | 2808 | 1308 | 785 |
| 24 | Albion | 6601 | 3 | 2108 | 2396 | 2097 | 1998 |
| 25 | Alma | 6230 | 3 | 2280 | 2240 | 1710 | 0 |
| 26 | Rochester | 6100 | NAIA | 1620 | 2620 | 1860 | 1340 |
| 27 | Concordia | 5864 | NAIA | 2108 | 1916 | 1840 | 836 |
| 28 | Lake Superior State | 5052 | 2 | 2180 | 2336 | 536 | 0 |
| 29 | Olivet | 4504 | 3 | 2440 | 2064 | 0 | 0 |
| 30 | St. Clair County CC | 3531 | NJCAA | 1434 | 1450 | 647 | 0 |
| 31 | Cleary | 2645 | NAIA | 760 | 1118 | 767 | 0 |
| 32 | SW Michigan | 2483 | NJCAA | 0 | 1964 | 519 | 0 |
| 33 | Lawrence Tech | 2433 | NAIA | 852 | 793 | 788 | 786 |
| 34 | Muskegon CC | 2362 | NJCAA | 1576 | 786 | 0 | 0 |
| Rank | Team | Overall Score | Division |
| 1 | Michigan | 12208 | 1 |
| 2 | Michigan State | 11972 | 1 |
| 3 | Eastern Michigan | 11524 | 1 |
| 4 | Central Michigan | 11372 | 1 |
| 5 | Oakland | 10920 | 1 |
| 6 | Western Michigan | 10836 | 1 |
| 7 | Detroit Mercy | 9152 | 1 |
| Rank | Team | Overall Score | Division |
| 1 | Grand Valley St. | 11924 | 2 |
| 2 | Saginaw Valley | 10580 | 2 |
| 3 | Wayne State | 10200 | 2 |
| 4 | Northern Michigan | 10016 | 2 |
| 5 | Northwood | 9732 | 2 |
| 6 | Ferris State | 9472 | 2 |
| 7 | Hillsdale | 9332 | 2 |
| 8 | Davenport | 9052 | 2 |
| 9 | Lake Superior State | 5052 | 2 |
| Rank | Team | Overall Score | Division |
| 1 | Hope | 9816 | 3 |
| 2 | Calvin | 8804 | 3 |
| 3 | Adrian | 7508 | 3 |
| 4 | Albion | 6601 | 3 |
| 5 | Alma | 6230 | 3 |
| 6 | Olivet | 4504 | 3 |
| Rank | Team | Overall Score | Division |
| 1 | Cornerstone | 9368 | NAIA |
| 2 | Aquinas | 8752 | NAIA |
| 3 | Siena Heights | 7960 | NAIA |
| 4 | Spring Arbor | 7588 | NAIA |
| 5 | Madonna | 7168 | NAIA |
| 6 | Rochester | 6100 | NAIA |
| 7 | Concordia | 5864 | NAIA |
| 8 | Cleary | 2645 | NAIA |
| 9 | Lawrence Tech | 2433 | NAIA |
| Rank | Team | Overall Score | Division |
| 1 | St. Clair County CC | 3531 | NJCAA |
| 2 | SW Michigan | 2483 | NJCAA |
| 3 | Muskegon CC | 2362 | NJCAA |
| Team | Event | Athletes | Avg. Time |
| Michigan | 800m | 4 | 2:08.00 |
| Michigan State | 800m | 4 | 2:08.38 |
| Eastern Michigan | 800m | 4 | 2:11.50 |
| Grand Valley St. | 800m | 4 | 2:13.94 |
| Central Michigan | 800m | 4 | 2:14.33 |
| Oakland | 800m | 4 | 2:15.99 |
| Saginaw Valley | 800m | 4 | 2:16.01 |
| Hillsdale | 800m | 4 | 2:16.76 |
| Lawrence Tech | 800m | 1 | 2:18.70 |
| Western Michigan | 800m | 4 | 2:18.91 |
| Northwood | 800m | 2 | 2:19.16 |
| Northern Michigan | 800m | 4 | 2:20.81 |
| Hope | 800m | 4 | 2:22.09 |
| Aquinas | 800m | 4 | 2:23.63 |
| Wayne State | 800m | 4 | 2:23.67 |
| Ferris State | 800m | 3 | 2:24.47 |
| Madonna | 800m | 4 | 2:24.66 |
| Cornerstone | 800m | 4 | 2:25.83 |
| Davenport | 800m | 4 | 2:27.48 |
| St. Clair County CC | 800m | 2 | 2:27.92 |
| Detroit Mercy | 800m | 2 | 2:33.86 |
| Siena Heights | 800m | 4 | 2:34.17 |
| Olivet | 800m | 4 | 2:35.82 |
| Adrian | 800m | 4 | 2:36.39 |
| Alma | 800m | 4 | 2:39.01 |
| Spring Arbor | 800m | 4 | 2:39.14 |
| Lake Superior State | 800m | 4 | 2:41.01 |
| Rochester | 800m | 3 | 2:41.37 |
| Calvin | 800m | 4 | 2:42.29 |
| Albion | 800m | 4 | 2:42.44 |
| Concordia | 800m | 4 | 2:42.48 |
| Muskegon CC | 800m | 4 | 2:54.30 |
| Cleary | 800m | 2 | 2:55.65 |
| Team | Event | Athletes | Avg. Time |
| Michigan | Mile | 4 | 4:44.54 |
| Michigan State | Mile | 4 | 4:45.59 |
| Grand Valley St. | Mile | 4 | 4:46.93 |
| Central Michigan | Mile | 4 | 4:52.09 |
| Eastern Michigan | Mile | 4 | 4:53.72 |
| Western Michigan | Mile | 4 | 4:56.45 |
| Oakland | Mile | 4 | 5:05.53 |
| Wayne State | Mile | 4 | 5:07.40 |
| Northern Michigan | Mile | 4 | 5:08.75 |
| Northwood | Mile | 4 | 5:12.23 |
| Calvin | Mile | 4 | 5:12.72 |
| Saginaw Valley | Mile | 4 | 5:13.74 |
| Ferris State | Mile | 4 | 5:14.13 |
| Lawrence Tech | Mile | 1 | 5:19.09 |
| Davenport | Mile | 4 | 5:19.41 |
| Cornerstone | Mile | 4 | 5:20.27 |
| Detroit Mercy | Mile | 4 | 5:23.43 |
| Hope | Mile | 4 | 5:24.58 |
| St. Clair County CC | Mile | 2 | 5:30.52 |
| Hillsdale | Mile | 4 | 5:33.17 |
| Madonna | Mile | 4 | 5:34.57 |
| Aquinas | Mile | 4 | 5:35.07 |
| Rochester | Mile | 4 | 5:42.89 |
| Spring Arbor | Mile | 4 | 5:44.12 |
| Adrian | Mile | 4 | 5:47.61 |
| Siena Heights | Mile | 4 | 5:48.65 |
| Albion | Mile | 4 | 5:53.32 |
| Lake Superior State | Mile | 4 | 5:56.18 |
| Alma | Mile | 4 | 6:00.69 |
| Cleary | Mile | 2 | 6:00.92 |
| Olivet | Mile | 4 | 6:09.50 |
| SW Michigan | Mile | 4 | 6:14.68 |
| Concordia | Mile | 4 | 6:17.27 |
| Muskegon CC | Mile | 2 | 6:36.26 |
| Team | Event | Athletes | Avg. Time |
| Michigan | 3000m | 4 | 9:28.96 |
| Grand Valley St. | 3000m | 4 | 9:36.42 |
| Michigan State | 3000m | 4 | 9:43.50 |
| Eastern Michigan | 3000m | 4 | 9:45.19 |
| Central Michigan | 3000m | 4 | 9:46.11 |
| Oakland | 3000m | 4 | 9:53.70 |
| Western Michigan | 3000m | 4 | 9:54.72 |
| Saginaw Valley | 3000m | 4 | 10:10.63 |
| Wayne State | 3000m | 4 | 10:19.60 |
| Calvin | 3000m | 4 | 10:24.69 |
| Northern Michigan | 3000m | 4 | 10:29.30 |
| Hope | 3000m | 4 | 10:29.61 |
| Northwood | 3000m | 4 | 10:33.02 |
| Lawrence Tech | 3000m | 1 | 10:43.07 |
| Detroit Mercy | 3000m | 4 | 10:47.60 |
| Cornerstone | 3000m | 4 | 10:48.50 |
| Cleary | 3000m | 1 | 10:50.38 |
| Davenport | 3000m | 4 | 10:56.95 |
| Ferris State | 3000m | 4 | 10:58.25 |
| Hillsdale | 3000m | 4 | 10:59.74 |
| Aquinas | 3000m | 4 | 11:10.66 |
| Albion | 3000m | 3 | 11:15.35 |
| Siena Heights | 3000m | 4 | 11:20.27 |
| Spring Arbor | 3000m | 4 | 11:22.15 |
| Madonna | 3000m | 2 | 11:32.55 |
| St. Clair County CC | 3000m | 1 | 11:35.32 |
| Adrian | 3000m | 4 | 11:36.04 |
| Alma | 3000m | 3 | 12:06.34 |
| Lake Superior State | 3000m | 1 | 12:20.60 |
| SW Michigan | 3000m | 1 | 12:28.03 |
| Rochester | 3000m | 4 | 12:51.87 |
| Concordia | 3000m | 4 | 12:54.21 |
| Team | Event | Athletes | Avg. Time |
| Grand Valley St. | 5000m | 4 | 16:31.31 |
| Oakland | 5000m | 4 | 17:22.72 |
| Central Michigan | 5000m | 4 | 17:23.70 |
| Eastern Michigan | 5000m | 4 | 17:26.43 |
| Western Michigan | 5000m | 3 | 17:29.04 |
| Saginaw Valley | 5000m | 4 | 17:42.94 |
| Wayne State | 5000m | 4 | 18:06.99 |
| Hope | 5000m | 4 | 18:08.16 |
| Northern Michigan | 5000m | 4 | 18:15.95 |
| Ferris State | 5000m | 4 | 18:25.68 |
| Lawrence Tech | 5000m | 1 | 18:33.54 |
| Madonna | 5000m | 1 | 18:34.53 |
| Cornerstone | 5000m | 4 | 18:35.10 |
| Northwood | 5000m | 4 | 18:36.50 |
| Detroit Mercy | 5000m | 4 | 18:59.26 |
| Hillsdale | 5000m | 3 | 19:13.09 |
| Davenport | 5000m | 3 | 19:31.46 |
| Siena Heights | 5000m | 4 | 19:47.71 |
| Rochester | 5000m | 2 | 19:49.36 |
| Albion | 5000m | 3 | 19:52.11 |
| Spring Arbor | 5000m | 3 | 19:57.72 |
| Concordia | 5000m | 2 | 23:00.82 |