Finally, the start of the season we’ve all been waiting for. Throw out all the fast times from September, but apply all the lessons learned through the summer and fall. Regional week is here and with it comes the many projections and previews I’ll write.
Just as last year and throughout the season, I’m projecting these using race simulations. Through a season’s worth of speed ratings, one can determine a runner’s average rating and the variability of those ratings. Both those factors are then weighed towards more recent meets, which are then simulated thousands of times using a Monte Carlo analysis (also described by TullyRunners here). Over those thousands of race simulations, one can determine a team’s average place and average score, a runner’s average place, odds on winning, and odds on qualifying.
These are useful in cross country scenarios, where you have consistent runners and those who are a bit more up and down. For example:
| Tanner Time | Tanner Rating | Tanner Avg. | Tanner StDev. |
| 15:30 | 210 | ||
| 15:45 | 205 | ||
| 16:00 | 200 | ||
| 16:15 | 195 | ||
| 16:30 | 190 | 200 | 7.91 |
| MIXCSR Time | MIXCSR Rating | MIXCSR Avg. | MIXCSR StDev. |
| 16:09 | 197 | ||
| 16:12 | 196 | ||
| 16:15 | 195 | ||
| 16:18 | 194 | ||
| 16:21 | 193 | 195 | 1.58 |
Jacob at his best might be faster than I in four of the five races during the season. I’d almost never be All-State in Division 1, but he might contend for a top-5 spot or place 60th.
If we did 20 simulations, this is how it might turn out:
| Race | Tanner Avg. | Tanner StDev | Tanner Rating | MIXCSR Avg. | MIXCSR StDev | MIXCSR Rating |
| 1 | 200 | 7.9 | 202.1 | 195 | 1.6 | 195.6 |
| 2 | 200 | 7.9 | 196.2 | 195 | 1.6 | 194.1 |
| 3 | 200 | 7.9 | 190.0 | 195 | 1.6 | 199.2 |
| 4 | 200 | 7.9 | 193.4 | 195 | 1.6 | 192.5 |
| 5 | 200 | 7.9 | 206.8 | 195 | 1.6 | 195.7 |
| 6 | 200 | 7.9 | 201.8 | 195 | 1.6 | 196.1 |
| 7 | 200 | 7.9 | 171.6 | 195 | 1.6 | 194.9 |
| 8 | 200 | 7.9 | 189.2 | 195 | 1.6 | 195.9 |
| 9 | 200 | 7.9 | 205.5 | 195 | 1.6 | 197.0 |
| 10 | 200 | 7.9 | 203.8 | 195 | 1.6 | 192.6 |
| 11 | 200 | 7.9 | 192.3 | 195 | 1.6 | 196.5 |
| 12 | 200 | 7.9 | 196.9 | 195 | 1.6 | 196.4 |
| 13 | 200 | 7.9 | 198.5 | 195 | 1.6 | 195.6 |
| 14 | 200 | 7.9 | 203.2 | 195 | 1.6 | 194.1 |
| 15 | 200 | 7.9 | 193.9 | 195 | 1.6 | 192.6 |
| 16 | 200 | 7.9 | 199.3 | 195 | 1.6 | 193.2 |
| 17 | 200 | 7.9 | 208.7 | 195 | 1.6 | 194.2 |
| 18 | 200 | 7.9 | 213.7 | 195 | 1.6 | 194.6 |
| 19 | 200 | 7.9 | 212.6 | 195 | 1.6 | 197.1 |
| 20 | 200 | 7.9 | 206.3 | 195 | 1.6 | 193.9 |
I’d win four times, but I’d never have the ability to win a title like he had in Race 18. He’s usually All-State, but may cost his team a title through his effort in Race 7.
The simulations give the possibilities of those scenarios and all the various scoring scripts. A sixth girl that can pop off on any certain day, a reliable boy who always runs 17-flat, you name it. Hopefully, they better elucidate our contenders, qualifiers, and how these races play out over the weekend.
But always remember, races aren’t run on paper or on a computer. These projections are meant to better our sport, give more attention where little is given. Although I take pride in their accuracy, this endeavor would be quite boring if it were always perfect. I look forward to these being proven wrong and I expect to hear about it as well.
GIRLS
Ranked Teams
#4 East Grand Rapids
#17 Middleville Thornapple-Kellogg
#21 Forest Hills Eastern
#24 Grand Rapids South Christian
Projected Individual Qualifier Cutoff
15th place.
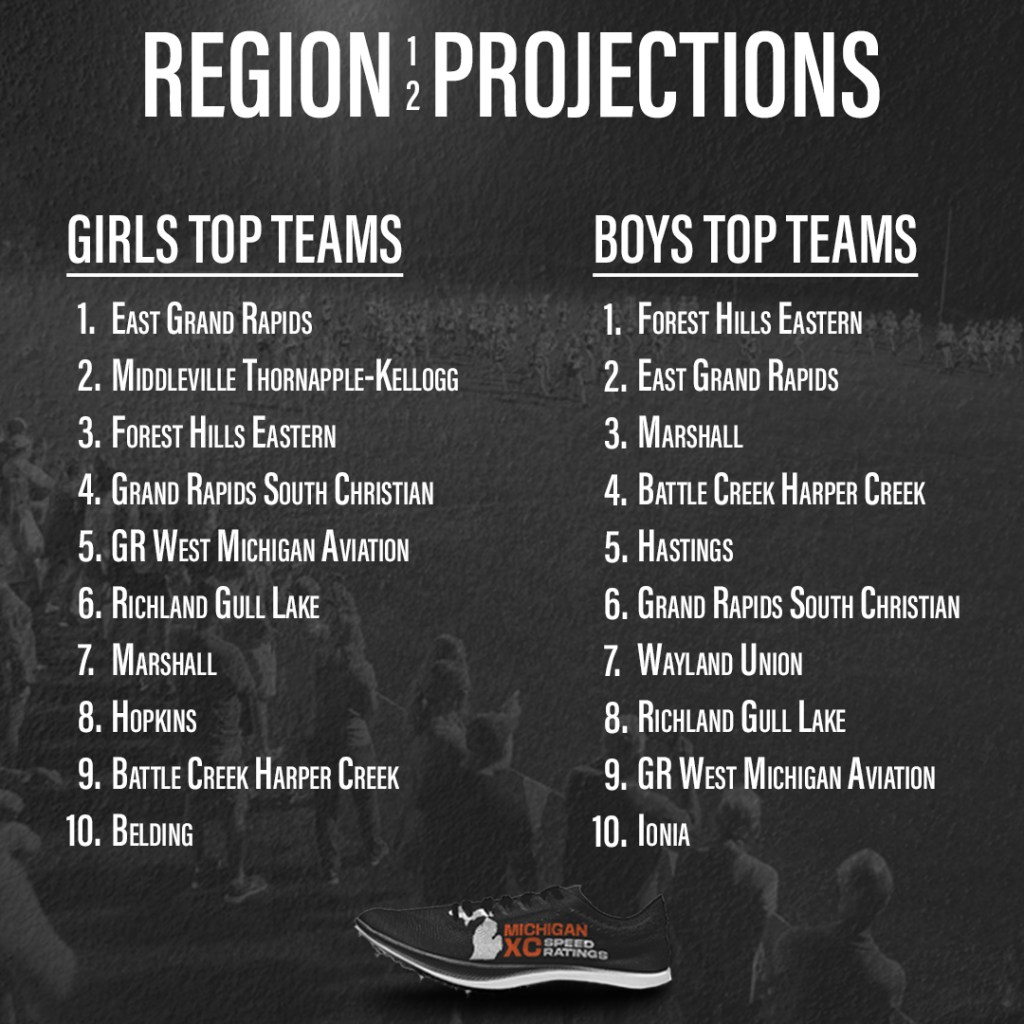
| Projected Place | Team | Avg. Score | Avg. Place | Win % | Top 3 % |
| 1 | East Grand Rapids | 42 | 1.0 | 95+ | 95+ |
| 2 | Middleville Thornapple-Kellogg | 92 | 2.2 | 95+ | |
| 3 | Forest Hills Eastern | 106 | 3.3 | 63 | |
| 4 | Grand Rapids South Christian | 108 | 3.5 | 41 | |
| 5 | GR West Michigan Aviation | 136 | 4.9 | ||
| 6 | Richland Gull Lake | 195 | 6.6 | ||
| 7 | Marshall | 207 | 7.6 | ||
| 8 | Hopkins | 214 | 8.0 | ||
| 9 | Battle Creek Harper Creek | 218 | 8.2 | ||
| 10 | Belding | 239 | 9.6 | ||
| 11 | Portland | 272 | 11.0 | ||
| 12 | Hastings | 339 | 12.0 | ||
| 13 | Wayland Union | 397 | 13.2 | ||
| 14 | Lake Odessa Lakewood | 412 | 13.8 |

| Projected Place | Grade | Name | Team | Avg. Place |
| 1 | 12 | Drew Muller | East Grand Rapids | 1.0 |
| 2 | 11 | Sadey Seyferth | East Grand Rapids | 2.0 |
| 3 | 12 | Addison Washler | Forest Hills Eastern | 4.7 |
| 4 | 11 | Ava Crews | Middleville Thornapple-Kellogg | 5.1 |
| 5 | 12 | Emma DeVries | GR West Michigan Aviation | 5.3 |
| 6 | 12 | Camille DeCola | Marshall | 5.7 |
| 7 | 9 | Caroline Randall | Hastings | 6.4 |
| 8 | 9 | Adeline Armstrong | East Grand Rapids | 7.5 |
| 9 | 12 | Ellia Agar | Grand Rapids South Christian | 7.8 |
| 10 | 10 | Jillian Clason | Forest Hills Eastern | 11.5 |
| 11 | 9 | Lane Isom | Richland Gull Lake | 12.2 |
| 12 | 10 | Madelyn Baar | East Grand Rapids | 12.5 |
| 13 | 9 | Ainsley Sullivan | Forest Hills Eastern | 14.5 |
| 14 | 12 | Jaeden Harshberger | Hopkins | 16.1 |
| 15 | 9 | Meghan-Jane Skidmore | Middleville Thornapple-Kellogg | 19.3 |
| 16 | 12 | Emma Monroe | Battle Creek Harper Creek | 19.4 |
| 17 | 9 | Ellie Harmon | Middleville Thornapple-Kellogg | 19.7 |
| 18 | 10 | Rory Workman | East Grand Rapids | 20.5 |
| 19 | 11 | Desiree Duque-Rico | GR West Michigan Aviation | 20.9 |
| 20 | 11 | Avery Wezensky | Portland | 21.0 |
| 21 | 11 | Rachel Berkenpas | Grand Rapids South Christian | 23.2 |
| 22 | 10 | Catherine Schellhammer | East Grand Rapids | 23.6 |
| 23 | 10 | Madison Kietzman | Middleville Thornapple-Kellogg | 24.6 |
| 24 | 9 | Peyton Hardy | Middleville Thornapple-Kellogg | 25.5 |
| 25 | 10 | Chloe Rinzema | Grand Rapids South Christian | 25.5 |
| 26 | 11 | Kambria Moored | Hopkins | 26.8 |
| 27 | 11 | Mackenzie Zahm | Belding | 27.3 |
| 28 | 12 | Riley VanderLaan | Grand Rapids South Christian | 28.1 |
| 29 | 10 | Leah McPartlin | Marshall | 28.6 |
| 30 | 11 | Quincy Stiffler | East Grand Rapids | 30.0 |
BOYS
Ranked Teams
#1 Forest Hills Eastern
#4 East Grand Rapids
#8 Marshall
Projected Individual Qualifier Cutoff
You throw three top-8 teams in a region and you get a potential 23rd place qualifier.
| Projected Place | Team | Avg. Score | Avg. Place | Win % | Top 3 % |
| 1 | Forest Hills Eastern | 39 | 1.0 | 95+ | 95+ |
| 2 | East Grand Rapids | 51 | 2.0 | 95+ | |
| 3 | Marshall | 84 | 3.0 | 95+ | |
| 4 | Battle Creek Harper Creek | 158 | 4.1 | ||
| 5 | Hastings | 191 | 5.5 | ||
| 6 | Grand Rapids South Christian | 194 | 5.7 | ||
| 7 | Wayland Union | 221 | 8.0 | ||
| 8 | Richland Gull Lake | 223 | 8.1 | ||
| 9 | GR West Michigan Aviation | 226 | 8.4 | ||
| 10 | Ionia | 235 | 9.2 | ||
| 11 | Middleville Thornapple-Kellogg | 302 | 11.3 | ||
| 12 | Belding | 326 | 12.3 | ||
| 13 | Portland | 330 | 12.6 | ||
| 14 | Hopkins | 356 | 13.9 | ||
| 15 | Lake Odessa Lakewood | 421 | 15.2 | ||
| 16 | Battle Creek Pennfield | 437 | 15.9 |

| Projected Place | Grade | Name | Team | Avg. Place |
| 1 | 12 | Alex Thole | East Grand Rapids | 1.4 |
| 2 | 11 | Jack Bidwell | Marshall | 1.9 |
| 3 | 11 | Henry Dixon | Forest Hills Eastern | 3.7 |
| 4 | 12 | Brendan Hoving | Forest Hills Eastern | 4.9 |
| 5 | 10 | Jonah Workman | East Grand Rapids | 5.8 |
| 6 | 12 | Liam Hinman | Forest Hills Eastern | 6.0 |
| 7 | 12 | Ryan Brinker | East Grand Rapids | 6.4 |
| 8 | 11 | Dominic Lowrie | Battle Creek Harper Creek | 6.9 |
| 9 | 12 | Cooper Jacobsen | Forest Hills Eastern | 9.3 |
| 10 | 12 | Connor Griffith | Marshall | 9.5 |
| 11 | 12 | Jacob Montgomery | Ionia | 11.6 |
| 12 | 12 | Lucas Van Meter | Middleville Thornapple-Kellogg | 14.2 |
| 13 | 11 | Reece Davis | Marshall | 15.1 |
| 14 | 12 | Tate Miller | Forest Hills Eastern | 15.9 |
| 15 | 10 | Jack Edison | East Grand Rapids | 16.1 |
| 16 | 12 | William O’Dell | Battle Creek Harper Creek | 16.5 |
| 17 | 10 | Gavin Markucki | Richland Gull Lake | 17.6 |
| 18 | 9 | Abraham McHugh | Marshall | 18.7 |
| 19 | 11 | Dylan Pallett | Wayland Union | 18.7 |
| 20 | 12 | Davis Christy | East Grand Rapids | 21.9 |
| 21 | 12 | Luke Ueland | Forest Hills Eastern | 22.0 |
| 22 | 11 | Tyler Endres | Forest Hills Eastern | 22.7 |
| 23 | 12 | Riley Shults | Hastings | 22.9 |
| 24 | 11 | Brandon Simmons | Hastings | 23.1 |
| 25 | 10 | Jeryn Frisbie | Belding | 24.9 |
| 26 | 12 | Isaac Dyer | Wayland Union | 25.4 |
| 27 | 10 | Thad VanderLaan | Grand Rapids South Christian | 27.2 |
| 28 | 10 | Jack Estelle | Hopkins | 28.9 |
| 29 | 10 | Cooper Gardner | Battle Creek Harper Creek | 28.9 |
| 30 | 10 | Finn Tauren | Richland Gull Lake | 29.1 |