Finally, the start of the season we’ve all been waiting for. Throw out all the fast times from September, but apply all the lessons learned through the summer and fall. Regional week is here and with it comes the many projections and previews I’ll write.
Just as last year and throughout the season, I’m projecting these using race simulations. Through a season’s worth of speed ratings, one can determine a runner’s average rating and the variability of those ratings. Both those factors are then weighed towards more recent meets, which are then simulated thousands of times using a Monte Carlo analysis (also described by TullyRunners here). Over those thousands of race simulations, one can determine a team’s average place and average score, a runner’s average place, odds on winning, and odds on qualifying.
These are useful in cross country scenarios, where you have consistent runners and those who are a bit more up and down. For example:
| Tanner Time | Tanner Rating | Tanner Avg. | Tanner StDev. |
| 15:30 | 210 | ||
| 15:45 | 205 | ||
| 16:00 | 200 | ||
| 16:15 | 195 | ||
| 16:30 | 190 | 200 | 7.91 |
| MIXCSR Time | MIXCSR Rating | MIXCSR Avg. | MIXCSR StDev. |
| 16:09 | 197 | ||
| 16:12 | 196 | ||
| 16:15 | 195 | ||
| 16:18 | 194 | ||
| 16:21 | 193 | 195 | 1.58 |
Jacob at his best might be faster than I in four of the five races during the season. I’d almost never be All-State in Division 1, but he might contend for a top-5 spot or place 60th.
If we did 20 simulations, this is how it might turn out:
| Race | Tanner Avg. | Tanner StDev | Tanner Rating | MIXCSR Avg. | MIXCSR StDev | MIXCSR Rating |
| 1 | 200 | 7.9 | 202.1 | 195 | 1.6 | 195.6 |
| 2 | 200 | 7.9 | 196.2 | 195 | 1.6 | 194.1 |
| 3 | 200 | 7.9 | 190.0 | 195 | 1.6 | 199.2 |
| 4 | 200 | 7.9 | 193.4 | 195 | 1.6 | 192.5 |
| 5 | 200 | 7.9 | 206.8 | 195 | 1.6 | 195.7 |
| 6 | 200 | 7.9 | 201.8 | 195 | 1.6 | 196.1 |
| 7 | 200 | 7.9 | 171.6 | 195 | 1.6 | 194.9 |
| 8 | 200 | 7.9 | 189.2 | 195 | 1.6 | 195.9 |
| 9 | 200 | 7.9 | 205.5 | 195 | 1.6 | 197.0 |
| 10 | 200 | 7.9 | 203.8 | 195 | 1.6 | 192.6 |
| 11 | 200 | 7.9 | 192.3 | 195 | 1.6 | 196.5 |
| 12 | 200 | 7.9 | 196.9 | 195 | 1.6 | 196.4 |
| 13 | 200 | 7.9 | 198.5 | 195 | 1.6 | 195.6 |
| 14 | 200 | 7.9 | 203.2 | 195 | 1.6 | 194.1 |
| 15 | 200 | 7.9 | 193.9 | 195 | 1.6 | 192.6 |
| 16 | 200 | 7.9 | 199.3 | 195 | 1.6 | 193.2 |
| 17 | 200 | 7.9 | 208.7 | 195 | 1.6 | 194.2 |
| 18 | 200 | 7.9 | 213.7 | 195 | 1.6 | 194.6 |
| 19 | 200 | 7.9 | 212.6 | 195 | 1.6 | 197.1 |
| 20 | 200 | 7.9 | 206.3 | 195 | 1.6 | 193.9 |
I’d win four times, but I’d never have the ability to win a title like he had in Race 18. He’s usually All-State, but may cost his team a title through his effort in Race 7.
The simulations give the possibilities of those scenarios and all the various scoring scripts. A sixth girl that can pop off on any certain day, a reliable boy who always runs 17-flat, you name it. Hopefully, they better elucidate our contenders, qualifiers, and how these races play out over the weekend.
But always remember, races aren’t run on paper or on a computer. These projections are meant to better our sport, give more attention where little is given. Although I take pride in their accuracy, this endeavor would be quite boring if it were always perfect. I look forward to these being proven wrong and I expect to hear about it as well.
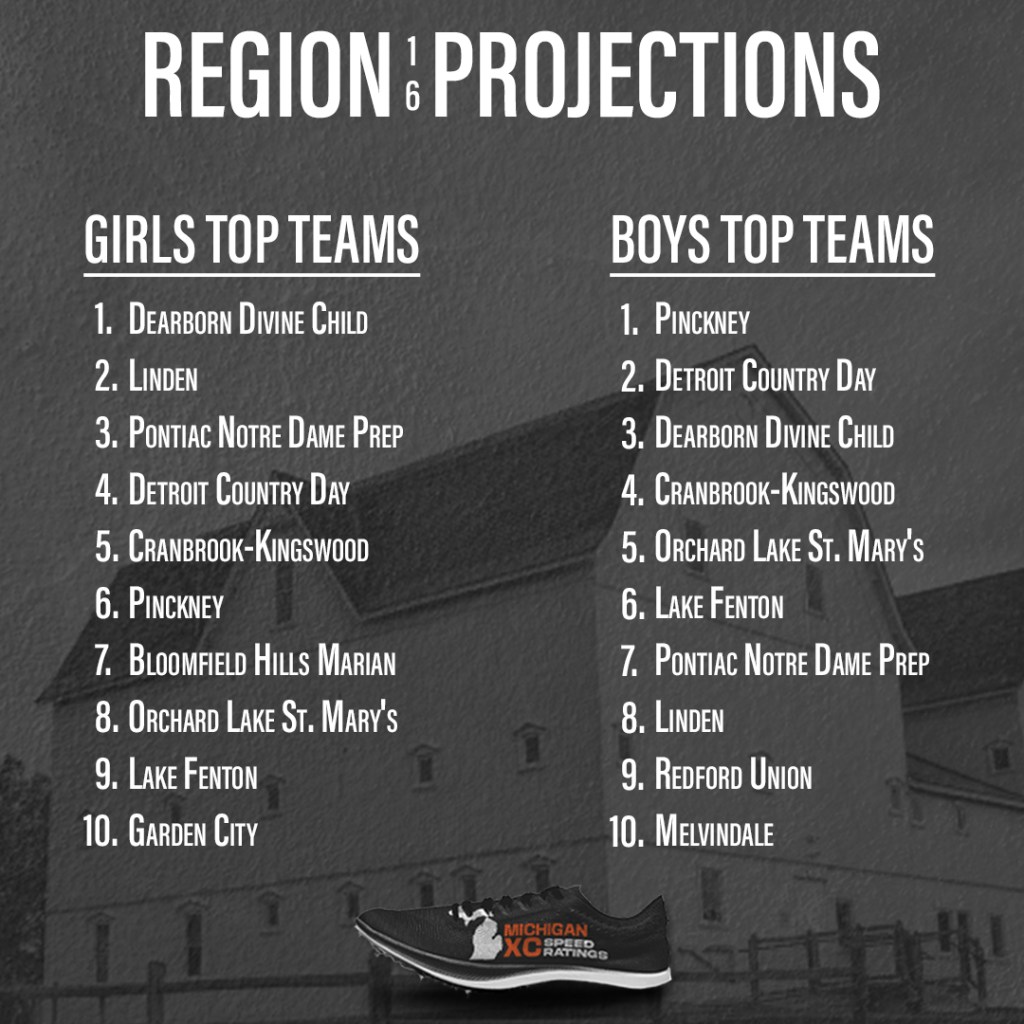
GIRLS
Ranked Teams
#16 Linden
#18 Dearborn Divine Child
#26 Pontiac Notre Dame Prep
Projected Individual Qualifier Cutoff
18th place.
| Projected Place | Team | Avg. Score | Avg. Place | Win % | Top 3 % |
| 1 | Dearborn Divine Child | 54 | 1.4 | 61 | 95+ |
| 2 | Linden | 56 | 1.6 | 39 | 95+ |
| 3 | Pontiac Notre Dame Prep | 80 | 3.0 | 95+ | |
| 4 | Detroit Country Day | 118 | 4.0 | ||
| 5 | Bloomfield Hills Cranbrook-Kingswood | 158 | 5.9 | ||
| 6 | Pinckney | 160 | 6.2 | ||
| 7 | Bloomfield Hills Marian | 169 | 6.9 | ||
| 8 | Orchard Lake St. Mary’s | 177 | 7.6 | ||
| 9 | Lake Fenton | 186 | 8.4 | ||
| 10 | Garden City | 320 | 10.0 | ||
| 11 | Detroit Cody | 362 | 11.0 | ||
| 12 | Dearborn Henry Ford Academy | 380 | 12.0 |

| Projected Place | Grade | Name | Team | Avg. Place |
| 1 | 11 | Mea D’Agostino | Orchard Lake St. Mary’s | 1.6 |
| 2 | 9 | Jaelyn Ray | Pinckney | 2.2 |
| 3 | 11 | Maria Nunning | Pontiac Notre Dame Prep | 3.4 |
| 4 | 11 | Chloe Josephson | Linden | 3.7 |
| 5 | 12 | Kirsten Koss | Dearborn Divine Child | 6.5 |
| 6 | 11 | Kathryn Kurtinaitis | Dearborn Divine Child | 7.6 |
| 7 | 9 | Melody Meckstroth | Linden | 7.9 |
| 8 | 11 | Kayla Slade | Dearborn Divine Child | 9.5 |
| 9 | 9 | Diya Goyal | Bloomfield Hills Cranbrook-Kingswood | 9.9 |
| 10 | 10 | Anna Kujansuu | Dearborn Divine Child | 10.6 |
| 11 | 11 | Nell Stover | Detroit Country Day | 12.5 |
| 12 | 9 | Addison Josephson | Linden | 12.6 |
| 13 | 11 | Skylar Vanhecke | Pontiac Notre Dame Prep | 12.9 |
| 14 | 9 | Sidney Shepard | Linden | 14.6 |
| 15 | 11 | Claire Heller | Detroit Country Day | 14.7 |
| 16 | 9 | Claire Dunn | Pontiac Notre Dame Prep | 15.3 |
| 17 | 12 | Reagan Brooks | Linden | 17.4 |
| 18 | 12 | Molly O’Brien | Bloomfield Hills Marian | 18.9 |
| 19 | 11 | Mary Larocca | Pontiac Notre Dame Prep | 19.3 |
| 20 | 9 | Elliana Hufton | Lake Fenton | 19.9 |
| 21 | 11 | Kate Paluszewski | Dearborn Divine Child | 21.4 |
| 22 | 12 | Chloe Kurschat | Bloomfield Hills Cranbrook-Kingswood | 22.2 |
| 23 | 12 | Ava Fahrenkopf | Linden | 23.2 |
| 24 | 11 | Madalynn Karsies | Pinckney | 24.7 |
| 25 | 10 | Elizabeth Salinas | Dearborn Divine Child | 26.3 |
| 26 | 9 | Georgia Hopkins | Detroit Country Day | 26.3 |
| 27 | 11 | Jillian Wygonik | Dearborn Divine Child | 27.5 |
| 28 | 12 | Kaitlyn Hatfield | Lake Fenton | 28.8 |
| 29 | 9 | Lucille Clark | Bloomfield Hills Marian | 29.9 |
| 30 | 9 | Charlotte Hartley | Detroit Country Day | 31.9 |
BOYS
Ranked Teams
#5 Pinckney
Projected Individual Qualifier Cutoff
19th Place.
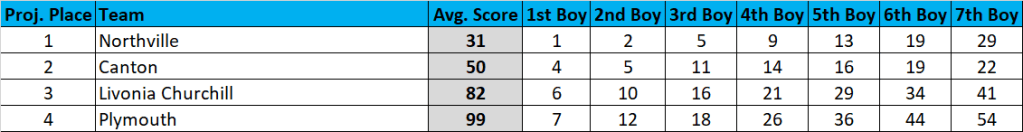
| Projected Place | Team | Avg. Score | Avg. Place | Win % | Top 3 % |
| 1 | Pinckney | 28 | 1.0 | 95+ | 95+ |
| 2 | Detroit Country Day | 103 | 2.4 | 95+ | |
| 3 | Dearborn Divine Child | 108 | 2.9 | 84 | |
| 4 | Bloomfield Hills Cranbrook-Kingswood | 124 | 4.1 | 21 | |
| 5 | Orchard Lake St. Mary’s | 133 | 4.8 | ||
| 6 | Lake Fenton | 156 | 6.2 | ||
| 7 | Pontiac Notre Dame Prep | 169 | 7.1 | ||
| 8 | Linden | 177 | 7.6 | ||
| 9 | Redford Union | 250 | 9.0 | ||
| 10 | Melvindale | 298 | 10.1 | ||
| 11 | Dearborn Henry Ford Academy | 316 | 11.1 | ||
| 12 | Garden City | 325 | 11.8 | ||
| 13 | Detroit Henry Ford | 368 | 13.0 | ||
| 14 | Detroit Southeastern Tech | 417 | 14.0 | ||
| 15 | Detroit Cody | 473 | 15.0 |

| Projected Place | Grade | Name | Team | Avg. Place |
| 1 | 12 | Evan Loughridge | Pinckney | 1.3 |
| 2 | 12 | Solomon Kwartowitz | Bloomfield Hills Cranbrook-Kingswood | 3.1 |
| 3 | 11 | Colin Murray | Dearborn Divine Child | 3.3 |
| 4 | 12 | Nolan Pinion | Lake Fenton | 4.5 |
| 5 | 12 | Paul Moore | Pinckney | 4.6 |
| 6 | 12 | Ethan Sandula | Pinckney | 5.2 |
| 7 | 11 | Jacob Hopkins | Detroit Country Day | 7.9 |
| 8 | 9 | Cole McCraw | Pinckney | 9.3 |
| 9 | 12 | Joshua Simpson | Orchard Lake St. Mary’s | 9.9 |
| 10 | 12 | Arnot Heller | Detroit Country Day | 10.0 |
| 11 | 11 | Zach Newman | Pinckney | 11.6 |
| 12 | 11 | Kyle Osborne | Pinckney | 12.2 |
| 13 | 12 | Parker Hays | Pinckney | 12.7 |
| 14 | 11 | Isaak Brook | Pontiac Notre Dame Prep | 13.5 |
| 15 | 12 | Ian Martin | Linden | 13.7 |
| 16 | 11 | Tamer Zahr | Dearborn Divine Child | 17.0 |
| 17 | 9 | Omar Elbashir | Detroit Country Day | 17.6 |
| 18 | 12 | Eric Shan | Bloomfield Hills Cranbrook-Kingswood | 18.9 |
| 19 | 12 | Eamon Kennedy | Dearborn Henry Ford Academy | 20.2 |
| 20 | 10 | Jake Yono | Orchard Lake St. Mary’s | 20.6 |
| 21 | 9 | Cooper Steckroth | Lake Fenton | 21.3 |
| 22 | 10 | Bela Matyus | Orchard Lake St. Mary’s | 21.5 |
| 23 | 11 | Blaise Gooding | Linden | 23.3 |
| 24 | 11 | Nicholas Nakic | Dearborn Divine Child | 25.7 |
| 25 | 11 | Ryan Wojichowski | Pontiac Notre Dame Prep | 27.3 |
| 26 | 11 | Alex Kitsopanidis | Detroit Country Day | 27.6 |
| 27 | 11 | Jaime Saucedo | Melvindale | 27.7 |
| 28 | 12 | Krish Kalmadi | Bloomfield Hills Cranbrook-Kingswood | 28.0 |
| 29 | 11 | Maximiliano Juarez | Dearborn Divine Child | 30.6 |
| 30 | 12 | Joshua Sharp-Pelto | Garden City | 31.2 |
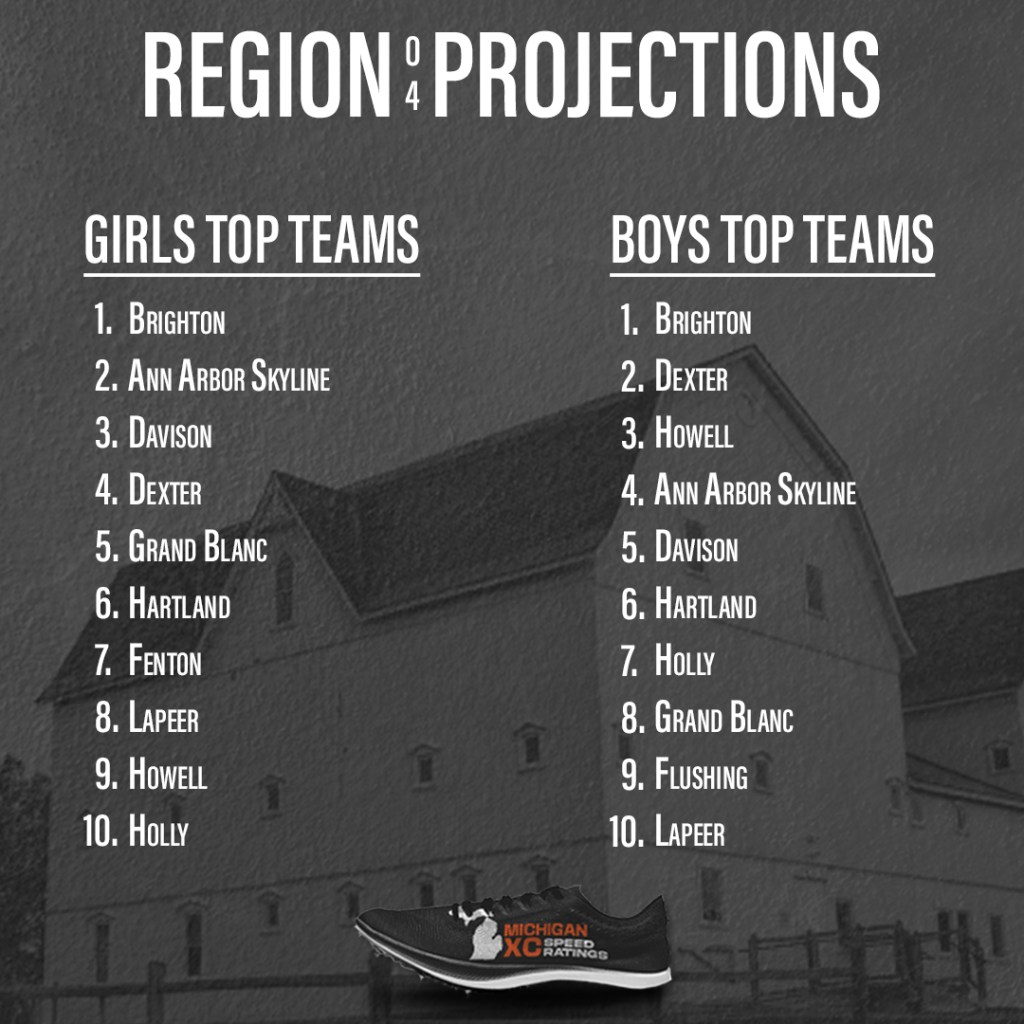
GIRLS
Ranked Teams
#3 Brighton
#13 Ann Arbor Skyline
#15 Davison
#20 Dexter
Projected Individual Qualifier Cutoff
Anywhere from 20th to 22nd place.
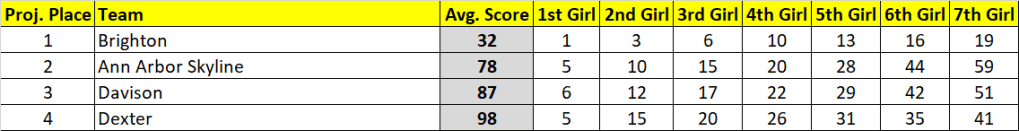
| Projected Place | Team | Avg. Score | Avg. Place | Win % | Top 3 % |
| 1 | Brighton | 32 | 1.0 | 95+ | 95+ |
| 2 | Ann Arbor Skyline | 78 | 2.4 | 91 | |
| 3 | Davison | 87 | 2.9 | 81 | |
| 4 | Dexter | 98 | 3.7 | 28 | |
| 5 | Grand Blanc | 125 | 5.3 | ||
| 6 | Hartland | 131 | 5.7 | ||
| 7 | Fenton | 171 | 7.0 | ||
| 8 | Lapeer | 255 | 8.5 | ||
| 9 | Howell | 260 | 8.8 | ||
| 10 | Holly | 280 | 10.0 | ||
| 11 | Flushing | 296 | 10.7 | ||
| 12 | Swartz Creek | 372 | 12.0 |
| Projected Place | Grade | Name | Team | Avg. Place |
| 1 | 10 | Lydia LaMarra | Brighton | 2.8 |
| 2 | 11 | Elle Bissett | Brighton | 3.8 |
| 3 | 12 | Carrigan Eberly | Brighton | 4.0 |
| 4 | 11 | Grace Tykocki | Grand Blanc | 4.3 |
| 5 | 11 | Alena Blumberg | Dexter | 5.5 |
| 6 | 12 | Allison Mayer | Ann Arbor Skyline | 6.1 |
| 7 | 12 | Paige McArdle | Davison | 7.3 |
| 8 | 9 | Ava Goodman | Hartland | 9.7 |
| 9 | 12 | Nina Frost | Fenton | 10.4 |
| 10 | 10 | Juliet Lewis | Brighton | 10.7 |
| 11 | 9 | Becca van Lent | Ann Arbor Skyline | 10.8 |
| 12 | 12 | Sydney Smith | Davison | 13.8 |
| 13 | 12 | Gabrielle Bolitho | Brighton | 14.0 |
| 14 | 12 | Megan Kowalski | Brighton | 14.7 |
| 15 | 10 | Nevaeh Polovina | Davison | 15.5 |
| 16 | 9 | Irie Scrase | Ann Arbor Skyline | 16.4 |
| 17 | 11 | Addison Bruckman | Dexter | 17.7 |
| 18 | 12 | Nikki Carothers | Brighton | 17.7 |
| 19 | 11 | Annabel O’Haver | Dexter | 18.8 |
| 20 | 9 | Becca vanLent | Ann Arbor Skyline | 19.9 |
| 21 | 12 | Brooke Lemos | Davison | 22.7 |
| 22 | 10 | Reese Canada | Fenton | 24.2 |
| 23 | 12 | Samantha Wogaman | Grand Blanc | 25.0 |
| 24 | 11 | Ayla Balazer | Ann Arbor Skyline | 25.1 |
| 25 | 12 | Samantha Shaver | Grand Blanc | 25.5 |
| 26 | 9 | Kodie Snyder | Dexter | 26.2 |
| 27 | 10 | Elliana Neuer | Hartland | 26.8 |
| 28 | 9 | Brooklyn Wiltse | Davison | 27.7 |
| 29 | 11 | Zoe Howard | Hartland | 29.4 |
| 30 | 10 | Sarah Albright | Grand Blanc | 30.3 |
BOYS
Ranked Teams
#2 Brighton
Projected Individual Qualifier Cutoff
20th place.
| Projected Place | Team | Avg. Score | Avg. Place | Win % | Top 3 % |
| 1 | Brighton | 32 | 1.0 | 95+ | 95+ |
| 2 | Dexter | 88 | 2.3 | 95+ | |
| 3 | Howell | 95 | 2.8 | 95+ | |
| 4 | Ann Arbor Skyline | 127 | 4.4 | ||
| 5 | Davison | 136 | 4.7 | ||
| 6 | Hartland | 161 | 5.8 | ||
| 7 | Holly | 209 | 7.3 | ||
| 8 | Grand Blanc | 230 | 8.3 | ||
| 9 | Flushing | 238 | 8.8 | ||
| 10 | Lapeer | 256 | 9.8 | ||
| 11 | Fenton | 279 | 11.2 | ||
| 12 | Swartz Creek | 287 | 11.7 | ||
| 13 | Jackson | 358 | 13.0 |
| Projected Place | Grade | Name | Team | Avg. Place |
| 1 | 12 | Brandon Anderson | Dexter | 2.2 |
| 2 | 12 | Tyler Langley | Brighton | 3.1 |
| 3 | 12 | Luke Suliman | Ann Arbor Skyline | 4.2 |
| 4 | 9 | Jack MacGregor | Howell | 4.3 |
| 5 | 12 | Iain Forrest | Davison | 4.5 |
| 6 | 12 | Luke Campbell | Brighton | 4.9 |
| 7 | 11 | Brady Millington | Brighton | 7.7 |
| 8 | 11 | Tyler Brock | Brighton | 8.4 |
| 9 | 11 | Elijah Forbord | Brighton | 10.3 |
| 10 | 11 | Tyler Outlaw | Brighton | 10.5 |
| 11 | 12 | Mason Jett | Ann Arbor Skyline | 10.6 |
| 12 | 12 | Bode Cooper | Brighton | 11.9 |
| 13 | 11 | James Latstetter | Flushing | 13.7 |
| 14 | 11 | Julian Linebaugh | Dexter | 15.4 |
| 15 | 11 | Jacob Essenmacher | Lapeer | 16.5 |
| 16 | 11 | Lucas Wood | Howell | 17.3 |
| 17 | 11 | Caleb Snyder | Dexter | 17.4 |
| 18 | 12 | Carson Cook | Hartland | 18.2 |
| 19 | 11 | Drake Wallace | Howell | 20.6 |
| 20 | 11 | Jacob Huntoon | Fenton | 23.2 |
| 21 | 10 | Griffin Good | Flushing | 25.1 |
| 22 | 11 | Maxwell Merrill | Grand Blanc | 25.6 |
| 23 | 12 | Gavin Smith | Davison | 25.7 |
| 24 | 12 | Noah DeLand | Howell | 26.4 |
| 25 | 12 | Liam Hoover | Howell | 26.9 |
| 26 | 9 | Trevor Murphy | Holly | 27.2 |
| 27 | 10 | Bruno Cifaldi | Ann Arbor Skyline | 27.4 |
| 28 | 11 | Elijah Smith | Dexter | 28.2 |
| 29 | 11 | Scott Smith | Dexter | 28.6 |
| 30 | 12 | Anthony Maini | Fenton | 28.9 |