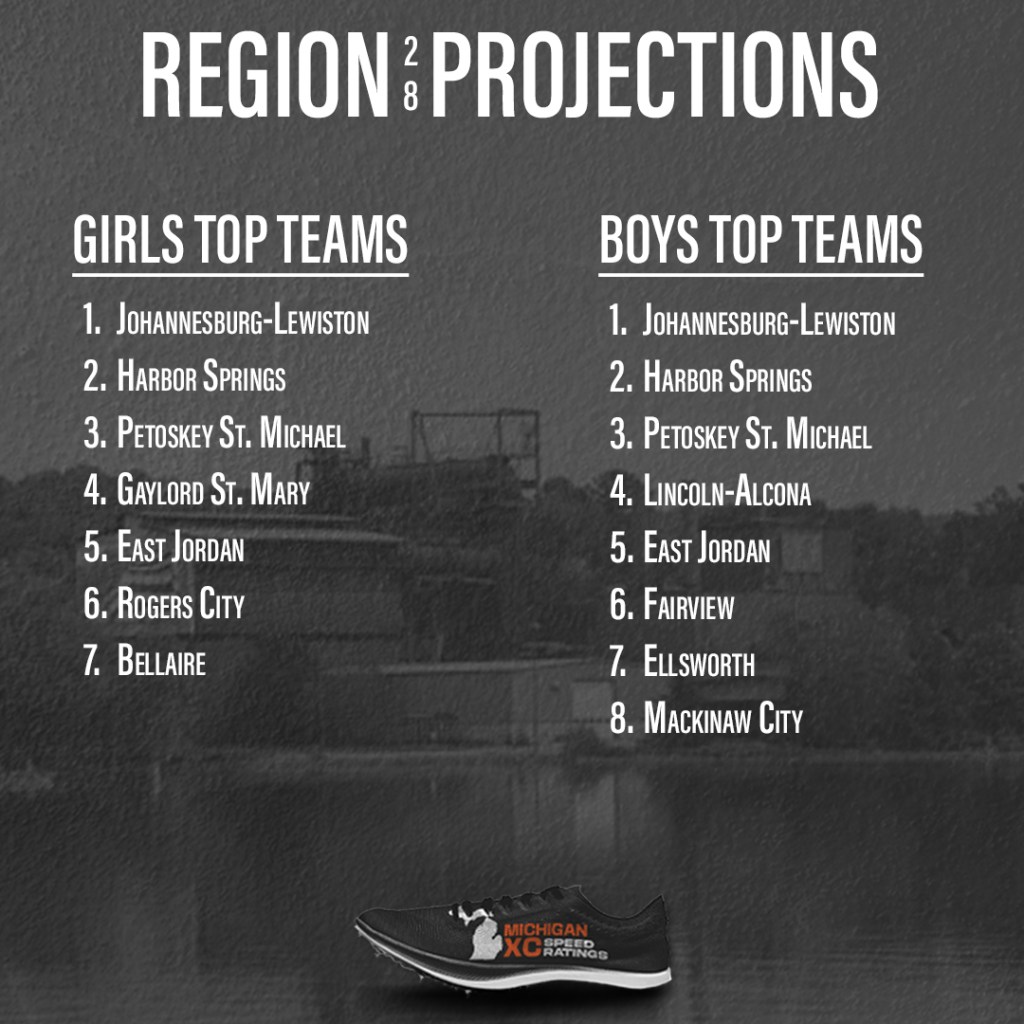
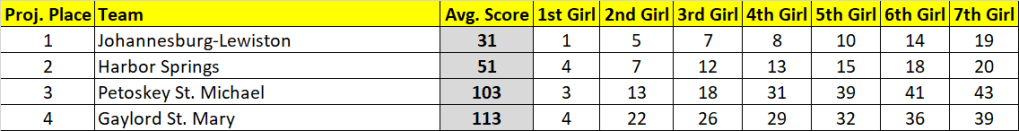
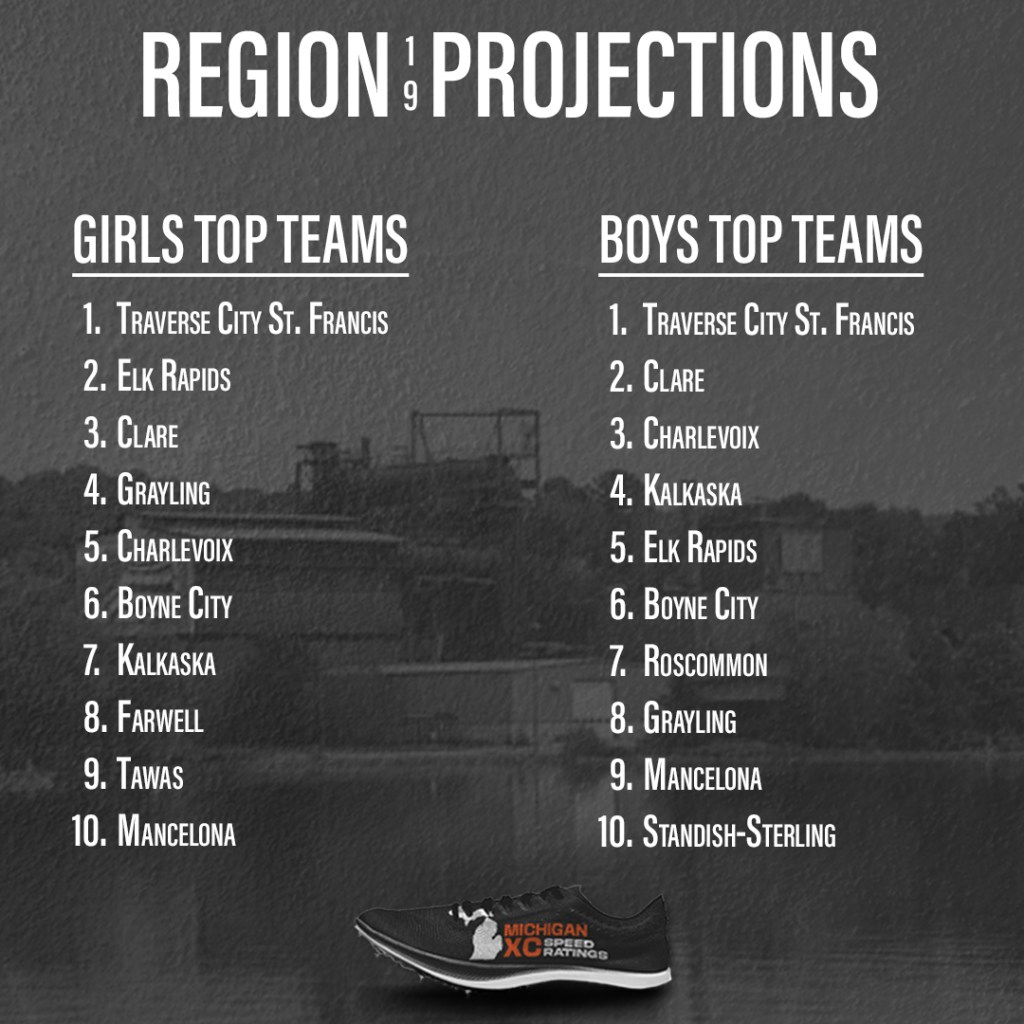
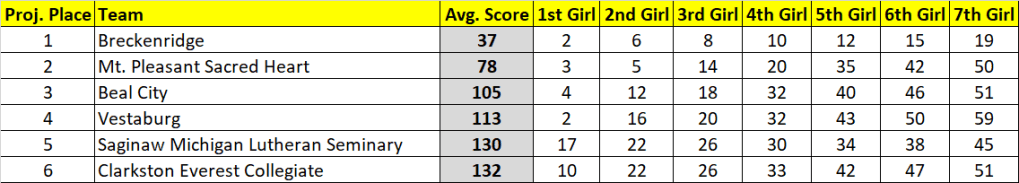
Finally, the start of the season we’ve all been waiting for. Throw out all the fast times from September, but apply all the lessons learned through the summer and fall. Regional week is here and with it comes the many projections and previews I’ll write.
Just as last year and throughout the season, I’m projecting these using race simulations. Through a season’s worth of speed ratings, one can determine a runner’s average rating and the variability of those ratings. Both those factors are then weighed towards more recent meets, which are then simulated thousands of times using a Monte Carlo analysis (also described by TullyRunners here). Over those thousands of race simulations, one can determine a team’s average place and average score, a runner’s average place, odds on winning, and odds on qualifying.
These are useful in cross country scenarios, where you have consistent runners and those who are a bit more up and down. For example:
| Tanner Time | Tanner Rating | Tanner Avg. | Tanner StDev. |
| 15:30 | 210 | ||
| 15:45 | 205 | ||
| 16:00 | 200 | ||
| 16:15 | 195 | ||
| 16:30 | 190 | 200 | 7.91 |
| MIXCSR Time | MIXCSR Rating | MIXCSR Avg. | MIXCSR StDev. |
| 16:09 | 197 | ||
| 16:12 | 196 | ||
| 16:15 | 195 | ||
| 16:18 | 194 | ||
| 16:21 | 193 | 195 | 1.58 |
Jacob at his best might be faster than I in four of the five races during the season. I’d almost never be All-State in Division 1, but he might contend for a top-5 spot or place 60th.
If we did 20 simulations, this is how it might turn out:
| Race | Tanner Avg. | Tanner StDev | Tanner Rating | MIXCSR Avg. | MIXCSR StDev | MIXCSR Rating |
| 1 | 200 | 7.9 | 202.1 | 195 | 1.6 | 195.6 |
| 2 | 200 | 7.9 | 196.2 | 195 | 1.6 | 194.1 |
| 3 | 200 | 7.9 | 190.0 | 195 | 1.6 | 199.2 |
| 4 | 200 | 7.9 | 193.4 | 195 | 1.6 | 192.5 |
| 5 | 200 | 7.9 | 206.8 | 195 | 1.6 | 195.7 |
| 6 | 200 | 7.9 | 201.8 | 195 | 1.6 | 196.1 |
| 7 | 200 | 7.9 | 171.6 | 195 | 1.6 | 194.9 |
| 8 | 200 | 7.9 | 189.2 | 195 | 1.6 | 195.9 |
| 9 | 200 | 7.9 | 205.5 | 195 | 1.6 | 197.0 |
| 10 | 200 | 7.9 | 203.8 | 195 | 1.6 | 192.6 |
| 11 | 200 | 7.9 | 192.3 | 195 | 1.6 | 196.5 |
| 12 | 200 | 7.9 | 196.9 | 195 | 1.6 | 196.4 |
| 13 | 200 | 7.9 | 198.5 | 195 | 1.6 | 195.6 |
| 14 | 200 | 7.9 | 203.2 | 195 | 1.6 | 194.1 |
| 15 | 200 | 7.9 | 193.9 | 195 | 1.6 | 192.6 |
| 16 | 200 | 7.9 | 199.3 | 195 | 1.6 | 193.2 |
| 17 | 200 | 7.9 | 208.7 | 195 | 1.6 | 194.2 |
| 18 | 200 | 7.9 | 213.7 | 195 | 1.6 | 194.6 |
| 19 | 200 | 7.9 | 212.6 | 195 | 1.6 | 197.1 |
| 20 | 200 | 7.9 | 206.3 | 195 | 1.6 | 193.9 |
I’d win four times, but I’d never have the ability to win a title like he had in Race 18. He’s usually All-State, but may cost his team a title through his effort in Race 7.
The simulations give the possibilities of those scenarios and all the various scoring scripts. A sixth girl that can pop off on any certain day, a reliable boy who always runs 17-flat, you name it. Hopefully, they better elucidate our contenders, qualifiers, and how these races play out over the weekend.
But always remember, races aren’t run on paper or on a computer. These projections are meant to better our sport, give more attention where little is given. Although I take pride in their accuracy, this endeavor would be quite boring if it were always perfect. I look forward to these being proven wrong and I expect to hear about it as well.

GIRLS
Ranked Teams
#18 Buchanan
#27 Bridgman
Projected Individual Qualifier Cutoff
15th-17th place.
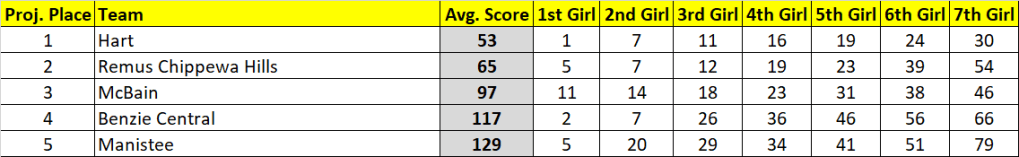
| Projected Place | Team | Avg. Score | Avg. Place | Win % | Top 3 % |
| 1 | Buchanan | 60 | 1.1 | 90 | 95+ |
| 2 | Bridgman | 81 | 2.0 | 10 | 95+ |
| 3 | Union City | 106 | 3.5 | 51 | |
| 4 | Schoolcraft | 106 | 3.6 | 50 | |
| 5 | Kalamazoo Christian | 128 | 5.0 | ||
| 6 | Niles Brandywine | 144 | 6.0 | ||
| 7 | Watervliet | 155 | 6.8 | ||
| 8 | Lawton | 192 | 8.2 | ||
| 9 | Olivet | 207 | 8.8 | ||
| 10 | Hartford | 269 | 10.1 | ||
| 11 | Bangor | 297 | 11.0 | ||
| 12 | Constantine | 343 | 12.0 |
| Projected Place | Grade | Name | Team | Avg. Place |
| 1 | 11 | Alaina Klooster | Kalamazoo Christian | 1.6 |
| 2 | 12 | Angel Miller | Parchment | 3.6 |
| 3 | 9 | Alli Gautsche | Union City | 3.9 |
| 4 | 11 | Emma Miller | Buchanan | 5.9 |
| 5 | 11 | Madeline Young | Buchanan | 6.6 |
| 6 | 12 | Morgan Lowell | Watervliet | 6.9 |
| 7 | 12 | Olivea Gessner | Olivet | 7.4 |
| 8 | 11 | Clara Fast | Bridgman | 7.6 |
| 9 | 10 | Kandin Shuler | Bridgman | 8.2 |
| 10 | 11 | Ariana Pillot | Schoolcraft | 8.6 |
| 11 | 11 | Skyler Fraley | Union City | 10.3 |
| 12 | 10 | Alaina Nagel | Buchanan | 12.3 |
| 13 | 11 | Melanie Warren | Bridgman | 12.3 |
| 14 | 11 | Kimberly Romero | Watervliet | 15.7 |
| 15 | 11 | Emily Howell | Bridgman | 17.5 |
| 16 | 10 | Adyson Baker | Buchanan | 17.6 |
| 17 | 12 | Jenna VanDussen | Schoolcraft | 18.2 |
| 18 | 9 | Hadley Camp | Lawton | 19.0 |
| 19 | 10 | Sydney Olson | Niles Brandywine | 19.4 |
| 20 | 11 | Aubree Murray | Niles Brandywine | 20.8 |
| 21 | 11 | Alissa Skirka | Union City | 21.7 |
| 22 | 12 | Alyssa VanDussen | Schoolcraft | 23.4 |
| 23 | 11 | Lucy Bray | Kalamazoo Christian | 24.3 |
| 24 | 11 | Marykate Thomas | Kalamazoo Christian | 25.7 |
| 25 | 11 | Miley Young | Niles Brandywine | 26.0 |
| 26 | 10 | Makynna Williams | Buchanan | 26.5 |
| 27 | 9 | Brooke Schlutt | Buchanan | 27.1 |
| 28 | 9 | Anika Weurding | Lawton | 27.2 |
| 29 | 11 | Addison Blodgett | Schoolcraft | 28.0 |
| 30 | 11 | Lillian Wolf | Hartford | 29.8 |
BOYS
Ranked Teams
#17 Buchanan
#22 Olivet
Projected Individual Qualifier Cutoff
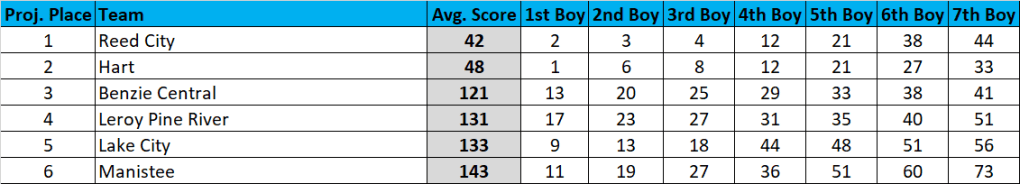
Top-15! With a bit weaker teams compared to individuals, expect the top spots in the region to be comprised of additional qualifiers.
| Projected Place | Team | Avg. Score | Avg. Place | Win % | Top 3 % |
| 1 | Buchanan | 66 | 1.0 | 95+ | 95+ |
| 2 | Olivet | 85 | 2.0 | 95+ | |
| 3 | Union City | 124 | 3.2 | 81 | |
| 4 | Bridgman | 145 | 4.2 | 18 | |
| 5 | Constantine | 169 | 5.7 | ||
| 6 | Bloomingdale | 177 | 6.1 | ||
| 7 | Schoolcraft | 183 | 6.5 | ||
| 8 | Kalamazoo Christian | 198 | 7.5 | ||
| 9 | Parchment | 234 | 9.1 | ||
| 10 | Coloma | 256 | 10.4 | ||
| 11 | Bangor | 269 | 11.2 | ||
| 12 | Watervliet | 281 | 11.8 | ||
| 13 | Hartford | 297 | 12.4 | ||
| 14 | Galesburg-Augusta | 346 | 14.0 | ||
| 15 | Lawton | 410 | 15.0 | ||
| 16 | Comstock | 477 | 16.0 |
| Projected Place | Grade | Name | Team | Avg. Place |
| 1 | 12 | Boden Genovese | Coloma | 1.3 |
| 2 | 12 | Jaden Barnes | Bloomingdale | 2.4 |
| 3 | 12 | Lucas Hopkins | Olivet | 3.0 |
| 4 | 11 | Daniel Mandujano | Watervliet | 3.7 |
| 5 | 10 | Ben Gautsche | Union City | 4.9 |
| 6 | 11 | Dante Pillot | Schoolcraft | 7.0 |
| 7 | 12 | Conner Fountain | Olivet | 7.3 |
| 8 | 11 | Andrew Mabry | Bridgman | 7.6 |
| 9 | 10 | Liam McBeth | Buchanan | 9.9 |
| 10 | 11 | Robbie King | Constantine | 11.2 |
| 11 | 12 | Britain Philip | Buchanan | 11.6 |
| 12 | 10 | Jacob Kuntz | Buchanan | 13.3 |
| 13 | 10 | Jack Sherwood | Buchanan | 13.8 |
| 14 | 11 | Tyler Caruso | Bangor | 15.4 |
| 15 | 11 | Elliot Cole | Parchment | 16.0 |
| 16 | 11 | Coy Weinberg | Buchanan | 17.2 |
| 17 | 11 | Carter Stevens | Galesburg-Augusta | 18.1 |
| 18 | 12 | Aiden Cripe | Coloma | 19.8 |
| 19 | 11 | Keagan Cole | Parchment | 20.5 |
| 20 | 9 | Cullen Decker | Union City | 21.6 |
| 21 | 10 | Alessandro Avila | Constantine | 21.9 |
| 22 | 12 | William Rodriquez | Bridgman | 23.3 |
| 23 | 12 | Daniel Dryer | Olivet | 23.9 |
| 24 | 12 | Brad Salmon | Bridgman | 24.1 |
| 25 | 11 | Zack Mitchell | Kalamazoo Christian | 24.4 |
| 26 | 10 | Evan Schaefer | Olivet | 24.7 |
| 27 | 11 | Cohen Burdick | Union City | 28.7 |
| 28 | 9 | Landen Gessner | Olivet | 29.2 |
| 29 | 12 | Jacob Williams | Kalamazoo Christian | 30.6 |
| 30 | 11 | Logan Patmalnieks | Constantine | 31.2 |

GIRLS
Ranked Teams
#2 Otsego
#10 St. Joseph
Projected Individual Qualifier Cutoff
Around 19th Place.
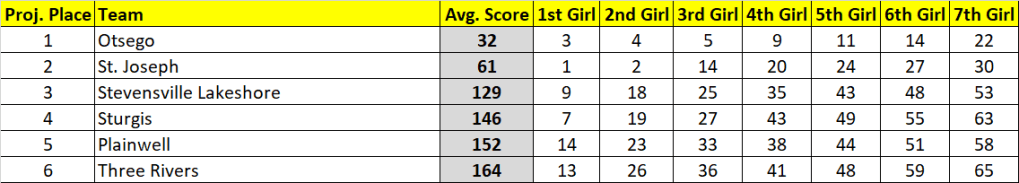
| Projected Place | Team | Avg. Score | Avg. Place | Win % | Top 3 % |
| 1 | Otsego | 32 | 1.0 | 95+ | 95+ |
| 2 | St. Joseph | 61 | 2.0 | 95+ | |
| 3 | Stevensville Lakeshore | 129 | 3.2 | 81 | |
| 4 | Sturgis | 146 | 4.4 | 11 | |
| 5 | Plainwell | 152 | 5.0 | 8 | |
| 6 | Three Rivers | 164 | 6.1 | ||
| 7 | Paw Paw | 172 | 6.6 | ||
| 8 | Niles | 189 | 7.9 | ||
| 9 | Vicksburg | 207 | 8.9 | ||
| 10 | Edwardsburg | 258 | 10.0 | ||
| 11 | Allegan | 299 | 11.3 | ||
| 12 | Berrien Springs | 305 | 11.7 |
| Projected Place | Grade | Name | Team | Avg. Place |
| 1 | 12 | Gail Vaikutis | St. Joseph | 1.4 |
| 2 | 11 | Elena Figueroa | St. Joseph | 1.9 |
| 3 | 10 | Emma Hoffman | Otsego | 3.5 |
| 4 | 12 | Logan Brazee | Otsego | 3.7 |
| 5 | 12 | Megan Germain | Otsego | 5.1 |
| 6 | 10 | Berkley Holtz | Sturgis | 7.1 |
| 7 | 12 | Emma Steele | Vicksburg | 8.7 |
| 8 | 11 | Madison Johnson | Paw Paw | 8.8 |
| 9 | 11 | Preslee Perkins | Stevensville Lakeshore | 8.9 |
| 10 | 11 | Taylor Mitchell | Otsego | 10.7 |
| 11 | 10 | Rebekah Stachura | Otsego | 12.2 |
| 12 | 9 | Skylar Mejeur | Otsego | 12.7 |
| 13 | 12 | Jennifer Hernandez-Medina | Three Rivers | 13.0 |
| 14 | 10 | Josie Longcore | Plainwell | 13.7 |
| 15 | 12 | Jade Murdoch | St. Joseph | 14.2 |
| 16 | 11 | Charlie Drew | Niles | 16.6 |
| 17 | 10 | Kate Ort | Stevensville Lakeshore | 18.2 |
| 18 | 9 | Sydney Timmons | Otsego | 19.6 |
| 19 | 12 | Cecilia Ruchti | St. Joseph | 20.5 |
| 20 | 10 | Tessa Hatt | Sturgis | 21.8 |
| 21 | 11 | Emma Taggett | Plainwell | 23.7 |
| 22 | 9 | Hayden Lemieux | Paw Paw | 24.4 |
| 23 | 10 | Jayden VandenAkker | Allegan | 24.4 |
| 24 | 10 | Sydney Bir | Sturgis | 24.5 |
| 25 | 11 | Annika DeJong | Stevensville Lakeshore | 25.4 |
| 26 | 9 | Lydia Johnson | St. Joseph | 25.4 |
| 27 | 10 | Beatrice Perucchetti | St. Joseph | 25.8 |
| 28 | 9 | Sophia Lemieux | Paw Paw | 26.0 |
| 29 | 12 | Anezka Pradna | Three Rivers | 26.3 |
| 30 | 9 | Lily Cummings | St. Joseph | 28.6 |
BOYS
Ranked Teams
#9 Otsego
#16 Plainwell
Projected Individual Qualifier Cutoff
The battle for the third team is wide open, so fight for the top-15 and every spot after.
| Projected Place | Team | Avg. Score | Avg. Place | Win % | Top 3 % |
| 1 | Otsego | 49 | 1.1 | 87 | 95+ |
| 2 | Plainwell | 61 | 1.9 | 13 | 95+ |
| 3 | Edwardsburg | 136 | 3.5 | 64 | |
| 4 | Three Rivers | 145 | 4.5 | 19 | |
| 5 | Paw Paw | 153 | 4.9 | 12 | |
| 6 | St. Joseph | 161 | 5.8 | 5 | |
| 7 | Vicksburg | 168 | 6.4 | ||
| 8 | Berrien Springs | 212 | 8.5 | ||
| 9 | Niles | 217 | 8.6 | ||
| 10 | Sturgis | 255 | 10.3 |

| Projected Place | Grade | Name | Team | Avg. Place |
| 1 | 12 | Aiden Krueger | Niles | 2.2 |
| 2 | 12 | Shay White | St. Joseph | 3.1 |
| 3 | 11 | Henry Cox | Plainwell | 3.3 |
| 4 | 11 | Caleb Wesseldyk | Otsego | 4.9 |
| 5 | 11 | Sullivan Zietlow | Three Rivers | 5.3 |
| 6 | 11 | Owen Saylor | Dowagiac Union | 7.2 |
| 7 | 12 | Dane Bailey | Edwardsburg | 8.5 |
| 8 | 12 | Isaac Veen | Plainwell | 9.0 |
| 9 | 11 | Aidan Goodwin | Otsego | 10.2 |
| 10 | 10 | Kenny Sheffer | Otsego | 10.7 |
| 11 | 11 | Noah Jarvis | Berrien Springs | 11.6 |
| 12 | 11 | Logan VanHouten | Otsego | 11.7 |
| 13 | 9 | Caiden Caswell | Vicksburg | 12.5 |
| 14 | 10 | Donovan Ryan | Plainwell | 12.9 |
| 15 | 12 | Matthew Schreiner | Otsego | 14.4 |
| 16 | 12 | Liam Troutner | Plainwell | 17.0 |
| 17 | 11 | Maguire Johnson | Edwardsburg | 17.0 |
| 18 | 11 | Holten Mulherin | Otsego | 17.8 |
| 19 | 11 | Skye Smith | Vicksburg | 21.4 |
| 20 | 11 | Nolan Park | Sturgis | 21.8 |
| 21 | 11 | Eli Johansen | St. Joseph | 21.9 |
| 22 | 10 | Trent Hansen | Plainwell | 22.3 |
| 23 | 12 | Eddy Charron | Paw Paw | 23.5 |
| 24 | 11 | Billy Pipkorn | Plainwell | 24.5 |
| 25 | 9 | Christopher Vogt | Paw Paw | 24.8 |
| 26 | 11 | Jon Leith | Edwardsburg | 27.9 |
| 27 | 9 | Hunter Smith | Vicksburg | 28.3 |
| 28 | 10 | George Scupham | Edwardsburg | 28.6 |
| 29 | 9 | Connor Beebe | Berrien Springs | 29.3 |
| 30 | 12 | Aden Webber | Paw Paw | 31.3 |