Finally, the start of the season we’ve all been waiting for. Throw out all the fast times from September, but apply all the lessons learned through the summer and fall. Regional week is here and with it comes the many projections and previews I’ll write.
Just as last year and throughout the season, I’m projecting these using race simulations. Through a season’s worth of speed ratings, one can determine a runner’s average rating and the variability of those ratings. Both those factors are then weighed towards more recent meets, which are then simulated thousands of times using a Monte Carlo analysis (also described by TullyRunners here). Over those thousands of race simulations, one can determine a team’s average place and average score, a runner’s average place, odds on winning, and odds on qualifying.
These are useful in cross country scenarios, where you have consistent runners and those who are a bit more up and down. For example:
| Tanner Time | Tanner Rating | Tanner Avg. | Tanner StDev. |
| 15:30 | 210 | ||
| 15:45 | 205 | ||
| 16:00 | 200 | ||
| 16:15 | 195 | ||
| 16:30 | 190 | 200 | 7.91 |
| MIXCSR Time | MIXCSR Rating | MIXCSR Avg. | MIXCSR StDev. |
| 16:09 | 197 | ||
| 16:12 | 196 | ||
| 16:15 | 195 | ||
| 16:18 | 194 | ||
| 16:21 | 193 | 195 | 1.58 |
Jacob at his best might be faster than I in four of the five races during the season. I’d almost never be All-State in Division 1, but he might contend for a top-5 spot or place 60th.
If we did 20 simulations, this is how it might turn out:
| Race | Tanner Avg. | Tanner StDev | Tanner Rating | MIXCSR Avg. | MIXCSR StDev | MIXCSR Rating |
| 1 | 200 | 7.9 | 202.1 | 195 | 1.6 | 195.6 |
| 2 | 200 | 7.9 | 196.2 | 195 | 1.6 | 194.1 |
| 3 | 200 | 7.9 | 190.0 | 195 | 1.6 | 199.2 |
| 4 | 200 | 7.9 | 193.4 | 195 | 1.6 | 192.5 |
| 5 | 200 | 7.9 | 206.8 | 195 | 1.6 | 195.7 |
| 6 | 200 | 7.9 | 201.8 | 195 | 1.6 | 196.1 |
| 7 | 200 | 7.9 | 171.6 | 195 | 1.6 | 194.9 |
| 8 | 200 | 7.9 | 189.2 | 195 | 1.6 | 195.9 |
| 9 | 200 | 7.9 | 205.5 | 195 | 1.6 | 197.0 |
| 10 | 200 | 7.9 | 203.8 | 195 | 1.6 | 192.6 |
| 11 | 200 | 7.9 | 192.3 | 195 | 1.6 | 196.5 |
| 12 | 200 | 7.9 | 196.9 | 195 | 1.6 | 196.4 |
| 13 | 200 | 7.9 | 198.5 | 195 | 1.6 | 195.6 |
| 14 | 200 | 7.9 | 203.2 | 195 | 1.6 | 194.1 |
| 15 | 200 | 7.9 | 193.9 | 195 | 1.6 | 192.6 |
| 16 | 200 | 7.9 | 199.3 | 195 | 1.6 | 193.2 |
| 17 | 200 | 7.9 | 208.7 | 195 | 1.6 | 194.2 |
| 18 | 200 | 7.9 | 213.7 | 195 | 1.6 | 194.6 |
| 19 | 200 | 7.9 | 212.6 | 195 | 1.6 | 197.1 |
| 20 | 200 | 7.9 | 206.3 | 195 | 1.6 | 193.9 |
I’d win four times, but I’d never have the ability to win a title like he had in Race 18. He’s usually All-State, but may cost his team a title through his effort in Race 7.
The simulations give the possibilities of those scenarios and all the various scoring scripts. A sixth girl that can pop off on any certain day, a reliable boy who always runs 17-flat, you name it. Hopefully, they better elucidate our contenders, qualifiers, and how these races play out over the weekend.
But always remember, races aren’t run on paper or on a computer. These projections are meant to better our sport, give more attention where little is given. Although I take pride in their accuracy, this endeavor would be quite boring if it were always perfect. I look forward to these being proven wrong and I expect to hear about it as well.
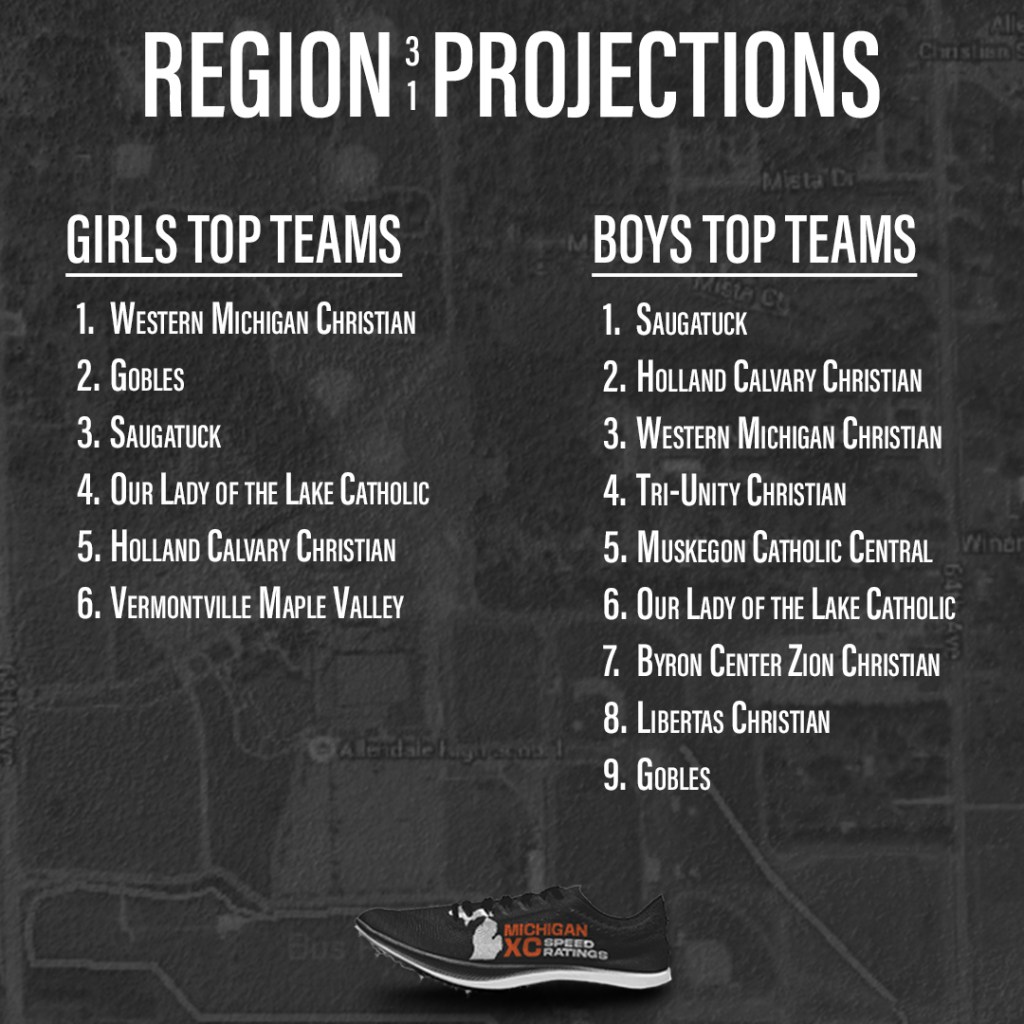
GIRLS
Ranked Teams
#3 Muskegon Western Michigan Christian
#6 Gobles
#7 Saugatuck
#24 St. Joseph Our Lady of the Lake Catholic
Projected Individual Qualifier Cutoff
If I’m counting this right… 27th! Wow, that’s far back, but with three top-10 teams, I guess that’s what to expect.
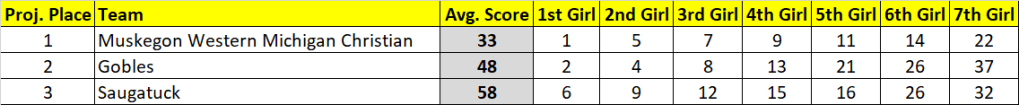
| Projected Place | Team | Avg. Score | Avg. Place | Win % | Top 3 % |
| 1 | Muskegon Western Michigan Christian | 33 | 1.1 | 90 | 95+ |
| 2 | Gobles | 48 | 2.0 | 9 | 95+ |
| 3 | Saugatuck | 58 | 3.0 | 95+ | |
| 4 | St. Joseph Our Lady of the Lake Catholic | 100 | 4.1 | ||
| 5 | Holland Calvary Christian | 117 | 4.9 | ||
| 6 | Vermontville Maple Valley | 171 | 6.0 |
| Projected Place | Grade | Name | Team | Avg. Place |
| 1 | 11 | Grace VanderKooi | Muskegon Western Michigan Christian | 1.0 |
| 2 | 9 | Libby Smith | Gobles | 2.0 |
| 3 | 9 | Veyda Conley | Martin | 5.4 |
| 4 | 9 | Ava DeYoung | Gobles | 5.4 |
| 5 | 12 | Allison Glendening | St. Joseph Our Lady of the Lake Catholic | 6.0 |
| 6 | 9 | Lyvia Curtis | Saugatuck | 7.6 |
| 7 | 9 | Leah Sneller | Muskegon Western Michigan Christian | 7.6 |
| 8 | 9 | Lauren Shaffer | Gobles | 7.8 |
| 9 | 12 | Eleanor Kingshott | Muskegon Western Michigan Christian | 8.1 |
| 10 | 9 | Kamryn Sixberry | Saugatuck | 9.1 |
| 11 | 12 | Grace Folkema | Muskegon Western Michigan Christian | 9.4 |
| 12 | 9 | Kaylie Riksen | Muskegon Western Michigan Christian | 11.3 |
| 13 | 10 | Madison Cooley | Gobles | 14.1 |
| 14 | 12 | Anna McQueary | Saugatuck | 15.2 |
| 15 | 11 | Brielle Voorhees | Tri-Unity Christian | 15.3 |
| 16 | 11 | Leilani Schoonmaker | Saugatuck | 15.8 |
| 17 | 11 | Morgan Lawrence | Muskegon Western Michigan Christian | 16.1 |
| 18 | 11 | Alayah Nieuwsma | Saugatuck | 18.1 |
| 19 | 12 | Abby Kunkle | Libertas Christian | 18.4 |
| 20 | 10 | Acacia Williams | Holland Calvary Christian | 19.2 |
| 21 | 12 | Leah Prins | Byron Center Zion Christian | 23.1 |
| 22 | 11 | Mary Riley | St. Joseph Our Lady of the Lake Catholic | 25.0 |
| 23 | 11 | Hallie Lindale | Muskegon Western Michigan Christian | 26.2 |
| 24 | 10 | Aribel Mills | St. Joseph Our Lady of the Lake Catholic | 26.4 |
| 25 | 11 | Hannah Hysell | St. Joseph Our Lady of the Lake Catholic | 26.9 |
| 26 | 12 | Deanna Wood | Gobles | 27.0 |
| 27 | 12 | Madilyn DeRuiter | Byron Center Zion Christian | 28.1 |
| 28 | 9 | Lilly Faurot | Vermontville Maple Valley | 28.1 |
| 29 | 8 | Laura Rotman | Holland Calvary Christian | 28.8 |
| 30 | 11 | Olivia Laninga | Holland Calvary Christian | 29.0 |
BOYS
Ranked Teams
#3 Saugatuck
#4 Holland Calvary Christian
#7 Muskegon Western Michigan Christian
#18 Tri-Unity Christian
#21 Muskegon Catholic Central
Projected Individual Qualifier Cutoff
20th Place. Once again, three top-10 teams, but this time a bit more depth behind those three dominant boys teams.
| Projected Place | Team | Avg. Score | Avg. Place | Win % | Top 3 % |
| 1 | Saugatuck | 49 | 1.3 | 69 | 95+ |
| 2 | Holland Calvary Christian | 55 | 2.0 | 28 | 95+ |
| 3 | Muskegon Western Michigan Christian | 62 | 2.7 | 95+ | |
| 4 | Tri-Unity Christian | 105 | 4.1 | ||
| 5 | Muskegon Catholic Central | 121 | 4.9 | ||
| 6 | St. Joseph Our Lady of the Lake Catholic | 149 | 6.0 | ||
| 7 | Byron Center Zion Christian | 188 | 7.0 | ||
| 8 | Libertas Christian | 200 | 8.0 | ||
| 9 | Gobles | 241 | 9.0 |

| Projected Place | Grade | Name | Team | Avg. Place |
| 1 | 11 | Matthias Morse | Muskegon Western Michigan Christian | 1.4 |
| 2 | 11 | Tyler Laansma | Tri-Unity Christian | 2.7 |
| 3 | 10 | Sammy Gamboa | Saugatuck | 4.4 |
| 4 | 9 | Sawyer Monroe | Saugatuck | 4.6 |
| 5 | 9 | Riley Weed | Holland Calvary Christian | 5.4 |
| 6 | 12 | Graeson Lawrence | Muskegon Western Michigan Christian | 6.1 |
| 7 | 8 | Lincoln Laansma | Tri-Unity Christian | 7.9 |
| 8 | 12 | Myles Tilma | Byron Center Zion Christian | 8.1 |
| 9 | 9 | Noah Schipper | Holland Calvary Christian | 8.3 |
| 10 | 9 | Gibson White | Holland Calvary Christian | 8.7 |
| 11 | 9 | Marcus Silva | Saugatuck | 11.3 |
| 12 | 10 | Brennan Nor | Saugatuck | 12.6 |
| 13 | 12 | Jacob Lyonnais | Muskegon Catholic Central | 12.9 |
| 14 | 9 | Christian Getz | Holland Calvary Christian | 13.8 |
| 15 | 9 | Grant Rehkopf | Saugatuck | 16.7 |
| 16 | 10 | Reuben Anderson | Muskegon Western Michigan Christian | 16.8 |
| 17 | 9 | Owen Sytsema | Muskegon Western Michigan Christian | 17.5 |
| 18 | 12 | Owen Lyonnais | Muskegon Catholic Central | 18.0 |
| 19 | 11 | Caleb Oudbier | Tri-Unity Christian | 22.0 |
| 20 | 12 | Matthew Lage | St. Joseph Our Lady of the Lake Catholic | 22.2 |
| 21 | 11 | Alexander Lawrence | Muskegon Western Michigan Christian | 22.4 |
| 22 | 12 | Alexander Gordillo | Libertas Christian | 23.5 |
| 23 | 12 | Danny Maat | Muskegon Western Michigan Christian | 23.9 |
| 24 | 9 | Elijah Laninga | Holland Calvary Christian | 24.0 |
| 25 | 9 | Caleb Adkins | Holland Calvary Christian | 24.3 |
| 26 | 9 | Eli Laninga | Holland Calvary Christian | 24.9 |
| 27 | 10 | Ryer Campbell | Muskegon Western Michigan Christian | 25.5 |
| 28 | 12 | Jack Walkenhorst | Muskegon Catholic Central | 26.2 |
| 29 | 11 | Kalen Loebach | St. Joseph Our Lady of the Lake Catholic | 26.9 |
| 30 | 12 | Owen McLoughlin | St. Joseph Our Lady of the Lake Catholic | 29.8 |
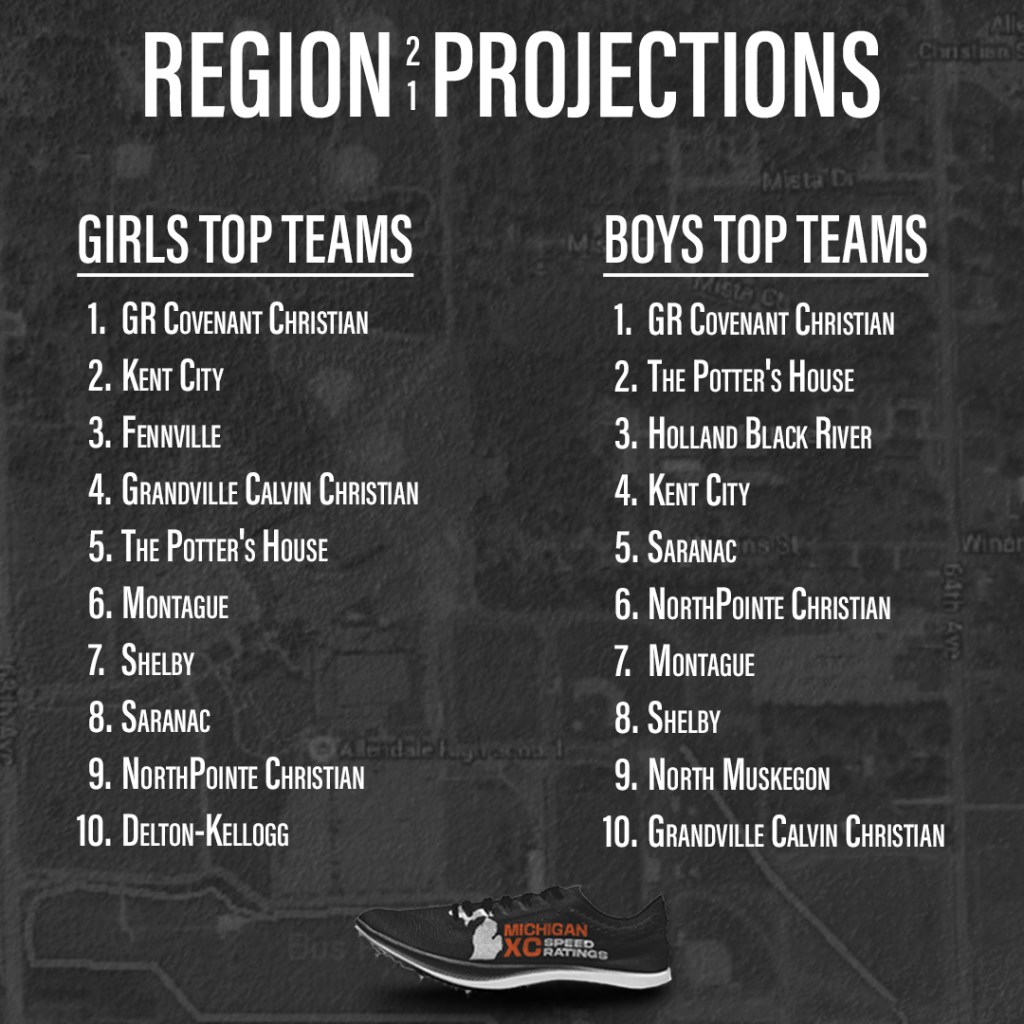
GIRLS
Ranked Teams
#3 Grand Rapids Covenant Christian
#16 Kent City
#17 Fennville
#25 Grandville Calvin Christian
Projected Individual Qualifier Cutoff
17th Place. After Covenant’s pack and the elite KC/Fennville girls, there’ll be a few spots for the taking.
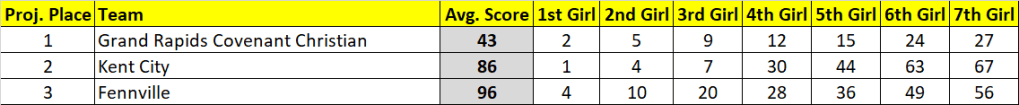
| Projected Place | Team | Avg. Score | Avg. Place | Win % | Top 3 % |
| 1 | Grand Rapids Covenant Christian | 43 | 1.0 | 95+ | 95+ |
| 2 | Kent City | 86 | 2.2 | 95+ | |
| 3 | Fennville | 96 | 2.8 | 95+ | |
| 4 | Grandville Calvin Christian | 118 | 4.0 | ||
| 5 | The Potter’s House | 143 | 5.1 | ||
| 6 | Montague | 174 | 7.1 | ||
| 7 | Shelby | 174 | 7.1 | ||
| 8 | Saranac | 177 | 7.4 | ||
| 9 | Grand Rapids NorthPointe Christian | 189 | 8.4 | ||
| 10 | Delton-Kellogg | 222 | 9.9 | ||
| 11 | Holland Black River | 267 | 11.0 | ||
| 12 | Ravenna | 360 | 12.0 |
| Projected Place | Grade | Name | Team | Avg. Place |
| 1 | 11 | Lila Volkers | Kent City | 1.0 |
| 2 | 12 | Amber Koole | Grand Rapids Covenant Christian | 2.1 |
| 3 | 9 | Isabelle Sliter | Fennville | 3.6 |
| 4 | 12 | Isabella Max | Kent City | 4.6 |
| 5 | 9 | Shelby Kuiper | Grand Rapids Covenant Christian | 5.4 |
| 6 | 11 | Lola Bryce | Grandville Calvin Christian | 6.1 |
| 7 | 12 | Gracie Houtman | Kent City | 6.7 |
| 8 | 9 | Lydia Soelberg | Shelby | 9.6 |
| 9 | 12 | Abbie Wiegers | North Muskegon | 9.8 |
| 10 | 12 | Nidia Martinez | Fennville | 10.2 |
| 11 | 9 | Lydia Minderhoud | Grand Rapids Covenant Christian | 12.0 |
| 12 | 12 | Lindsay Minderhoud | Grand Rapids Covenant Christian | 12.3 |
| 13 | 9 | Anna DeVries | Grand Rapids Covenant Christian | 13.4 |
| 14 | 11 | Hannah Geaney | The Potter’s House | 13.4 |
| 15 | 9 | Marnath Tuol | Grandville Calvin Christian | 13.9 |
| 16 | 12 | Cammie Erickson | Montague | 15.4 |
| 17 | 12 | Lauren Jousma | Grandville Calvin Christian | 17.5 |
| 18 | 9 | Jenna Terpstra | Grand Rapids NorthPointe Christian | 18.6 |
| 19 | 11 | Alyssa Possehn | Saranac | 19.3 |
| 20 | 10 | Sylvia Skujins | North Muskegon | 19.6 |
| 21 | 10 | Samantha Giles | Fennville | 21.7 |
| 22 | 12 | Nora Ballard | Holland Black River | 23.8 |
| 23 | 12 | Ivy Andreas | The Potter’s House | 24.2 |
| 24 | 11 | Grace Torsch | Montague | 26.9 |
| 25 | 12 | Erika Bylsma | Grand Rapids Covenant Christian | 27.2 |
| 26 | 10 | Amber Kuiper | Grand Rapids Covenant Christian | 27.8 |
| 27 | 9 | Noel Parker | Shelby | 28.5 |
| 28 | 12 | Summer Ritchie | Delton-Kellogg | 29.6 |
| 29 | 11 | Christina Mendoza | Fennville | 29.9 |
| 30 | 10 | Melanie Thornton | Grand Rapids NorthPointe Christian | 30.5 |
BOYS
Ranked Teams
#3 Grand Rapids Covenant Christian
#7 The Potter’s House
#24 Holland Black River
Projected Individual Qualifier Cutoff
15th, baby!
| Projected Place | Team | Avg. Score | Avg. Place | Win % | Top 3 % |
| 1 | Grand Rapids Covenant Christian | 50 | 1.0 | 95+ | 95+ |
| 2 | The Potter’s House | 71 | 2.0 | 95+ | |
| 3 | Holland Black River | 124 | 3.4 | 71 | |
| 4 | Kent City | 135 | 4.1 | 23 | |
| 5 | Saranac | 149 | 5.1 | ||
| 6 | Grand Rapids NorthPointe Christian | 156 | 5.8 | ||
| 7 | Montague | 166 | 6.8 | ||
| 8 | Shelby | 183 | 7.8 | ||
| 9 | North Muskegon | 212 | 9.0 | ||
| 10 | Grandville Calvin Christian | 275 | 10.6 | ||
| 11 | Delton-Kellogg | 292 | 11.5 | ||
| 12 | Ravenna | 296 | 11.6 | ||
| 13 | Fennville | 312 | 12.3 |

| Projected Place | Grade | Name | Team | Avg. Place |
| 1 | 12 | Samuel Martini | Kent City | 1.5 |
| 2 | 12 | Jackson Rodriguez | The Potter’s House | 2.2 |
| 3 | 11 | Levi Kamps | Grand Rapids Covenant Christian | 3.5 |
| 4 | 9 | Graeson Decker | Grand Rapids Covenant Christian | 5.2 |
| 5 | 11 | Isaac Edgington | Holland Black River | 6.0 |
| 6 | 12 | Brodie Delamater | Grant | 6.0 |
| 7 | 12 | Nathan Day | Saranac | 6.6 |
| 8 | 12 | Trevor Dornbos | Grandville Calvin Christian | 8.8 |
| 9 | 9 | Jonas Ballard | Holland Black River | 10.2 |
| 10 | 11 | Luke Dykstra | Grand Rapids Covenant Christian | 10.5 |
| 11 | 12 | Ezra Hagedorn | The Potter’s House | 11.1 |
| 12 | 12 | Hunter Helminski | Saranac | 11.8 |
| 13 | 10 | Noah Raeth | Montague | 13.2 |
| 14 | 12 | Jaren Vogel | Kent City | 15.6 |
| 15 | 12 | Noah Finton | The Potter’s House | 16.5 |
| 16 | 12 | Grant Koole | Grand Rapids Covenant Christian | 16.6 |
| 17 | 12 | Tanner Soelberg | Shelby | 18.0 |
| 18 | 11 | Tyler N. Kooienga | Grand Rapids Covenant Christian | 19.2 |
| 19 | 10 | Luke Tibbe | Grand Rapids NorthPointe Christian | 19.4 |
| 20 | 12 | Evan Atkinson-Miller | North Muskegon | 20.4 |
| 21 | 10 | Edward Mugisha | The Potter’s House | 21.5 |
| 22 | 9 | Caleb Swiney | The Potter’s House | 23.3 |
| 23 | 12 | Caleb Drnek | Grand Rapids Covenant Christian | 23.5 |
| 24 | 11 | Ethan Rimmer | Delton-Kellogg | 24.5 |
| 25 | 10 | Iziquiel Picon | Shelby | 25.4 |
| 26 | 12 | Clay Johnson | Montague | 26.8 |
| 27 | 11 | Alix Draves | Montague | 27.7 |
| 28 | 12 | Connor Lubbers | Grand Rapids Covenant Christian | 28.9 |
| 29 | 10 | Isaac Norcross | Grand Rapids NorthPointe Christian | 30.5 |
| 30 | 12 | Micah Frye | Shelby | 32.2 |
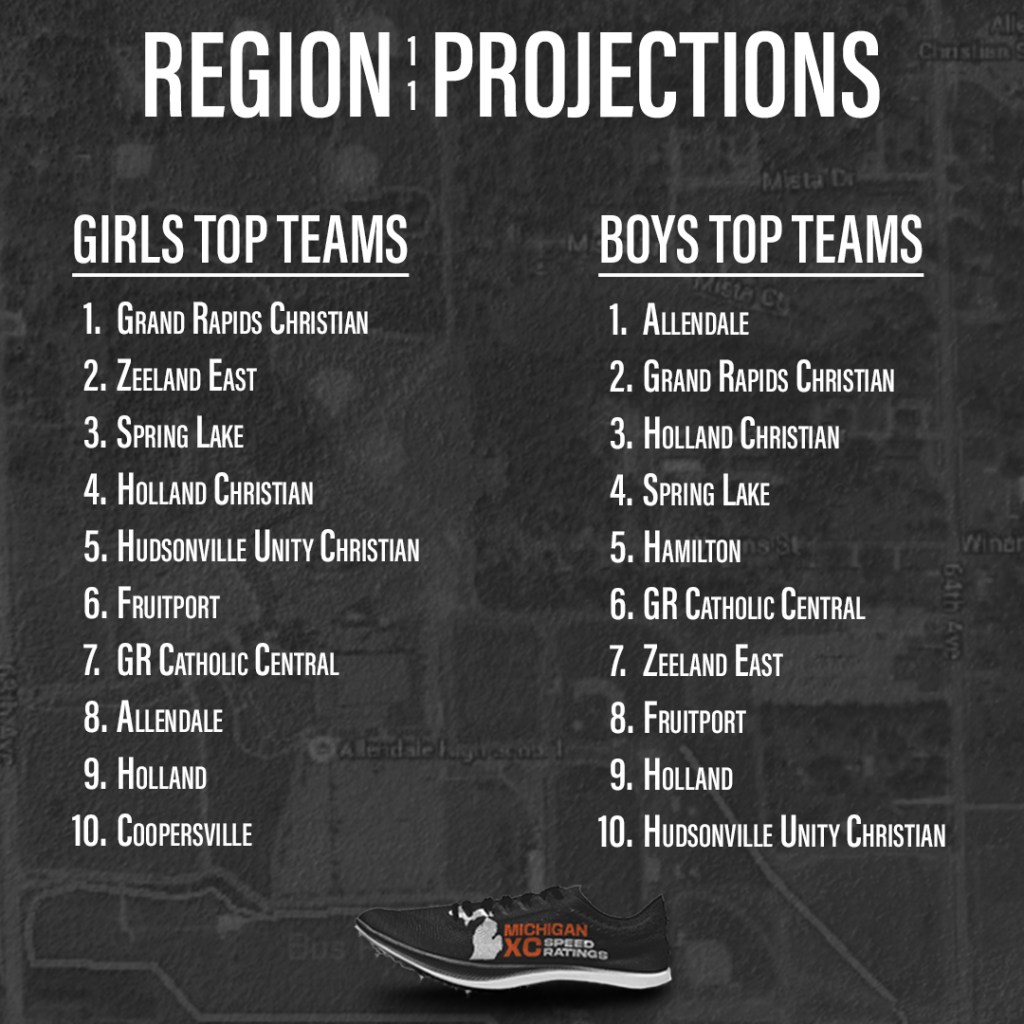
GIRLS
Ranked Teams
#1 Grand Rapids Christian
#5 Zeeland East
#6 Spring Lake
#8 Holland Christian
#14 Hudsonville Unity Christian
Projected Individual Qualifier Cutoff
16th to 17th Place. An insanely strong GR Christian squad takes up much of the top seven spots, but there’s plenty of individuals who’ll come in after.
| Projected Place | Team | Avg. Score | Avg. Place | Win % | Top 3 % |
| 1 | Grand Rapids Christian | 26 | 1.0 | 95+ | 95+ |
| 2 | Zeeland East | 79 | 2.1 | 95+ | |
| 3 | Spring Lake | 99 | 3.4 | 56 | |
| 4 | Holland Christian | 101 | 3.5 | 46 | |
| 5 | Hudsonville Unity Christian | 126 | 5.0 | ||
| 6 | Fruitport | 172 | 6.0 | ||
| 7 | Grand Rapids Catholic Central | 201 | 7.0 | ||
| 8 | Allendale | 252 | 8.9 | ||
| 9 | Holland | 256 | 9.3 | ||
| 10 | Coopersville | 256 | 9.3 | ||
| 11 | Grand Rapids West Catholic | 271 | 10.5 | ||
| 12 | Hamilton | 323 | 12.0 | ||
| 13 | Grand River Preparatory | 403 | 13.2 | ||
| 14 | Wyoming Lee | 415 | 13.8 |

| Projected Place | Grade | Name | Team | Avg. Place |
| 1 | 12 | Natalie VanOtteren | Grand Rapids Christian | 1.1 |
| 2 | 11 | Emma Drnek | Zeeland East | 3.2 |
| 3 | 12 | Emily Tomes | Grand Rapids Catholic Central | 3.6 |
| 4 | 10 | Ellie Scholma | Grand Rapids Christian | 3.8 |
| 5 | 10 | Lilah Poel | Grand Rapids Christian | 5.3 |
| 6 | 12 | Payton Holtz | Grand Rapids Christian | 7.3 |
| 7 | 12 | Naomi Nelson | Grand Rapids Christian | 8.4 |
| 8 | 12 | Allison Kuzma | Zeeland East | 8.9 |
| 9 | 9 | Olivia Hollebeek | Holland Christian | 9.0 |
| 10 | 12 | Tatum Dykstra | Fruitport | 11.3 |
| 11 | 12 | Kyla Meyers | Spring Lake | 11.7 |
| 12 | 9 | Johanna Mulder | Holland | 12.4 |
| 13 | 9 | Eliana Stob | Holland Christian | 12.6 |
| 14 | 12 | Bea Reeser | Spring Lake | 14.5 |
| 15 | 12 | Maddie Bosch | Hudsonville Unity Christian | 14.6 |
| 16 | 9 | Ellery Lampen | Holland Christian | 15.9 |
| 17 | 12 | Claire Marosi | Grand Rapids Catholic Central | 17.8 |
| 18 | 12 | Adia Sikkema | Grand Rapids Christian | 18.7 |
| 19 | 10 | Taryn DiLaura | Zeeland East | 18.7 |
| 20 | 10 | Alexis Kotkowicz | Spring Lake | 18.9 |
| 21 | 10 | Annika TerBeek | Grand Rapids Christian | 19.9 |
| 22 | 9 | Carly Bruxvoort | Hudsonville Unity Christian | 25.0 |
| 23 | 11 | Sierra Grooters | Hudsonville Unity Christian | 25.2 |
| 24 | 11 | Lexie Ruffing | Spring Lake | 25.3 |
| 25 | 10 | Meredith Cook | Zeeland East | 26.3 |
| 26 | 10 | CC Kuras | Zeeland East | 28.2 |
| 27 | 9 | Mackenzie Huizenga | Holland Christian | 28.7 |
| 28 | 11 | Maddie Bruxvoort | Hudsonville Unity Christian | 28.7 |
| 29 | 10 | Megan Kuzma | Zeeland East | 28.8 |
| 30 | 12 | Lauren Lee | Fruitport | 29.5 |
BOYS
Ranked Teams
#2 Allendale
#3 Grand Rapids Christian
#11 Holland Christian
#15 Spring Lake
#20 Hamilton
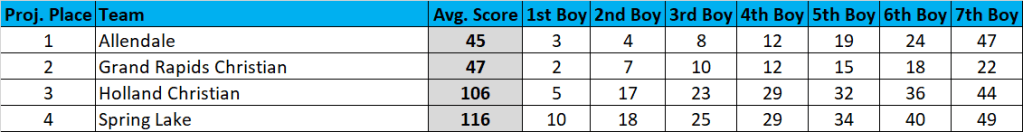
Projected Individual Qualifier Cutoff
21st place on either Holland Christian or Spring Lake qualifying scenarios.
| Projected Place | Team | Avg. Score | Avg. Place | Win % | Top 3 % |
| 1 | Allendale | 45 | 1.4 | 59 | 95+ |
| 2 | Grand Rapids Christian | 47 | 1.6 | 41 | 95+ |
| 3 | Holland Christian | 106 | 3.3 | 69 | |
| 4 | Spring Lake | 116 | 3.8 | 31 | |
| 5 | Hamilton | 145 | 5.1 | ||
| 6 | Grand Rapids Catholic Central | 165 | 5.9 | ||
| 7 | Zeeland East | 211 | 7.5 | ||
| 8 | Fruitport | 216 | 8.0 | ||
| 9 | Holland | 227 | 8.6 | ||
| 10 | Hudsonville Unity Christian | 260 | 9.9 | ||
| 11 | Comstock Park | 325 | 11.2 | ||
| 12 | Coopersville | 337 | 11.8 | ||
| 13 | Grand River Preparatory | 384 | 13.4 | ||
| 14 | Grand Rapids West Catholic | 389 | 13.6 |
| Projected Place | Grade | Name | Team | Avg. Place |
| 1 | 12 | Noah Lambers | Holland | 1.8 |
| 2 | 11 | Simon Triezenberg | Grand Rapids Christian | 2.6 |
| 3 | 10 | Ronnie Silveira | Allendale | 3.3 |
| 4 | 11 | Kilian Whalen | Allendale | 3.9 |
| 5 | 11 | Will Engbers | Holland Christian | 5.1 |
| 6 | 11 | Abatu Dykstra | Hamilton | 8.5 |
| 7 | 11 | Parker Tiethof | Allendale | 8.9 |
| 8 | 11 | Jeb Hillary | Grand Rapids Catholic Central | 9.8 |
| 9 | 11 | Keegan Hoekstra | Grand Rapids Christian | 10.7 |
| 10 | 12 | Luke Glasgow | Spring Lake | 10.7 |
| 11 | 11 | Ben Gross | Allendale | 10.8 |
| 12 | 10 | Sean Ryan | Grand Rapids Christian | 11.3 |
| 13 | 12 | Dylan Clark | Grand Rapids Christian | 12.3 |
| 14 | 12 | Jonathan Koetje | Grand Rapids Christian | 15.6 |
| 15 | 12 | Ian Richthammer | Grand Rapids Catholic Central | 16.1 |
| 16 | 12 | Peter Kuperus | Grand Rapids Christian | 17.0 |
| 17 | 10 | Micah Small | Grand Rapids Christian | 18.7 |
| 18 | 11 | Will Whitmore | Holland Christian | 19.0 |
| 19 | 11 | Parker Woodwyk | Spring Lake | 19.0 |
| 20 | 9 | Mason Hill | Allendale | 19.1 |
| 21 | 11 | Caden Guffey | Zeeland East | 20.2 |
| 22 | 10 | Aden Ashworth | Allendale | 22.9 |
| 23 | 11 | Aidan Brinks | Holland Christian | 23.7 |
| 24 | 11 | Aiden Kasprzak | Grand Rapids Catholic Central | 24.4 |
| 25 | 11 | Andrew Commeret | Comstock Park | 24.7 |
| 26 | 10 | Lukus Mendoza | Spring Lake | 25.4 |
| 27 | 11 | Vincent Pollock | Fruitport | 26.7 |
| 28 | 10 | Landon Gerritsma | Holland Christian | 29.7 |
| 29 | 11 | Brayden Rynsburger | Holland Christian | 30.5 |
| 30 | 11 | Noah Hernandez | Hamilton | 30.9 |

GIRLS
Ranked Teams
#4 Holland West Ottawa
#5 Grand Haven
#12 Rockford
#21 Jenison
#27 Zeeland West
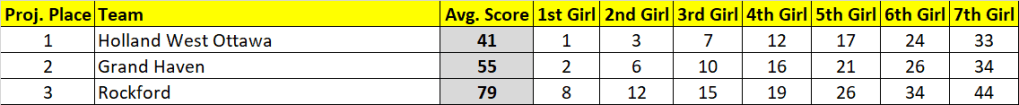
Projected Individual Qualifier Cutoff
I have the top-3 teams occupying 70% of the top-20 spots, sending the last individual qualifier back as far as 22nd.
| Projected Place | Team | Avg. Score | Avg. Place | Win % | Top 3 % |
| 1 | Holland West Ottawa | 41 | 1.1 | 86 | 95+ |
| 2 | Grand Haven | 55 | 1.9 | 14 | 95+ |
| 3 | Rockford | 79 | 3.0 | 95+ | |
| 4 | Jenison | 121 | 4.3 | ||
| 5 | Zeeland West | 138 | 5.3 | ||
| 6 | Hudsonville | 142 | 5.6 | ||
| 7 | Grandville | 192 | 7.1 | ||
| 8 | Cedar Springs | 220 | 8.2 | ||
| 9 | Muskegon Reeths-Puffer | 237 | 8.8 | ||
| 10 | Muskegon Mona Shores | 267 | 9.8 | ||
| 11 | Grand Rapids Northview | 325 | 11.0 | ||
| 12 | Grand Rapids Kenowa Hills | 364 | 12.0 | ||
| 13 | Grand Rapids Union | 402 | 13.0 | ||
| 14 | Wyoming | 458 | 14.0 |
| Projected Place | Grade | Name | Team | Avg. Place |
| 1 | 10 | Ava Porras | Holland West Ottawa | 1.8 |
| 2 | 11 | Valerie Beeck | Grand Haven | 2.1 |
| 3 | 10 | Addie Birkholz | Holland West Ottawa | 3.1 |
| 4 | 11 | Chloe DeRidder | Grandville | 4.5 |
| 5 | 11 | Jordyn Klaasen | Zeeland West | 7.8 |
| 6 | 10 | Cianah Budnik-Ramos | Grand Haven | 8.5 |
| 7 | 11 | Jane Olney | Holland West Ottawa | 8.7 |
| 8 | 11 | Addy Smith | Grand Haven | 9.1 |
| 9 | 9 | Daisy Cox | Rockford | 9.8 |
| 10 | 9 | Cassie Karasinski | Hudsonville | 11.5 |
| 11 | 10 | Trinity VanderWoude | Rockford | 13.4 |
| 12 | 11 | Emma Smith | Rockford | 13.4 |
| 13 | 12 | Maddie Vande Bunte | Jenison | 14.0 |
| 14 | 11 | Emma Gunnett | Holland West Ottawa | 14.3 |
| 15 | 11 | Abi Albright | Grand Haven | 15.0 |
| 16 | 11 | Naomi Diekman | Jenison | 15.5 |
| 17 | 10 | Jersi Bilek | Muskegon Reeths-Puffer | 15.6 |
| 18 | 11 | Natalie Lewis | Rockford | 17.9 |
| 19 | 9 | Lyla Dowling | Holland West Ottawa | 21.9 |
| 20 | 11 | Gracey Barry | Grand Haven | 23.1 |
| 21 | 11 | Helen Sachs | Holland West Ottawa | 23.2 |
| 22 | 12 | Tessa Rindfliesch | Zeeland West | 24.5 |
| 23 | 11 | Julia Frampton | Holland West Ottawa | 25.1 |
| 24 | 12 | Payton Hosley | Grand Haven | 26.7 |
| 25 | 10 | Macy Guikema | Jenison | 27.8 |
| 26 | 9 | Paige McMeans | Jenison | 28.2 |
| 27 | 11 | Melana Karsten | Rockford | 28.5 |
| 28 | 12 | Reiel Ghiglia | Hudsonville | 28.8 |
| 29 | 11 | Klea Verstrate | Hudsonville | 29.1 |
| 30 | 12 | Laurel Tolliver | Grand Haven | 30.3 |
BOYS
Ranked Teams
#3 Grand Haven
#11 Jenison
#22 Zeeland West
#23 East Kentwood
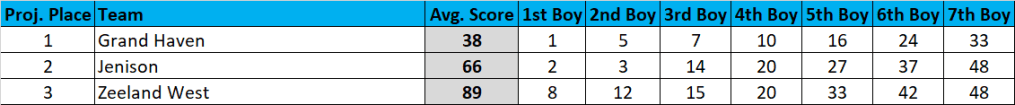
Projected Individual Qualifier Cutoff
18th Place.
| Projected Place | Team | Avg. Score | Avg. Place | Win % | Top 3 % |
| 1 | Grand Haven | 38 | 1.0 | 95+ | 95+ |
| 2 | Jenison | 66 | 2.1 | 95+ | |
| 3 | Zeeland West | 89 | 2.9 | 95+ | |
| 4 | Rockford | 132 | 4.4 | ||
| 5 | Holland West Ottawa | 138 | 4.7 | ||
| 6 | Grandville | 172 | 6.6 | ||
| 7 | Muskegon Reeths-Puffer | 173 | 6.7 | ||
| 8 | Cedar Springs | 194 | 8.1 | ||
| 9 | Hudsonville | 203 | 8.5 | ||
| 10 | Grand Rapids Northview | 308 | 10.1 | ||
| 11 | Muskegon Mona Shores | 323 | 11.0 | ||
| 12 | Grand Rapids Union | 351 | 12.0 | ||
| 13 | Grand Rapids Kenowa Hills | 397 | 13.0 | ||
| 14 | Wyoming | 431 | 14.0 | ||
| 15 | Muskegon | 483 | 15.0 |
| Projected Place | Grade | Name | Team | Avg. Place |
| 1 | 12 | Seth Norder | Grand Haven | 1.1 |
| 2 | 11 | Seth Conner | Jenison | 1.9 |
| 3 | 11 | Mason Lucas | Jenison | 3.5 |
| 4 | 11 | Ben Eisnor | Grand Haven | 5.5 |
| 5 | 12 | Jaxon Allen | Muskegon Reeths-Puffer | 6.6 |
| 6 | 9 | Luka Hammond | Grand Haven | 6.8 |
| 7 | 11 | Carter Livermore | Grandville | 6.8 |
| 8 | 12 | Roman Smith | Grand Haven | 9.0 |
| 9 | 10 | Robert Dodd | Zeeland West | 10.4 |
| 10 | 10 | Ethan Shoffner | Cedar Springs | 10.9 |
| 11 | 12 | Jack DeKruyter | Zeeland West | 11.4 |
| 12 | 10 | Keagan Smith | Zeeland West | 14.0 |
| 13 | 9 | Caden Livermore | Grandville | 15.6 |
| 14 | 11 | Kye Grant | Muskegon Reeths-Puffer | 16.6 |
| 15 | 10 | Aron Gal | Grand Haven | 17.0 |
| 16 | 12 | Max Vangrouw | Holland West Ottawa | 17.1 |
| 17 | 11 | Matthew Schwartz | Jenison | 17.4 |
| 18 | 11 | Noah Schuette | Rockford | 17.7 |
| 19 | 11 | Parker Strelecki | Jenison | 19.8 |
| 20 | 12 | Carson Hauch | Zeeland West | 20.1 |
| 21 | 10 | Aiden Weller | Cedar Springs | 23.7 |
| 22 | 11 | Dominic Otto | Jenison | 23.8 |
| 23 | 10 | Caleb TeBrake | Grand Rapids Northview | 23.8 |
| 24 | 12 | Gavin Betten | Rockford | 24.2 |
| 25 | 11 | Carson Berko | Grand Haven | 24.3 |
| 26 | 11 | Levi Jongekryg | Holland West Ottawa | 26.2 |
| 27 | 12 | Tate Bradley | Muskegon Reeths-Puffer | 26.2 |
| 28 | 12 | Nate Fahey | Rockford | 26.5 |
| 29 | 10 | Hayden Lafferty | Rockford | 28.2 |
| 30 | 10 | Jake Follett | Holland West Ottawa | 29.6 |