Blog

Uncategorized

2023 Regional Projections: Shrine Regional

Finally, the start of the season we’ve all been waiting for. Throw out all the fast times from September, but apply all the lessons learned through the summer and fall. Regional week is here and with it comes the many projections and previews I’ll write.

Just as last year and throughout the season, I’m projecting these using race simulations. Through a season’s worth of speed ratings, one can determine a runner’s average rating and the variability of those ratings. Both those factors are then weighed towards more recent meets, which are then simulated thousands of times using a Monte Carlo analysis (also described by TullyRunners here). Over those thousands of race simulations, one can determine a team’s average place and average score, a runner’s average place, odds on winning, and odds on qualifying.

These are useful in cross country scenarios, where you have consistent runners and those who are a bit more up and down. For example:

Tanner TimeTanner RatingTanner Avg.Tanner StDev.
15:30210  
15:45205  
16:00200  
16:15195  
16:301902007.91
MIXCSR TimeMIXCSR RatingMIXCSR Avg.MIXCSR StDev.
16:09197  
16:12196  
16:15195  
16:18194  
16:211931951.58

Jacob at his best might be faster than I in four of the five races during the season. I’d almost never be All-State in Division 1, but he might contend for a top-5 spot or place 60th.

If we did 20 simulations, this is how it might turn out:

RaceTanner Avg.Tanner StDevTanner RatingMIXCSR Avg.MIXCSR StDevMIXCSR Rating
12007.9202.11951.6195.6
22007.9196.21951.6194.1
32007.9190.01951.6199.2
42007.9193.41951.6192.5
52007.9206.81951.6195.7
62007.9201.81951.6196.1
72007.9171.61951.6194.9
82007.9189.21951.6195.9
92007.9205.51951.6197.0
102007.9203.81951.6192.6
112007.9192.31951.6196.5
122007.9196.91951.6196.4
132007.9198.51951.6195.6
142007.9203.21951.6194.1
152007.9193.91951.6192.6
162007.9199.31951.6193.2
172007.9208.71951.6194.2
182007.9213.71951.6194.6
192007.9212.61951.6197.1
202007.9206.31951.6193.9

I’d win four times, but I’d never have the ability to win a title like he had in Race 18. He’s usually All-State, but may cost his team a title through his effort in Race 7.

The simulations give the possibilities of those scenarios and all the various scoring scripts. A sixth girl that can pop off on any certain day, a reliable boy who always runs 17-flat, you name it. Hopefully, they better elucidate our contenders, qualifiers, and how these races play out over the weekend.

But always remember, races aren’t run on paper or on a computer. These projections are meant to better our sport, give more attention where little is given. Although I take pride in their accuracy, this endeavor would be quite boring if it were always perfect. I look forward to these being proven wrong and I expect to hear about it as well.

SUMMER PREVIEW
MID-SEASON

GIRLS

Ranked Teams

#11 Auburn Hills Oakland Christian
#19 Royal Oak Shrine
#22 Allen Park Cabrini

Projected Individual Qualifier Cutoff

21st Place

Projected PlaceTeamAvg. ScoreAvg. PlaceWin %Top 3 %
1Auburn Hills Oakland Christian431.18995+
2Royal Oak Shrine521.91195+
3Allen Park Cabrini673.095+
4Plymouth Christian Academy1034.0
5Birmingham Roeper1445.2
6Southfield Christian1526.0
7Academy of the Sacred Heart1626.8
8Austin Catholic2098.0

Projected PlaceGradeNameTeamAvg. Place
112Ava TeedAllen Park Cabrini1.1
211Eliza KeithAuburn Hills Oakland Christian2.1
310Madi HarePlymouth Christian Academy4.6
410Eleanor ColeLutheran Westland4.7
512Leah ZarrilliAuburn Hills Oakland Christian4.8
611Natalie GibbsBirmingham Roeper4.9
711Sarah GoodwinAuburn Hills Oakland Christian7.7
89Louisa DenksRoyal Oak Shrine8.5
911Rose LoseyRoyal Oak Shrine9.6
1012Karis KeithAuburn Hills Oakland Christian12.6
119Josephine MalcolmRoyal Oak Shrine13.6
1211Grace KendziukAllen Park Cabrini13.6
1312Morgan McNallyAcademy of the Sacred Heart15.6
1411Annaliese LoseyRoyal Oak Shrine15.8
1512Grace LigonSouthfield Christian17.0
1610Maya FergusonMarine City Cardinal Mooney17.1
1711Isobel MalcolmRoyal Oak Shrine17.3
1811Tess TillmanRoyal Oak Shrine19.0
1912Nicole TeedAllen Park Cabrini19.3
209Kassie KozloAllen Park Cabrini19.3
219Sydney EricksonLutheran Westland21.8
2212Leah KrogeAuburn Hills Oakland Christian22.0
2310Clara GroenPlymouth Christian Academy22.8
2412Kaitlyn JabczenskiAllen Park Cabrini23.6
2512Soleil WeaverPlymouth Christian Academy24.0
2611Chloe SurhighRoyal Oak Shrine24.5
2712Emma SmithAuburn Hills Oakland Christian28.2
2810Sarah AbaziSouthfield Christian28.9
2912Ella BushRiverview Gabriel Richard30.9
3011Addison GeislerNew Haven Merritt Academy31.7

BOYS

Ranked Teams

#13 Marine City Cardinal Mooney
#14 Royal Oak Shrine
#17 Lutheran Westland
#22 Auburn Hills Oakland Christian

Projected Individual Qualifier Cutoff

Any combination of these top-25 outfits could make it, so get yourself into the top-15 and guarantee a spot! And if not, don’t give up.
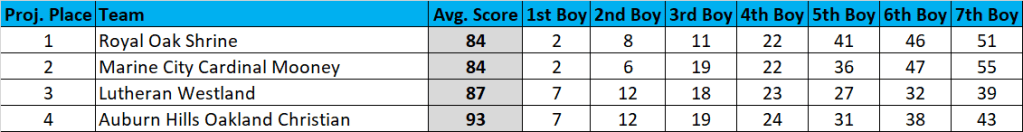
Projected PlaceTeamAvg. ScoreAvg. PlaceWin %Top 3 %
1Royal Oak Shrine842.12893
2Marine City Cardinal Mooney842.33483
3Lutheran Westland872.42580
4Auburn Hills Oakland Christian933.21344
5Riverview Gabriel Richard1365.1
6Birmingham Roeper1496.0
7Plymouth Christian Academy1627.0
8Detroit Frederick Douglass1838.0
9Allen Park Cabrini2149.1
10Austin Catholic2279.8
11New Haven Merritt Academy32111.0
12Detroit Davis Aerospace36212.0

Projected PlaceGradeNameTeamAvg. Place
110Abenezer CeroneRoyal Oak Shrine1.5
212Tyler LennMarine City Cardinal Mooney1.6
310Emmanuel MehariPlymouth Christian Academy4.6
410Rich FantiRiverview Gabriel Richard5.3
512Isaac ZammitMarine City Cardinal Mooney5.8
69Vern ClyneAuburn Hills Oakland Christian7.4
710Max BrannanLutheran Westland7.8
810Joel JohnsonDetroit Frederick Douglass8.4
910Michael BowkerRoyal Oak Shrine9.2
1010Andrew LopezRoyal Oak Shrine10.0
1112Evan SumnerPlymouth Christian Academy10.5
1211Tom ShaferLutheran Westland10.7
1312Luke DouglasAuburn Hills Oakland Christian11.9
149Jacob FerdubinskiRiverview Gabriel Richard13.5
1510Goni WongBirmingham Roeper15.7
1612Tommy AbaziSouthfield Christian19.4
1711Nico DiPonioAustin Catholic19.7
1812Adrian SmithDetroit Frederick Douglass19.9
1912Max ProcissiMarine City Cardinal Mooney20.3
2012Jeffrey McGuireLutheran Westland20.4
219Uzziel ThomassenAuburn Hills Oakland Christian21.1
2210Dominic BarrettoRiverview Gabriel Richard22.8
2311Evan JacobsMarine City Cardinal Mooney23.1
2410Caesar SomaRoyal Oak Shrine23.4
2510Andrew AbramowiczLutheran Westland24.8
2610William StorrieAuburn Hills Oakland Christian26.5
2712Joshua ReddypoguSouthfield Christian26.8
2812Nathan BetkeLutheran Westland27.9
2910Carter RusselburgAllen Park Cabrini31.4
3011Ralph KalenieckiAllen Park Cabrini31.8

Uncategorized

2023 Regional Projections: Anchor Bay Regional

Finally, the start of the season we’ve all been waiting for. Throw out all the fast times from September, but apply all the lessons learned through the summer and fall. Regional week is here and with it comes the many projections and previews I’ll write.

Just as last year and throughout the season, I’m projecting these using race simulations. Through a season’s worth of speed ratings, one can determine a runner’s average rating and the variability of those ratings. Both those factors are then weighed towards more recent meets, which are then simulated thousands of times using a Monte Carlo analysis (also described by TullyRunners here). Over those thousands of race simulations, one can determine a team’s average place and average score, a runner’s average place, odds on winning, and odds on qualifying.

These are useful in cross country scenarios, where you have consistent runners and those who are a bit more up and down. For example:

Tanner TimeTanner RatingTanner Avg.Tanner StDev.
15:30210  
15:45205  
16:00200  
16:15195  
16:301902007.91
MIXCSR TimeMIXCSR RatingMIXCSR Avg.MIXCSR StDev.
16:09197  
16:12196  
16:15195  
16:18194  
16:211931951.58

Jacob at his best might be faster than I in four of the five races during the season. I’d almost never be All-State in Division 1, but he might contend for a top-5 spot or place 60th.

If we did 20 simulations, this is how it might turn out:

RaceTanner Avg.Tanner StDevTanner RatingMIXCSR Avg.MIXCSR StDevMIXCSR Rating
12007.9202.11951.6195.6
22007.9196.21951.6194.1
32007.9190.01951.6199.2
42007.9193.41951.6192.5
52007.9206.81951.6195.7
62007.9201.81951.6196.1
72007.9171.61951.6194.9
82007.9189.21951.6195.9
92007.9205.51951.6197.0
102007.9203.81951.6192.6
112007.9192.31951.6196.5
122007.9196.91951.6196.4
132007.9198.51951.6195.6
142007.9203.21951.6194.1
152007.9193.91951.6192.6
162007.9199.31951.6193.2
172007.9208.71951.6194.2
182007.9213.71951.6194.6
192007.9212.61951.6197.1
202007.9206.31951.6193.9

I’d win four times, but I’d never have the ability to win a title like he had in Race 18. He’s usually All-State, but may cost his team a title through his effort in Race 7.

The simulations give the possibilities of those scenarios and all the various scoring scripts. A sixth girl that can pop off on any certain day, a reliable boy who always runs 17-flat, you name it. Hopefully, they better elucidate our contenders, qualifiers, and how these races play out over the weekend.

But always remember, races aren’t run on paper or on a computer. These projections are meant to better our sport, give more attention where little is given. Although I take pride in their accuracy, this endeavor would be quite boring if it were always perfect. I look forward to these being proven wrong and I expect to hear about it as well.

SUMMER PREVIEW
MID-SEASON

GIRLS

Ranked Teams

#22 Croswell-Lexington
#25 Warren Regina
#27 Armada

Projected Individual Qualifier Cutoff

19th Place in the case of both Armada and St. Clair being the third team.

Projected PlaceTeamAvg. ScoreAvg. PlaceWin %Top 3 %
1Croswell-Lexington581.64595+
2Warren Regina591.74395+
3Armada723.01271
4St. Clair823.730
5Macomb Lutheran North1205.0
6Marysville1536.3
7Richmond1606.7
8Marine City2258.2
9Yale2378.9
10Madison Heights Lamphere2799.9
11St. Clair Shores Lake Shore33111.0
12Harper Woods37312.0

Projected PlaceGradeNameTeamAvg. Place
111Eva ThompsonCroswell-Lexington1.4
212Ava BaltierraArmada2.0
312Morgan NewtonCroswell-Lexington3.3
411Brooklyn KhonArmada5.6
511Elizabeth AmbroggioWarren Regina6.0
612Kennedy RoskoppWarren Regina7.2
711Brynn HurleyCroswell-Lexington7.5
812Lilyana BrattSt. Clair8.6
911Lillian RutallieMarysville9.4
1012Samantha KookArmada9.6
1111Natalie LentineWarren Regina11.3
129Samantha WhitlamMacomb Lutheran North11.7
139Gabriella KomarowskiSt. Clair14.4
1411Lorelei MahonWarren Regina14.8
1512Brianna AlbersRichmond15.4
1611Allie KomarowskiSt. Clair17.9
1712Gabby FernandezWarren Regina19.7
1812Abagayle BarkleyCroswell-Lexington21.3
1910Molly McNabbSt. Clair21.4
2010Pauline ChapmanRichmond22.1
219Ella ThorntonSt. Clair22.3
2210Abigail DenoyerArmada23.2
2312Eliza NelsonCroswell-Lexington25.0
2412Casidhe FlesherMarine City25.7
2510Paulina ChapmanRichmond25.8
2611Isabella LaPerriereMacomb Lutheran North26.8
2712Ella DeshonMarysville27.2
2810Aubrey SargentSt. Clair27.6
299Avery StallmannMacomb Lutheran North27.9
309Evelyn BuckleyMacomb Lutheran North29.0

Anything Intriguing?

One single point separating Warren Regina and Cros-Lex. I have a feeling the Saddlelites are underrated because of their tough stretch of Kensington then County with a two-day break. On the other hand, the Pioneers are your defending champs with upperclass girls ready to defend that crown.

BOYS

Ranked Teams

#19 Yale
#21 St. Clair

Projected Individual Qualifier Cutoff

24th place behind the usually strong St. Clair and Yale teams.

Projected PlaceTeamAvg. ScoreAvg. PlaceWin %Top 3 %
1Yale371.27695+
2St. Clair401.82495+
3Macomb Lutheran North743.095+
4Marysville1604.8
5Madison Heights Lamphere1645.2
6Marine City1665.5
7Armada1746.5
8Richmond2068.0
9Croswell-Lexington2379.1
10Harper Woods26110.0
11Detroit East English31811.2
12Center Line32211.8

Projected PlaceGradeNameTeamAvg. Place
112Brewer SnayMacomb Lutheran North1.1
212Blake FergusonYale3.1
312Giovanni Pardo-KeeganYale3.2
412Acer CampbellYale4.0
512Vinny SchweihoferSt. Clair4.6
612Dylan DistelrathSt. Clair5.6
712Anthony GoatleyMadison Heights Lamphere8.4
812Jamison SnayMacomb Lutheran North8.5
911Jerry WestrickSt. Clair9.8
109Ethan KregerSt. Clair10.0
1112Dylan SchumannSt. Clair10.4
1211Teddy RutkofskeYale14.6
1311Wyatt MurtosYale14.9
1410Xavier RomanMacomb Lutheran North15.5
1511Kale KovachYale15.6
1612Luke NawrockiArmada18.3
1711Pete LutzMadison Heights Lamphere19.6
1810Brayden PrieskornSt. Clair20.6
1912Nathan VanderMeulenMarysville20.6
209Joshua MacriMacomb Lutheran North20.8
2111Korbyn ThorntonSt. Clair21.1
2212Alex RobertsonMarine City21.8
2310Ross WallaceHarper Woods22.8
2410Nolan KoroldenYale25.0
2512Jayden RobertsonMarine City26.3
2611Georgio AramouniMadison Heights Lamphere26.8
279Javaris JacksonHarper Woods28.5
2811Grayson SutherlandMacomb Lutheran North28.6
2912Tyler BucklandArmada28.8
3010Dalton RossMarine City31.9

Anything Intriguing?

Another year of the perennial Yale/St. Clair battle. They’re gonna start giving this rivalry a name soon. The team from up north has claimed victory in the three matchups at Muskrat, Portage, and Marysville. But the Saints just raced to PR’s from over 50% of their athletes at Metro Beach.

SUMMER PREVIEW
MID-SEASON

GIRLS

Ranked Teams

#1 Romeo
#14 Macomb Dakota
#16 Fraser

Projected Individual Qualifier Cutoff

23rd place, about as deep into these as you’ll get.

Projected PlaceTeamAvg. ScoreAvg. PlaceWin %Top 3 %
1Romeo201.095+95+
2Macomb Dakota752.595+
3Fraser752.595+
4Rochester Hills Stoney Creek1184.1
5Grosse Pointe South1454.9
6Utica Eisenhower2036.4
7Chippewa Valley2167.1
8Port Huron Northern2378.1
9Grosse Pointe North2438.5
10St. Clair Shores Lakeview29310.5
11L’Anse Creuse North30411.3
12Anchor Bay30411.3
13L’Anse Creuse33712.9

Projected PlaceGradeNameTeamAvg. Place
19Annie HrabovskyRomeo1.4
210Natalia GuaresimoRomeo2.5
312Jayden HarbertsMacomb Dakota3.0
410Emmerson ClorRomeo3.5
511Violet HrabovskyRomeo5.5
612Mariah BelmontMacomb Dakota7.0
710Leah CorbyRochester Hills Stoney Creek8.1
811Lillian DeskinsRomeo8.2
911Olivia PurdyRomeo8.9
1011Grace GrupidoFraser9.0
1110Katelyn FrazierFraser12.5
1212Lauren ThomasAnchor Bay14.4
1312Remi FlanzFraser15.3
1410Lidia ClancyMacomb Dakota15.5
1511Savannah SpanglerGrosse Pointe South16.8
1612Gracie YoungbloodRomeo17.0
1711Charlotte LongUtica Eisenhower17.3
1810Olivia CereskaFraser17.7
1912Sydney GergicsRochester Hills Stoney Creek20.0
209Maggie BaginskiUtica Eisenhower22.5
2111Julia TimpaMacomb Dakota24.3
2211Luciana RodriguezFraser24.3
2312Morgan DeenikGrosse Pointe South26.7
249Aubrey RizzoMacomb Dakota27.0
2511Chloe CaulfieldGrosse Pointe South27.5
2612Alyssa KoRochester Hills Stoney Creek28.1
2711Shelby StabileL’Anse Creuse28.4
2812Grace GutmannChippewa Valley29.0
2910Samantha LangolfPort Huron Northern29.4
309Lilianna PeaceChippewa Valley29.9

Anything Intriguing?

Last year, it was their boys breaking the 36 year drought. Fraser’s girls have a nearly 20 year absence from the State Finals and it appears they’re in prime position to make a return voyage to Brooklyn. Also, does anyone have a clue on these additional qualifiers?

BOYS

Ranked Teams

#8 Romeo
#14 Macomb Dakota
#25 Anchor Bay

Projected Individual Qualifier Cutoff

16th Place.

Projected PlaceTeamAvg. ScoreAvg. PlaceWin %Top 3 %
1Romeo591.37195+
2Macomb Dakota641.72995+
3Anchor Bay953.095+
4Utica Eisenhower1654.9
5Grosse Pointe South1674.7
6L’Anse Creuse North1846.2
7Port Huron Northern1937.1
8Chippewa Valley2098.3
9Grosse Pointe North2208.9
10Rochester Hills Stoney Creek23310.0
11Fraser23710.0
12L’Anse Creuse28912.3
13St. Clair Shores Lakeview30312.6
14Warren DeLaSalle37514.0
15Warren Woods Tower44715.0
16Roseville52716.4
17Port Huron53216.7

Projected PlaceGradeNameTeamAvg. Place
112Thomas WestphalAnchor Bay1.4
212Vincent GuaresimoRomeo1.8
312Carter FoxMacomb Dakota3.6
412Connor ClorRomeo4.2
512Tyler BrothersUtica Eisenhower6.2
612Dylan PenberthyL’Anse Creuse North7.2
712Simon DavisMacomb Dakota8.3
812Jack DeWaeleChippewa Valley10.4
911Lucas LaMilzaMacomb Dakota11.1
1012Luke OysterUtica Eisenhower11.2
1112Brandon PenberthyL’Anse Creuse North11.2
1211Colton HowellMacomb Dakota12.0
1312Bryce GoodsellRomeo13.1
1412Zachary RubiczAnchor Bay14.8
1512Luke VanderHeuvelPort Huron Northern15.9
1610Brock WashburnRochester Hills Stoney Creek17.9
1712Luke MaherPort Huron Northern20.5
1810Luke AllenRomeo21.0
1912Michael MagnoliRomeo21.1
2011Aidan DalyL’Anse Creuse21.7
2112Jet MillerGrosse Pointe South22.5
2212Tommy CaulfieldGrosse Pointe South23.0
2312Aidan LeslieAnchor Bay24.1
2411Greg VogtAnchor Bay24.7
2511Caleb KoselGrosse Pointe North25.4
2610Eric DeWaeleChippewa Valley25.6
2712David RochonGrosse Pointe North28.1
2810James BrickelRomeo28.6
2910Lance EdghillFraser29.5
3012Gabe RuschAnchor Bay30.0

Anything Intriguing?

The championship rubber match between Macomb Dakota and Romeo. Thanks to an ever-improving Bryce Goodsell, the Bulldogs captured the County crown. Lucas LaMilza and Colton Howell had big efforts in the Cougar win at The Beach. Who steps up to grab this trophy?

Uncategorized

2023 Regional Projections: DeWitt Regional

Finally, the start of the season we’ve all been waiting for. Throw out all the fast times from September, but apply all the lessons learned through the summer and fall. Regional week is here and with it comes the many projections and previews I’ll write.

Just as last year and throughout the season, I’m projecting these using race simulations. Through a season’s worth of speed ratings, one can determine a runner’s average rating and the variability of those ratings. Both those factors are then weighed towards more recent meets, which are then simulated thousands of times using a Monte Carlo analysis (also described by TullyRunners here). Over those thousands of race simulations, one can determine a team’s average place and average score, a runner’s average place, odds on winning, and odds on qualifying.

These are useful in cross country scenarios, where you have consistent runners and those who are a bit more up and down. For example:

Tanner TimeTanner RatingTanner Avg.Tanner StDev.
15:30210  
15:45205  
16:00200  
16:15195  
16:301902007.91
MIXCSR TimeMIXCSR RatingMIXCSR Avg.MIXCSR StDev.
16:09197  
16:12196  
16:15195  
16:18194  
16:211931951.58

Jacob at his best might be faster than I in four of the five races during the season. I’d almost never be All-State in Division 1, but he might contend for a top-5 spot or place 60th.

If we did 20 simulations, this is how it might turn out:

RaceTanner Avg.Tanner StDevTanner RatingMIXCSR Avg.MIXCSR StDevMIXCSR Rating
12007.9202.11951.6195.6
22007.9196.21951.6194.1
32007.9190.01951.6199.2
42007.9193.41951.6192.5
52007.9206.81951.6195.7
62007.9201.81951.6196.1
72007.9171.61951.6194.9
82007.9189.21951.6195.9
92007.9205.51951.6197.0
102007.9203.81951.6192.6
112007.9192.31951.6196.5
122007.9196.91951.6196.4
132007.9198.51951.6195.6
142007.9203.21951.6194.1
152007.9193.91951.6192.6
162007.9199.31951.6193.2
172007.9208.71951.6194.2
182007.9213.71951.6194.6
192007.9212.61951.6197.1
202007.9206.31951.6193.9

I’d win four times, but I’d never have the ability to win a title like he had in Race 18. He’s usually All-State, but may cost his team a title through his effort in Race 7.

The simulations give the possibilities of those scenarios and all the various scoring scripts. A sixth girl that can pop off on any certain day, a reliable boy who always runs 17-flat, you name it. Hopefully, they better elucidate our contenders, qualifiers, and how these races play out over the weekend.

But always remember, races aren’t run on paper or on a computer. These projections are meant to better our sport, give more attention where little is given. Although I take pride in their accuracy, this endeavor would be quite boring if it were always perfect. I look forward to these being proven wrong and I expect to hear about it as well.

SUMMER PREVIEW
MID-SEASON

GIRLS

Ranked Teams

#4 Pewamo-Westphalia
#6 Stanton Central Montcalm

Projected Individual Qualifier Cutoff

21st Place

Projected PlaceTeamAvg. ScoreAvg. PlaceWin %Top 3 %
1Pewamo-Westphalia321.18795+
2Stanton Central Montcalm381.91395+
3Laingsburg933.095+
4Ovid-Elsie1364.1
5New Lothrop1515.2
6Almont1585.7
7Bath1897.2
8Chesaning1968.0
9Perry2118.8
10Montrose25310.0

Projected PlaceGradeNameTeamAvg. Place
111Kyah HoffmanStanton Central Montcalm1.0
211Whitney WernerPewamo-Westphalia2.0
311Ashley ChoponisStanton Central Montcalm3.1
410Grace CostonStanton Central Montcalm3.9
59Alyssa KramerPewamo-Westphalia5.8
612Melanie WernerPewamo-Westphalia6.1
710Abbie SchneiderPewamo-Westphalia8.1
810Anna PoppemaBath8.3
911Emily RathkaLaingsburg9.1
109Jenna KeilenPewamo-Westphalia10.5
119Andrea RolstonStanton Central Montcalm11.0
1210Clarissa BaeseOvid-Elsie11.5
1310Lilly RooksPewamo-Westphalia12.2
1412Isabell HelmanPewamo-Westphalia13.9
1511Piper WhiteOvid-Elsie16.0
1610Laila EvolaAlmont16.0
1711Evelyn LoggheLaingsburg18.5
1810Braelyn BuntingStanton Central Montcalm18.8
1910Hazel BurleyLaingsburg19.3
2012Ayla DeLaurierAlmont22.2
2112Kaia SpiessOvid-Elsie22.3
2212Taylor BaileyChesaning22.7
239Samantha GutzmanLaingsburg22.8
2411Addison RuszLaingsburg23.7
2512Hannah OakesChesaning26.0
2612Klara MulcahyNew Lothrop27.4
2712Sara DammannNew Lothrop27.6
2810Mackenzie HillsBath27.7
2911Lexy AndresNew Lothrop29.4
3012Josie BaumanNew Lothrop31.6

Any Intriguing Battles?

Will Stanton Central Montcalm pull off the upset and bust through the perennially strong Pirate pack? I think there’s a better chance on the girls side, although both are fully capable. Paths to victory include placing three very highly or their 4th and 5th picking up some very manageable spots late.

BOYS

Ranked Teams

#2 Pewamo-Westphalia
#6 Stanton Central Montcalm
#14 Bath

Projected Individual Qualifier Cutoff

Going all the way down to 25th(!!!) place.

Projected PlaceTeamAvg. ScoreAvg. PlaceWin %Top 3 %
1Pewamo-Westphalia401.19495+
2Stanton Central Montcalm471.9695+
3Bath623.095+
4Ovid-Elsie1584.9
5Laingsburg1594.7
6New Lothrop1816.0
7Almont1946.7
8Montrose2408.6
9Chesaning2539.4
10Perry2609.6
11Memphis27210.5
12Mt Morris29911.9
13Burton-Bendle33312.9

Projected PlaceGradeNameTeamAvg. Place
112Collin FarmerPewamo-Westphalia1.1
210Gage HoffmanStanton Central Montcalm2.1
312Graham CostonStanton Central Montcalm3.1
412Carter HolmesBath5.2
510Noah DevereauxLaingsburg6.1
610Sylus WilsonStanton Central Montcalm6.6
79Wyatt WernerPewamo-Westphalia8.0
811Allan GeorgePewamo-Westphalia9.3
99River FoxBath10.2
1011Luke SkidmoreBath10.9
119John KowatchPewamo-Westphalia11.5
1211Sam MuirheadPewamo-Westphalia11.6
1312Andrew KoenigsknechtBath11.8
1411Clay PowellOvid-Elsie12.0
159Nolan MitchellPewamo-Westphalia14.4
1610Kyler FertigStanton Central Montcalm16.0
179Charlie GeorgePewamo-Westphalia16.4
1810Evan RolstonStanton Central Montcalm19.0
199Kai FisherMemphis21.6
2011Lieu VinckeNew Lothrop23.7
2110Madden StarkweatherBath23.8
2211Kevin HeslipNew Lothrop24.7
2312Josiah CurryStanton Central Montcalm25.6
2410Joshua MillerOvid-Elsie25.9
259Jaxon HemgesbergChesaning26.3
2612Kyle BaldwinMt Morris28.8
279Tyler RockafellowPerry29.1
289Colton GrzybAlmont29.4
2911Felix RamirezLaingsburg29.9
3011James KellyOvid-Elsie31.0

SUMMER PREVIEW
MID-SEASON

GIRLS

Ranked Teams

#9 DeWitt
#11 St. Johns
#15 Owosso

Projected Individual Qualifier Cutoff

18th place with these top-heavy squads.

Projected PlaceTeamAvg. ScoreAvg. PlaceWin %Top 3 %
1DeWitt571.46095+
2St. Johns601.64095+
3Owosso832.995+
4Mason1374.5
5Haslett1445.0
6Williamston1535.6
7Parma Western1887.5
8Charlotte1917.6
9Corunna2078.8
10Fowlerville25410.1
11Eaton Rapids27710.9
12Jackson Northwest31612.0
13Lansing Eastern39613.0

Projected PlaceGradeNameTeamAvg. Place
19Ava SchaferSt. Johns1.2
212Meghan FordMason1.8
312Abby YoungSt. Johns3.7
411Kayla WilliamsDeWitt3.8
510Chloe KhonJackson Northwest7.1
612Clara FletcherSt. Johns7.3
712Libby SummerlandOwosso11.0
811Ayla HolbenDeWitt11.1
910Emma CrandellOwosso11.1
109Sophia SchaferWilliamston11.8
1111Autumn ThompsonDeWitt12.1
1211Nicole SchaferWilliamston12.2
1310Miriam KlohaSt. Johns12.3
1411Josie JenkinsonOwosso13.0
1511Mia WilliamsDeWitt14.0
1612Dora HenryHaslett15.2
1710Reese SupianoskiWilliamston17.1
1811Hayven ThielCorunna17.6
199Jaidyn NickelsCorunna18.8
2010Isabella TaberDeWitt19.3
2111Julionna WestOwosso21.0
2210Abby RusselHaslett22.5
2311Ryleigh HanlinDeWitt24.3
249Colette CharchutHaslett25.0
2511Raquel CureyParma Western26.3
2611Natalie SummerlandOwosso26.6
2710Avari MontgomeryCharlotte27.7
2812Analise ChelottiDeWitt28.9
2910Aubrey MetzgerMason29.5
3010Delaney RichardsonFowlerville30.9

Any Intriguing Battles?

DeWitt has been coming on strong as of late, entering the top-10 through their results from Greater Lansing and the CAAC Blue, the Panthers finishing 2nd in each. Do they have enough depth to overcome the Redwings’ powerful top-3?

BOYS

Ranked Teams

#24 Parma Western
#26 St. Johns
#27 DeWitt

Projected Individual Qualifier Cutoff

15th Place, as this seems to be a much better individual region than a team region.

Projected PlaceTeamAvg. ScoreAvg. PlaceWin %Top 3 %
1DeWitt851.75195+
2Parma Western872.02995+
3St. Johns922.71678
4Corunna1083.629
5Mason1465.5
6Haslett1485.5
7Eaton Rapids1847.0
8Williamston2208.3
9Fowlerville2338.7
10Charlotte26710.0
11Owosso30511.9
12Lansing Waverly30812.1
13Jackson Northwest30912.4
14Lansing Eastern32913.6
15Lansing Sexton49915.0

Projected PlaceGradeNameTeamAvg. Place
112Nate CarmodyHaslett1.3
211Alex DonethMason2.8
311Dylan LydicHaslett3.0
412Isaac StaibSt. Johns4.4
511Nolan InglisDeWitt4.7
610Edison LopemanParma Western6.7
712Cooper SingletonParma Western6.8
89Ryan GoodParma Western7.9
912Matthew SchraubenSt. Johns8.1
1011Simon ErfourthOwosso11.7
1112Brennan McKoneDeWitt12.0
1211Conner McCormickMason12.1
1310Payton ChandlerCorunna12.9
1411Jack HuntingtonEaton Rapids15.9
1511Lucas MooreFowlerville17.0
1611Braylen EatonCharlotte17.3
1711Bobby DonleyCorunna17.3
1810Aidan RokaCorunna18.4
1912Xander MaliskaSt. Johns18.8
209Mason RabornDeWitt22.9
2112Kenny EvansCorunna23.1
2211Jackson WalthornDeWitt23.3
2311Ian GoodrichDeWitt26.6
2412Daniel WilsonWilliamston27.3
2510Reagan WardSt. Johns28.2
2610Grant ConleyCharlotte29.2
2711Gabi MartinezLansing Eastern30.1
289Will ChelottiDeWitt31.0
2911Drew HolevacEaton Rapids31.4
3011Nathan SzilagyiFowlerville31.7

Any Intriguing Battles?

Can Corunna shock the world again? Last year, the Cavaliers qualified for State as a longshot, coming in with a 6% chance. They’re almost 5x as likely this time around and as expected, just blasted the field at Shiawassee County.