Blog

Uncategorized

2023 Regional Projections: Kensington Regional

Finally, the start of the season we’ve all been waiting for. Throw out all the fast times from September, but apply all the lessons learned through the summer and fall. Regional week is here and with it comes the many projections and previews I’ll write.

Just as last year and throughout the season, I’m projecting these using race simulations. Through a season’s worth of speed ratings, one can determine a runner’s average rating and the variability of those ratings. Both those factors are then weighed towards more recent meets, which are then simulated thousands of times using a Monte Carlo analysis (also described by TullyRunners here). Over those thousands of race simulations, one can determine a team’s average place and average score, a runner’s average place, odds on winning, and odds on qualifying.

These are useful in cross country scenarios, where you have consistent runners and those who are a bit more up and down. For example:

Tanner TimeTanner RatingTanner Avg.Tanner StDev.
15:30210  
15:45205  
16:00200  
16:15195  
16:301902007.91
MIXCSR TimeMIXCSR RatingMIXCSR Avg.MIXCSR StDev.
16:09197  
16:12196  
16:15195  
16:18194  
16:211931951.58

Jacob at his best might be faster than I in four of the five races during the season. I’d almost never be All-State in Division 1, but he might contend for a top-5 spot or place 60th.

If we did 20 simulations, this is how it might turn out:

RaceTanner Avg.Tanner StDevTanner RatingMIXCSR Avg.MIXCSR StDevMIXCSR Rating
12007.9202.11951.6195.6
22007.9196.21951.6194.1
32007.9190.01951.6199.2
42007.9193.41951.6192.5
52007.9206.81951.6195.7
62007.9201.81951.6196.1
72007.9171.61951.6194.9
82007.9189.21951.6195.9
92007.9205.51951.6197.0
102007.9203.81951.6192.6
112007.9192.31951.6196.5
122007.9196.91951.6196.4
132007.9198.51951.6195.6
142007.9203.21951.6194.1
152007.9193.91951.6192.6
162007.9199.31951.6193.2
172007.9208.71951.6194.2
182007.9213.71951.6194.6
192007.9212.61951.6197.1
202007.9206.31951.6193.9

I’d win four times, but I’d never have the ability to win a title like he had in Race 18. He’s usually All-State, but may cost his team a title through his effort in Race 7.

The simulations give the possibilities of those scenarios and all the various scoring scripts. A sixth girl that can pop off on any certain day, a reliable boy who always runs 17-flat, you name it. Hopefully, they better elucidate our contenders, qualifiers, and how these races play out over the weekend.

But always remember, races aren’t run on paper or on a computer. These projections are meant to better our sport, give more attention where little is given. Although I take pride in their accuracy, this endeavor would be quite boring if it were always perfect. I look forward to these being proven wrong and I expect to hear about it as well.

SUMMER PREVIEW
MID-SEASON

GIRLS

Ranked Teams

#8 Lansing Catholic
#11 Leslie

Projected Individual Qualifier Cutoff

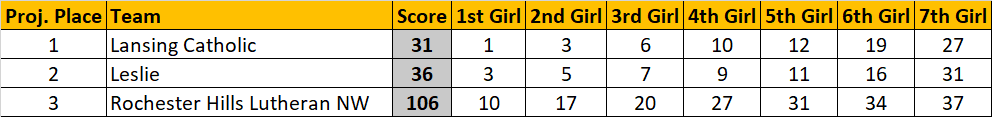
In a very front-loaded region, 22nd place.

Projected PlaceTeamAvg. PlaceAvg. ScoreWin %Qualify %
1Lansing Catholic1.3317395+
2Leslie1.7362795+
3Rochester Hills Lutheran NW3.010695+
4Wixom St. Catherine4.3136
5Madison Heights Bishop Foley5.0145
6Stockbridge5.9157
7Algonac6.9173
8Charyl Stockwell Academy8.2209
9Clawson9.2226
10New Haven9.6233

Projected PlaceGradeNameTeamAvg. Place
112Tessa RoeLansing Catholic1.0
210Frances MelinnLansing Catholic3.2
39Reagan LeesWixom St. Catherine3.6
410Hailey CreisherLeslie4.4
511Erin LubahnLeslie4.8
69Grace WonchLansing Catholic5.7
711Jaidyn SmithLeslie8.4
812Jalynn SchmelterLeslie8.4
912Abby RiceRochester Hills Lutheran NW10.4
109Avery MillerLansing Catholic10.8
119Mia PapendickLeslie11.5
1210Kaitlin LudwigLansing Catholic11.7
1310Jasmine WalkerAlgonac13.4
1411Kerith ShortUniversity Liggett14.6
159Emily SatkowiakStockbridge15.9
169Makya IshamLeslie16.3
1710Jaylee ChapmanStockbridge17.2
1812Kendall ZaliwskiRochester Hills Lutheran NW19.1
1911Maddie SzlachtaRochester Hills Lutheran NW20.6
2011Ava VaccaroStockbridge21.2
2110Stella LipinskiLansing Catholic21.9
2212Madison JuchnoWixom St. Catherine23.8
2312Carmellina BiaforaMadison Heights Bishop Foley23.9
2410Ella HeffnerCharyl Stockwell Academy24.1
2512Lovelyn KetepaClawson25.8
269Amanda LudwigLansing Catholic27.4
2711Kate BennettAlgonac27.4
2810Cristina WenderskiWixom St. Catherine27.6
2911Josephine MalyszMadison Heights Bishop Foley30.1
3011Grace MacDonaldRochester Hills Lutheran NW31.3

Any Intriguing Battles?

Leslie and Lansing Catholic appear to be neck and neck. Although the projections say one thing, results from this season say another. Just 10 days ago at Greater Lansing, the Blackhawks top-3 dominated the D3 crowd, competing with P-W for top honors among those teams. Though an advantage for LC might come in that their home course is filled with hills, as is the final mile at Possum Hollow.

BOYS

Ranked Teams

#21 Leslie
#25 Lansing Catholic

Projected Individual Qualifier Cutoff

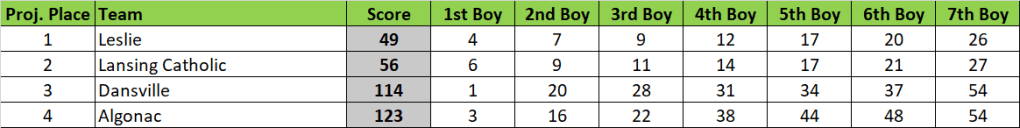
19th-20th Place. The projections have Algonac as a bit stronger toward the front, which might open a spot lower if they’re able to pull off the upset.

Projected PlaceTeamAvg. PlaceAvg. ScoreWin %Qualify %
1Leslie1.3497595+
2Lansing Catholic1.8562595+
3Dansville3.2114 81
4Algonac3.8123 19
5Charyl Stockwell Academy5.5156  
6Rochester Hills Lutheran NW6.5167  
7Stockbridge6.6168  
8University Liggett7.3176  
9Clawson9.5246  
10Madison Heights Bishop Foley10.1257  
11New Haven10.4264  
12Detroit Osborn12.0338  

Projected PlaceGradeNameTeamAvg. Place
111Theodore DavisDansville1.0
210Julian WalkerAlgonac2.6
312Anthony UrbaniakCharyl Stockwell Academy2.8
49Kenneth ManglesLeslie5.7
510Lucas GatesLansing Catholic5.9
611Michael DarlingtonUniversity Liggett6.1
79Cooper SchmelterLeslie6.8
89Matthew KilleenLeslie8.9
99Everett BeachLansing Catholic9.9
109Téo KrummLansing Catholic10.2
119William GancerStockbridge11.0
1210Grason WeberLeslie12.2
139Finn KorteLansing Catholic14.9
1410Blaise DemkoLansing Catholic16.0
1511Kyan IshamLeslie17.8
1612Ethan WrightStockbridge17.8
1711Jose DomecqLeslie18.5
1810Zach WitherspoonAlgonac18.6
199Clayton GadyUniversity Liggett19.2
2010Owen BeinditAlgonac19.8
219Ayden MayrDansville20.1
229Hayden SeleskyLansing Catholic20.8
2310Brody UrbaniakCharyl Stockwell Academy22.2
2412Logan HileLeslie25.8
259Preston VarnauskasRochester Hills Lutheran NW26.1
2612Logan FowlerNew Haven26.6
2710Hayden RicheyLansing Catholic26.8
289Owen WindgastonClawson27.1
2910Ryder DaytonRochester Hills Lutheran NW29.1
3012Calvin vanHartesveltDansville30.0

Any Intriguing Battles?

Just as the girls, Leslie and Lansing Catholic will likely duel for the team title, but we could have some intrigue for the 3rd qualifier. In late August, both Dansville and Algonac came over to the shores of Kent Lake for the Milford Invite. Dansville obtained a significant victory over the Muskrats. Since then, Algonac has had noticeable improvement from their freshmen and their frontrunner, but will it be enough?

SUMMER PREVIEW
MID-SEASON

GIRLS

Ranked Teams

#19 White Lake Lakeland
#24 Walled Lake Northern

Projected Individual Qualifier Cutoff

15th or 16th Place.

Projected PlaceTeamAvg. PlaceAvg. ScoreWin %Qualify %
1White Lake Lakeland1.2588195+
2Walled Lake Northern2.0721795+
3Highland-Milford3.210373
4Novi3.912627
5South Lyon5.7166
6Birmingham Seaholm6.1171
7Royal Oak6.4177
8Walled Lake Western7.6194
9South Lyon East9.0241
10Walled Lake Central10.3275
11West Bloomfield11.2291
12North Farmington11.9305
13Berkley12.6318
14Beverly Hills Groves14.0383

Projected PlaceGradeNameTeamAvg. Place
111Ava AlicandroWhite Lake Lakeland1.5
212Alisia OlteanuWalled Lake Western3.2
310Kayla WardSouth Lyon4.5
412Emma HoffmeyerWalled Lake Western4.6
512Madelyn GordonWalled Lake Northern6.6
69Jillian BroylesHighland-Milford6.7
711Alena TiernanWhite Lake Lakeland8.1
89Maya PletzerWhite Lake Lakeland8.7
912Ava KurczewskiWalled Lake Northern8.9
109Emily AltWalled Lake Northern9.2
1110Macy CzeladaSouth Lyon11.5
129Claire PorinskySouth Lyon East16.7
1310Lauren BradleyHighland-Milford16.8
1411Emily BieniaszWalled Lake Central18.0
1511Natalie JoinerWhite Lake Lakeland19.0
169Kareena BabuNovi22.2
1710Mya TassNovi22.5
189Katelynn EgliNovi22.5
1912Katherine WischmanRoyal Oak23.3
209Morgan ScallyWhite Lake Lakeland23.7
2111Isabelle KrauseWalled Lake Northern24.3
2211Macy JenkinsHighland-Milford24.5
2311Cora LiuNorth Farmington25.2
249Paige HallerWalled Lake Central27.1
2512Mackenzie HendryWhite Lake Lakeland27.2
2611Kerrigan KennedyHighland-Milford27.3
279Allie GallagherWalled Lake Northern27.5
289Jane MeineckeRoyal Oak27.5
2912Elaine BurkmyreWalled Lake Western28.0
3011Ellie NohovigHighland-Milford28.9

Any Intriguing Battles?

We’re blessed to be able to peek back 2.5 weeks ago, where the Lakeland girls survived the final hills in order to hold off Walled Lake Northern. We’re also blessed to have that highly-competitive LVC Championship, where Allie Gallagher showed much mettle, rising into the Knight scorers and displacing just enough White Lake girls. Now we get the rubber match!

BOYS

Ranked Teams

#12 White Lake Lakeland
#13 Walled Lake Northern

Projected Individual Qualifier Cutoff

17th or 18th Place.

Projected PlaceTeamAvg. PlaceAvg. ScoreWin %Qualify %
1White Lake Lakeland1.5565395+
2Walled Lake Northern1.5574795+
3Highland-Milford3.6104 54
4Novi3.8109 43
5Royal Oak5.3127  
6Detroit Catholic Central5.4132  
7South Lyon7.0193  
8Berkley8.5283  
9Birmingham Seaholm8.6287  
10Brother Rice10.1316  
11South Lyon East12.1347  
12North Farmington12.7355  
13Walled Lake Central12.7355  
14Beverly Hills Groves12.9357  
15West Bloomfield14.5380  
16Walled Lake Western16.0434  

Projected PlaceGradeNameTeamAvg. Place
112Sebastian RamirezRoyal Oak1.7
212Ty ParkerWalled Lake Northern2.3
310Kyle O’RourkeHighland-Milford2.4
412Pierce GrzymkowskiWhite Lake Lakeland4.2
512Evan RiceWalled Lake Northern5.6
612Oliver MossBerkley6.7
712Braxton SipesRoyal Oak7.9
812Ryan WardWhite Lake Lakeland10.3
912Lucas KarbelWalled Lake Northern11.2
1010Gavin JohnsWhite Lake Lakeland12.9
1111Drew AbbottDetroit Catholic Central13.8
1212Noah TiernanWhite Lake Lakeland14.7
1311Matthew VerellenWhite Lake Lakeland14.8
1411Nolan TillRoyal Oak15.4
159Nathan BrussWalled Lake Northern16.5
1612Carter LukasNovi16.9
1711Ryan CarrannantoHighland-Milford17.9
1812Julian LiangNovi20.3
199Briggs WarrenNovi20.6
2010Soma SatoNovi21.5
2112Brayden MullinsHighland-Milford22.1
2212Ryan IllikmanDetroit Catholic Central22.6
2312Liam CollinsBrother Rice25.0
2411Ayden McDonaldWhite Lake Lakeland25.7
2511Chase GriffithWalled Lake Northern26.9
2610Finn GammerathWalled Lake Northern27.6
2710Gavin TischDetroit Catholic Central28.1
2812Dylan ShoreshBirmingham Seaholm28.3
2912Skylar Jess-IseneggerHighland-Milford30.6
3011Thomas WatsonDetroit Catholic Central32.1

Any Intriguing Battles?

Thanks to a clutch performance from sophomore Finn Gammerath, the Walled Lake Northern boys pulled off a minor upset in their win of the LVC. Personal bests were hard to come by last week, but dude broke into the 16’s for the first time ever in that championship race. Surely the Eagles are looking for revenge and this could go either way. Even though White Lake skipped out on the County meet, they have had positive experiences on this course, such as their win over Milford. If you can beat the Mavs on their home course, you’ve got a darn good team.

Uncategorized

2023 Regional Projections: Portage Central (Friday)

Finally, the start of the season we’ve all been waiting for. Throw out all the fast times from September, but apply all the lessons learned through the summer and fall. Regional week is here and with it comes the many projections and previews I’ll write.

Just as last year and throughout the season, I’m projecting these using race simulations. Through a season’s worth of speed ratings, one can determine a runner’s average rating and the variability of those ratings. Both those factors are then weighed towards more recent meets, which are then simulated thousands of times using a Monte Carlo analysis (also described by TullyRunners here). Over those thousands of race simulations, one can determine a team’s average place and average score, a runner’s average place, odds on winning, and odds on qualifying.

These are useful in cross country scenarios, where you have consistent runners and those who are a bit more up and down. For example:

Tanner TimeTanner RatingTanner Avg.Tanner StDev.
15:30210  
15:45205  
16:00200  
16:15195  
16:301902007.91
MIXCSR TimeMIXCSR RatingMIXCSR Avg.MIXCSR StDev.
16:09197  
16:12196  
16:15195  
16:18194  
16:211931951.58

Jacob at his best might be faster than I in four of the five races during the season. I’d almost never be All-State in Division 1, but he might contend for a top-5 spot or place 60th.

If we did 20 simulations, this is how it might turn out:

RaceTanner Avg.Tanner StDevTanner RatingMIXCSR Avg.MIXCSR StDevMIXCSR Rating
12007.9202.11951.6195.6
22007.9196.21951.6194.1
32007.9190.01951.6199.2
42007.9193.41951.6192.5
52007.9206.81951.6195.7
62007.9201.81951.6196.1
72007.9171.61951.6194.9
82007.9189.21951.6195.9
92007.9205.51951.6197.0
102007.9203.81951.6192.6
112007.9192.31951.6196.5
122007.9196.91951.6196.4
132007.9198.51951.6195.6
142007.9203.21951.6194.1
152007.9193.91951.6192.6
162007.9199.31951.6193.2
172007.9208.71951.6194.2
182007.9213.71951.6194.6
192007.9212.61951.6197.1
202007.9206.31951.6193.9

I’d win four times, but I’d never have the ability to win a title like he had in Race 18. He’s usually All-State, but may cost his team a title through his effort in Race 7.

The simulations give the possibilities of those scenarios and all the various scoring scripts. A sixth girl that can pop off on any certain day, a reliable boy who always runs 17-flat, you name it. Hopefully, they better elucidate our contenders, qualifiers, and how these races play out over the weekend.

But always remember, races aren’t run on paper or on a computer. These projections are meant to better our sport, to give more attention where little is given. Although I take pride in their accuracy, this endeavor would be quite boring if it were always perfect. I look forward to these being proven wrong and I expect to hear about it as well.

SUMMER PREVIEW
MID-SEASON

GIRLS

Ranked Teams

#15 Concord
#17 Kalamazoo Hackett

Projected Individual Qualifier Cutoff

Probably gonna be around 16th place regardless if the 3rd team is White Pigeon or Centreville.

Projected PlaceTeamAvg. PlaceAvg. ScoreWin %Qualify %
1Kalamazoo Hackett1.5415295+
2Concord1.5424895+
3Centreville3.49156
4White Pigeon3.69444
5Battle Creek St. Philip5.5150
6Athens6.3159
7Three Oaks River Valley6.6161
8New Buffalo7.5174

Projected PlaceGradeNameTeamAvg. Place
19Haley StimerConcord1.4
211Presley AllenMendon2.2
39Gabriella SiemsKalamazoo Hackett3.6
410Cieara BarrettConcord4.1
510Emma RikerKalamazoo Hackett5.0
610Katelyn Van EsKalamazoo Hackett7.1
712Riley AdamsConcord9.5
812Emma GaylorHeritage Christian Academy10.8
910Ellie ReedCentreville10.9
1011Jamielynn DelaryeWhite Pigeon12.0
1112Gwen BulkoConcord12.6
1212Addie CurtisMarcellus13.4
1312Mimi HibbardBattle Creek St. Philip14.3
1411Abigail UlbrichKalamazoo Hackett15.2
159Harper BowmanNew Buffalo15.7
1612Chloe BadgerAthens17.4
1712Analiese MillerWhite Pigeon17.5
1812Emmy PritchardCentreville19.6
1912Alexae HallDecatur21.4
209Angel VeenKantTekonsha21.7
2111Rachel SchelstraeteWhite Pigeon22.8
229Ella HendrixsonThree Oaks River Valley23.0
2310Bethany CarpenterKalamazoo Hackett23.9
2412Frances MildenbergCentreville25.2
2511Hannah StimerConcord25.9
2610Rachel BylerWhite Pigeon26.2
279Helen DonnerThree Oaks River Valley26.4
2810Julianne MounceKalamazoo Hackett27.9
2910Kimberlynn LawsonCentreville28.9
3012Ellie MillerCentreville30.7

Any Intriguing Battles?

Concord vs. Kalamazoo Hackett for the girls win. Concord had the upper hand earlier in the year at Portage, buoyed by quick efforts from Stimer and Barrett. Hackett had more bodies toward the back of the pack. Two aspects to watch: what sort of gap is there in place between the Yellowjackets’ top-2 and Hackett’s top-2 and if depending on the former’s significance, can the Irish pull through late?

BOYS

Ranked Teams

#6 Three Oaks River Valley
#8 Kalamazoo Hackett
#26 Battle Creek St. Philip

Projected Individual Qualifier Cutoff

22nd Place. With two top-10 teams, this appears to be very top-heavy, with many spots up for grab later into the race.

Projected PlaceTeamAvg. PlaceAvg. ScoreWin %Qualify %
1Three Oaks River Valley1.3387295+
2Kalamazoo Hackett1.7422895+
3Battle Creek St. Philip3.088 95+
4White Pigeon4.5146  
5Concord4.7148  
6Centreville6.0171  
7Eau Claire7.3198  
8Heritage Christian Academy8.6217  
9Mendon8.8219  
10Athens9.3228  
11New Buffalo10.9262  

Projected PlaceGradeNameTeamAvg. Place
110Marek ButkiewiczKalamazoo Hackett1.4
210Landon RogersThree Oaks River Valley2.5
312Gavin SehyKalamazoo Hackett2.6
412Austin YorkThree Oaks River Valley4.8
512Luke SpragueBattle Creek St. Philip5.8
610Charlie GibsonThree Oaks River Valley6.2
710Sean SiemsKalamazoo Hackett6.3
810Jesse FielisWhite Pigeon7.9
911Ben IobeMendon9.7
1011Adam SlavensThree Oaks River Valley11.1
1111Ryan BlankenshipEau Claire11.3
1212Max ShugarsBattle Creek St. Philip11.7
1311Sean DriscollThree Oaks River Valley14.6
1412Nick DoerrKalamazoo Hackett14.8
1512Braiden BrooksThree Oaks River Valley16.2
1611Jerome BastianBattle Creek St. Philip17.0
1711Alex DumontKalamazoo Hackett17.8
189Kellen SiemsKalamazoo Hackett19.4
1910Ethan O’ConnorAthens20.4
2010David LaneWhite Pigeon22.2
2110Maddox HutchinsonConcord22.2
229Max BarronTekonsha23.5
2311Owen NofsBattle Creek St. Philip23.5
249Keaton SmithConcord24.9
2511Lleyton BaumanConcord27.2
2610Brendan SreCentreville27.7
2711Grant SchummThree Oaks River Valley28.0
289Elias BaldwinDecatur28.4
299Oliver MildenbergCentreville29.3
309Seth CrownHeritage Christian Academy30.7

Any Intriguing Battles?

As with many of these Southwest schools, we can look to Portage and try to glean something from the River Valley vs. Hackett matchup. There, the Mustang pack laid a giant impact, in particular Adam Slavens through Braiden Brooks, placing six RV boys before Hackett’s fourth. In a smaller meet such as this, that significance gets toned down, so if kids such as Sehy and Siems can sneak up a spot or two, Hackett’s winning odds become larger.

SUMMER PREVIEW
MID-SEASON

GIRLS

Ranked Teams

#10 Forest Hills Central

Projected Individual Qualifier Cutoff

A little light on the elite squads leaves many individuals in the top-15. Less depth in terms of spots, but a high possibility of more than 7 individual qualifiers.

Projected PlaceTeamAvg. PlaceAvg. ScoreWin %Qualify %
1Forest Hills Central1.05395+95+
2Portage Central2.512289
3Byron Center3.413470
4East Kentwood4.815219
5Grand Rapids Ottawa Hills5.5158
6Kalamazoo Central6.11649
7Caledonia6.11647
8Forest Hills Northern7.2174
9Battle Creek Lakeview9.1198
10Portage Northern9.5206
11Lowell11.1246
12Kalamazoo Loy Norrix12.3285
13Mattawan12.4290

Projected PlaceGradeNameTeamAvg. Place
112Selma AndersonGrand Rapids Ottawa Hills1.0
212Clara James-HeerForest Hills Central2.0
312Izzy FazioForest Hills Northern4.1
410Ava LawrenceEast Kentwood4.3
511Annie AlkemaKalamazoo Central5.0
611Anna SybengaForest Hills Central6.6
711Clare MathisonForest Hills Central8.9
812Alyssa DeFieldsCaledonia10.9
912Emilee RudlaffKalamazoo Central11.0
1012Peyton LudwigForest Hills Central11.6
1110Lilamae FrankBattle Creek Lakeview12.7
1211Sydney LawByron Center13.3
139Roxanne JorgensenPortage Northern14.4
1410Enna WainerGrand Rapids Ottawa Hills15.5
1510Rhea MouwPortage Central16.4
169Olivia StorteboomPortage Central17.1
1712Lexi HurstEast Kentwood21.0
1812Julia MoxeyEast Kentwood21.8
1911Daphne BallByron Center21.8
2010Olivia StacyPortage Northern22.6
2111Reese HansenGrand Rapids Ottawa Hills23.4
2212Alyssa HintonBattle Creek Lakeview24.6
2311Rachel GriceKalamazoo Central25.4
2411Ella HarlowPortage Northern26.7
2512MK ElliottPortage Central26.7
2610Lilah YoderForest Hills Central26.7
2711Claire O’BoyleLowell29.6
2811Sofia BogardKalamazoo Loy Norrix30.4
2912Addison BegemanPortage Central30.7
3011Mia StibitzForest Hills Central31.3

Any Intriguing Battles?

The many contenders for this third spot. Portage Central, slotted in second, may benefit from a home course advantage. But I wouldn’t be shocked with any order here. Byron Center is probably the favorite, a solid team all year that just recently won at Sturgis and placed 4th in the notoriously tough OK White. A darkhorse and wild card could be Kalamazoo Central, who at this past weekend’s SMAC Championship, sent three girls under 20:00.

BOYS

Ranked Teams

#6 Kalamazoo Central
#10 Forest Hills Central
#21 Portage Central
#23 East Kentwood

Projected Individual Qualifier Cutoff

Likely around 15th place even if the third team is Portage Central or East Kentwood. Tons of great individuals here that should push back those two top-10 teams.

Projected PlaceTeamAvg. PlaceAvg. ScoreWin %Qualify %
1Kalamazoo Central1.1619395+
2Forest Hills Central2.082795+
3Portage Central3.1106 83
4East Kentwood4.0121 16
5Byron Center5.1145  
6Caledonia6.5169  
7Battle Creek Lakeview6.5169  
8Kalamazoo Loy Norrix8.2203  
9Forest Hills Northern8.6212  
10Grand Rapids Ottawa Hills10.1248  
11Lowell11.0273  
12Portage Northern11.9295  
13Mattawan13.0327  

Projected PlaceGradeNameTeamAvg. Place
112Aiden MooreBattle Creek Lakeview1.2
212Jasper CaneKalamazoo Central2.1
312Liam WaltersGrand Rapids Ottawa Hills3.7
411Evan NickolesEast Kentwood5.7
59Samuel BakerKalamazoo Central8.4
612Logan BegemanPortage Central9.0
79Ben RomeroForest Hills Central10.0
811Jonah BillsBattle Creek Lakeview10.5
911Sawyer McCarthyForest Hills Central10.7
1011Isaac TanisEast Kentwood11.2
1111Mitchell JeruzalByron Center11.4
1210Logan WestgatePortage Central12.6
1310Dylan DuguayKalamazoo Loy Norrix15.6
1410Ty BillingsKalamazoo Central16.1
1510Jackson LamKalamazoo Loy Norrix16.7
1611Kort ThompsonCaledonia17.1
1711Joseph SpadaKalamazoo Central18.2
1812Parker LudwigForest Hills Central18.2
1912Levi GreenByron Center19.0
2010Andrew WrightKalamazoo Central20.3
2111Jacob SanfordForest Hills Central20.9
2212Will BanfieldForest Hills Central22.1
2311Spencer ParkerPortage Central23.2
2411Spencer PorterForest Hills Northern23.8
259Memphis ConnorByron Center25.7
2610Elijah ThompsonKalamazoo Central25.9
2712Hudson KempermanForest Hills Northern26.5
2810Eli VeltingCaledonia28.4
2912Mark MillardByron Center30.1
3012Reponse ShemaEast Kentwood31.0

Any Intriguing Battles?

A great aspect of athleticnet is being able to filter a meet’s results. For instance, three weeks ago on this very course, you can look at all the Region 3 teams from the Portage Invite. There, Portage Central had four boys sub-17, and when scored with only Region 3 teams, beat the Falcons by 14 points. But the Falcons just didn’t have a day. Portage is a fair course, ripe for PR’s when running in a massive, competitive field. And the Falcons didn’t obtain any from their varsity boys. Those PR’s came this past week at the OK Red Championship, where the Falcons placed 3rd and six boys nailed sub-17’s.

Uncategorized

2023 Regional Projections: Sharp Park Regional

Finally, the start of the season we’ve all been waiting for. Throw out all the fast times from September, but apply all the lessons learned through the summer and fall. Regional week is here and with it comes the many projections and previews I’ll write.

Just as last year and throughout the season, I’m projecting these using race simulations. Through a season’s worth of speed ratings, one can determine a runner’s average rating and the variability of those ratings. Both those factors are then weighed towards more recent meets, which are then simulated thousands of times using a Monte Carlo analysis (also described by TullyRunners here). Over those thousands of race simulations, one can determine a team’s average place and average score, a runner’s average place, odds on winning, and odds on qualifying.

These are useful in cross country scenarios, where you have consistent runners and those who are a bit more up and down. For example:

Tanner TimeTanner RatingTanner Avg.Tanner StDev.
15:30210  
15:45205  
16:00200  
16:15195  
16:301902007.91
MIXCSR TimeMIXCSR RatingMIXCSR Avg.MIXCSR StDev.
16:09197  
16:12196  
16:15195  
16:18194  
16:211931951.58

Jacob at his best might be faster than I in four of the five races during the season. I’d almost never be All-State in Division 1, but he might contend for a top-5 spot or place 60th.

If we did 20 simulations, this is how it might turn out:

RaceTanner Avg.Tanner StDevTanner RatingMIXCSR Avg.MIXCSR StDevMIXCSR Rating
12007.9202.11951.6195.6
22007.9196.21951.6194.1
32007.9190.01951.6199.2
42007.9193.41951.6192.5
52007.9206.81951.6195.7
62007.9201.81951.6196.1
72007.9171.61951.6194.9
82007.9189.21951.6195.9
92007.9205.51951.6197.0
102007.9203.81951.6192.6
112007.9192.31951.6196.5
122007.9196.91951.6196.4
132007.9198.51951.6195.6
142007.9203.21951.6194.1
152007.9193.91951.6192.6
162007.9199.31951.6193.2
172007.9208.71951.6194.2
182007.9213.71951.6194.6
192007.9212.61951.6197.1
202007.9206.31951.6193.9

I’d win four times, but I’d never have the ability to win a title like he had in Race 18. He’s usually All-State, but may cost his team a title through his effort in Race 7.

The simulations give the possibilities of those scenarios and all the various scoring scripts. A sixth girl that can pop off on any certain day, a reliable boy who always runs 17-flat, you name it. Hopefully, they better elucidate our contenders, qualifiers, and how these races play out over the weekend.

But always remember, races aren’t run on paper or on a computer. These projections are meant to better our sport, give more attention where little is given. Although I take pride in their accuracy, this endeavor would be quite boring if it were always perfect. I look forward to these being proven wrong and I expect to hear about it as well.

SUMMER PREVIEW
MID-SEASON

GIRLS

Ranked Teams

#4 Hillsdale Academy
#16 Pittsford

Projected Individual Qualifier Cutoff

20th Place

Projected PlaceTeamAvg. PlaceAvg. ScoreWin %Qualify %
1Hillsdale Academy1.03495+95+
2Pittsford2.05395+
3Addison3.07795+
4Adrian Lenawee Christian4.089
5Camden-Frontier5.0106

Projected PlaceGradeNameTeamAvg. Place
111Izzy BrooksAdrian Lenawee Christian1.0
212Brooke SmithPittsford2.1
311Ella WaltonHillsdale Academy4.3
410Ruth BrownleeHillsdale Academy4.8
511Ava MallarPittsford5.1
611Stephanie HernandezAddison6.7
711Riley McCumberPittsford6.9
811Caroline RobertsHillsdale Academy8.9
910Abby BrownleeHillsdale Academy9.2
1011Aubrey ApplemanBritton Deerfield10.8
1112Leah RorickMorenci11.3
129Allie MillerHillsdale Academy11.7
139Grace BrownleeHillsdale Academy12.0
149Audrey NehlsenHillsdale Academy13.3
1511Priya MericleEast Jackson14.4
1610Emersyn BachelderMorenci14.4
179Lillian JagielskiPittsford17.1
189Kendalyn PerryAddison18.8
1911Taylor LautermilchCamden-Frontier19.5
2010Grace RaymondPetersburg-Summerfield20.8
2110Ayla HopkinsCamden-Frontier21.8
229Gigi MastersAdrian Lenawee Christian23.7
2311Allison MorrisAddison24.7
2412Maggie FrostAddison25.2
2512Sayra HernandezAddison25.3
2612Kariana CarpenterJackson Preparatory25.8
2711Sophia FalaterReading25.8
2812Paige SantiReading27.5
2912Faith SecorPetersburg-Summerfield27.8
3011Averil MillerCamden-Frontier28.7

Any Intriguing Battles?

The top three teams seem set, but I might look to what Izzy Brooks can throw down or how Hillsdale Academy’s pack appears. The Colts have seven solid girls that could play a role next week. Izzy had a nice rebound from the Lenawee County race, winning the Class D meet at Shepherd in 19:16. With its gradual downhills, Jackson can run fast. If she goes for it, I wouldn’t be shocked to see another low-19 (or faster) performance.

BOYS

Ranked Teams

Boys

#1 Hillsdale Academy
#16 East Jackson
#25 Adrian Lenawee Christian

Projected Individual Qualifier Cutoff

20th Place

Projected PlaceTeamAvg. PlaceAvg. ScoreWin %Qualify %
1Hillsdale Academy1.02795+95+
2East Jackson2.178 95+
3Adrian Lenawee Christian3.394 74
4Morenci4.0100 25
5Jackson Preparatory4.7108  
6Britton Deerfield6.4173  
7Reading6.6177  
8Vandercook Lake8.0204  
9Addison9.0229  

Projected PlaceGradeNameTeamAvg. Place
112Thomas HolmHillsdale Academy1.0
212Michael AllenEast Jackson2.4
310Grayson RorickHillsdale Academy2.7
411Reece PooleHillsdale Academy4.4
512Javin MericleEast Jackson4.6
611Joel LangeAdrian Lenawee Christian6.9
712Nathan DanielsAdrian Lenawee Christian8.4
810Henry LindleyHillsdale Academy9.1
912William KennedyEast Jackson9.9
109Landon WilkinsMorenci11.2
1111Beau ShafferMorenci11.3
129Ryan MillerHillsdale Academy11.4
1310James RaheHillsdale Academy11.7
1412Karol SchlueterHillsdale Academy13.7
1511Zachary MartinezMorenci14.9
1611Jameson WatsonBritton Deerfield16.3
1712Noah BlondkeJackson Preparatory17.3
1812Nathan BlondkeJackson Preparatory18.5
1911Diego BoColeJackson Preparatory20.4
2012Kutter VanakenReading20.7
2110Dallas SwaenepoelVandercook Lake21.1
2211Kaleb RichardsonAdrian Lenawee Christian23.2
2310Pierson CousinoAdrian Lenawee Christian23.7
2410Corey DubnickiJackson Preparatory25.4
259Noah LucasAddison26.0
2611Ryan GoodBritton Deerfield28.1
2710Brayden WrightReading30.5
2811Logan MishawJackson Preparatory30.7
2912Colton RaffensbergerEast Jackson30.9
3012Randy ReddickEast Jackson31.7

Any Intriguing Battles?

These last few weeks, we’ve got a few examples of the impending Adrian Lenawee Christian vs. Morenci matchup on the boys side. Lenawee Christian took the first two battles at the TCC Final and the Lenawee County Championship, while Morenci came through up at Class D this past weekend. Beau Schaffer easily had his best effort of the year, coming in before any ALC athlete. Could that be enough to lead the Bulldogs into the 3rd spot?

SUMMER PREVIEW
MID-SEASON

GIRLS

Ranked Teams

#1 Jackson Lumen Christi
#13 Hanover-Horton
#23 Onsted

Projected Individual Qualifier Cutoff

20th Place

Projected PlaceTeamAvg. PlaceAvg. ScoreWin %Qualify %
1Jackson Lumen Christi1.02895+95+
2Hanover-Horton2.07095+
3Onsted3.09995+
4Hudson4.4142
5Quincy4.7145
6Bronson6.3172
7Napoleon6.6175
8Jonesville8.3214
9Hillsdale9.2232
10Homer9.5238
11Sand Creek11.2277
12Michigan Center11.8293

Projected PlaceGradeNameTeamAvg. Place
112Madison OsterbergJackson Lumen Christi1.1
211Emmry RossOnsted1.9
39Samantha SchroederJackson Lumen Christi3.1
412Olivia PerrineHanover-Horton4.8
510Macy FazekasJackson Lumen Christi5.8
610Ashlynn HarrisBronson7.1
712Sophia ReynoldsHanover-Horton7.7
811Chloe StalhoodHillsdale8.4
911Layla LopezJackson Lumen Christi8.8
1011Ava HathawayBronson9.0
1112Sydney FazekasJackson Lumen Christi9.7
1211Thia TelloJackson Lumen Christi12.2
139Kendyl MusielewiezQuincy13.1
1412Julianna Debozy-CrawfordHanover-Horton15.5
1511Jayla BrightHudson16.6
169Brynlee SwihartHanover-Horton17.0
1710Brookelyn ParkerQuincy17.4
1811Allie EnglandOnsted17.6
1910Raegan BrosamerOnsted17.9
2011Karly PageJonesville19.7
2110Annabelle CzeiszpergerHudson22.9
2212Sadie MillerQuincy23.5
2310Sophie PatrickHomer24.3
2411Lauren McLainNapoleon24.7
2512Lily MasonHanover-Horton25.6
2611Mia SanchezJackson Lumen Christi26.6
2710Makenzy LindemannNapoleon27.5
2812Madelyn NormanNapoleon28.7
299Izabel RaglowOnsted28.8
3011Pierce PibblesHudson31.3

Any Intriguing Battles?

Not especially, as the top three girls teams appear to be heavy favorites to make it out. This region benefitted from the loss of Leslie, a school in the vicinity of Jackson that moved to Region 26. This opened the door for teams such as Onsted and Hanover-Horton to have a greater chance at qualifying.

BOYS

Ranked Teams

#4 Hanover-Horton
#8 Jonesville
#9 Jackson Lumen Christi

Projected Individual Qualifier Cutoff

18th Place

Projected PlaceTeamAvg. PlaceAvg. ScoreWin %Qualify %
1Hanover-Horton1.1539395+
2Jonesville2.471795+
3Jackson Lumen Christi2.573 95+
4Hillsdale4.2152  
5Brooklyn Columbia Central5.9177  
6Hudson6.0178  
7Onsted7.8196  
8Adrian Madison7.9197  
9Bronson8.1199  
10Homer9.5214  
11Napoleon11.2239  
12Sand Creek11.4240  
13Michigan Center13.0349  
14Quincy14.0405  

Projected PlaceGradeNameTeamAvg. Place
111Isaiah DinvernoJackson Lumen Christi1.1
211Mitchell HiattOnsted2.1
311Landen BoulisHanover-Horton4.3
412Evan ShepherdHanover-Horton4.6
512Gavin VanKampenJonesville5.2
612Nolan GrantHillsdale6.1
712Gannon ShoreJackson Lumen Christi6.9
89Caleb BlondeJonesville7.3
912Alex CzeiszpergerHudson9.3
1010Zach HassenzahlHanover-Horton11.4
1110John EdlerHomer11.4
1210Gibson ShoreJackson Lumen Christi14.0
1310Nicholas FowlerJonesville14.7
1412Owen BrownHanover-Horton14.8
159Logan YoungmanHillsdale15.4
1612Kyler PequetNapoleon16.3
179Cooper FlickHanover-Horton18.3
1811Jack GortonBrooklyn Columbia Central19.9
1910Trenton FetterAdrian Madison19.9
2011Isaac St. JohnHudson20.5
2112David FowlerJonesville21.9
229Avery MorrowJackson Lumen Christi22.0
239Silas DanielsSand Creek24.9
249Collin FucileJonesville25.2
2510Paul McClureAdrian Madison25.9
2610Wyatt VowellBrooklyn Columbia Central26.7
2711James BayesOnsted27.0
28Rocky BoltonJackson Lumen Christi29.4
2912Caleb DickinsonHomer30.3
3011Owen LambarthBrooklyn Columbia Central30.8

Any Intriguing Battles?

Another thing to add to the list of Michigan XC Maxims (St. Louis comes through at the end of the year, watch out for Pinckney at Portage, always believe in Sal’s Magic) is to always count on Hanover-Horton. Ranked outside the top-10 to begin the year, the Comets have been a steady presence in the upper echelon of the D3 rankings.But beware, Jonesville is living up to those rankings, winning the Cascades Conference thanks to a huge performance from David Fowler. Lingering a bit behind the two were the Lumen Christi boys, but I always feel like the LC teams live on the Sharp Park course.