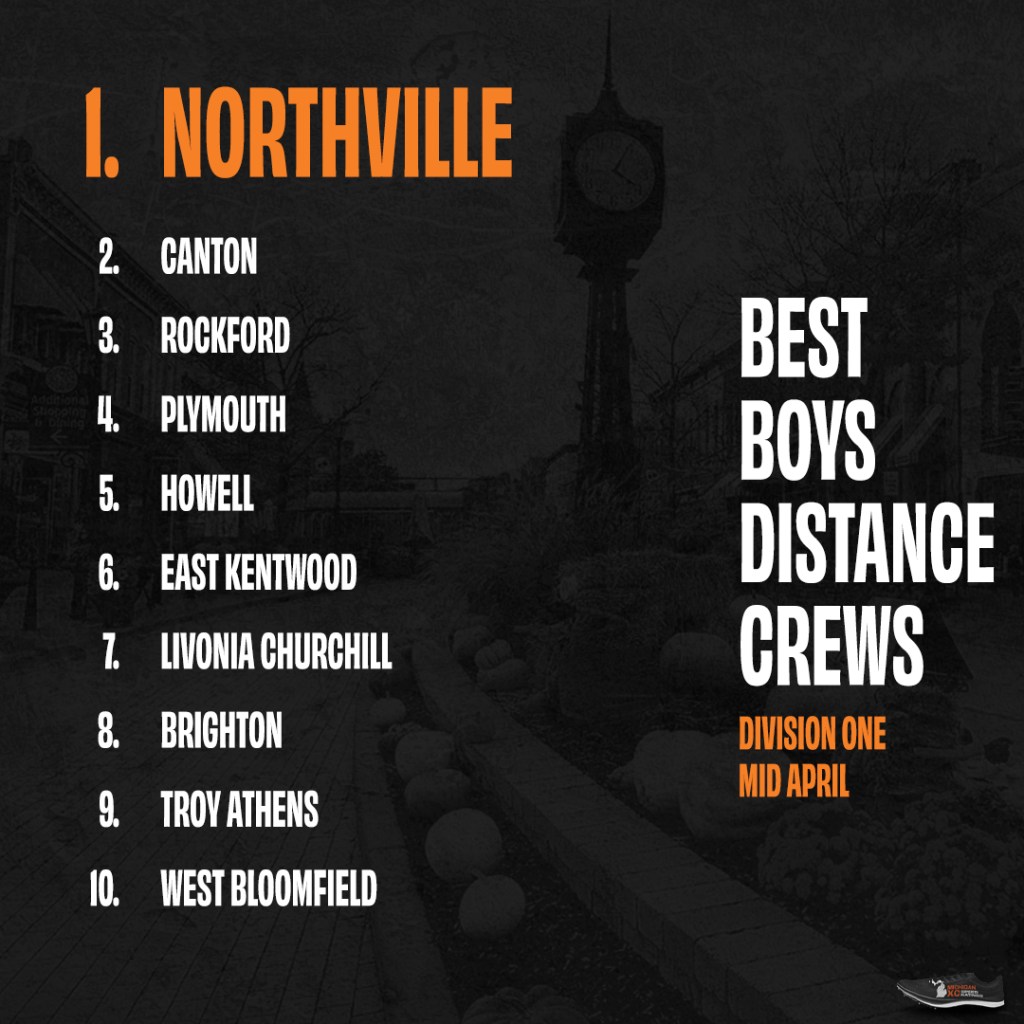
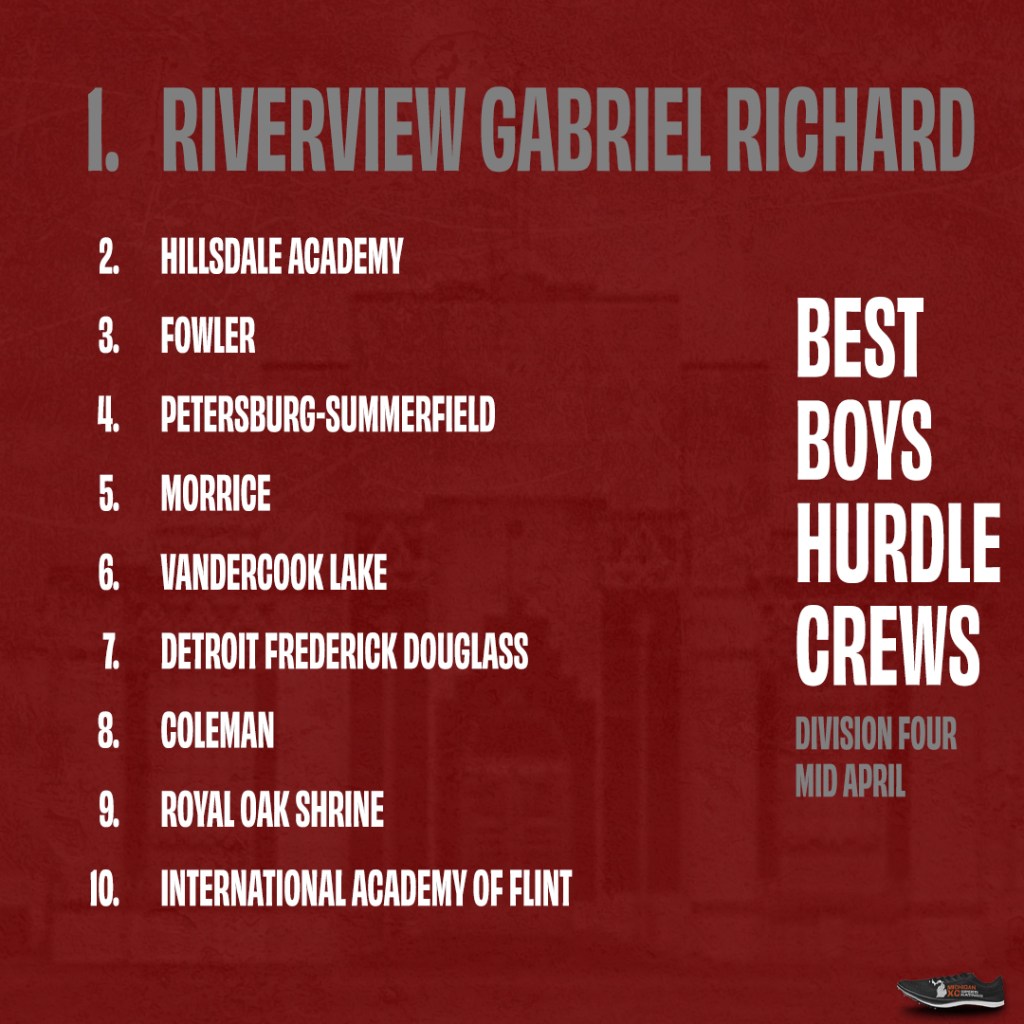
The Best Crews have been a thing around here for the past few years. They take their cues from USTFCCCA’s event squads and the World Athletics scoring system, combining the two ideas in order to compare Michigan’s teams against events in their common areas.
The goal of this is to help recognize the athletes and coaches that create cultures, history, and traditions in their respective event areas. Think about it like this: Minnesota always has great hockey, basketball hoops are nailed to Indiana barns, Texas churns out football talent, every Iowa boy has cauliflower ear. Where in Michigan does hurdling reign supreme? Is there a town where kids learn to shot put before they can tie their shoes?
2023’s explanation goes through much of it, but two things have changed for this year.
the Boys 200m points have been re-mathed and edited, as previous versions sold short athletes such as Jeremy Dixon and Jake Machiniak when it came to season end rankings.
instead of using a team’s top-four athletes to generate their total for an event, I’m using their top-three. Belleville’s hurdlers are the main reason for this, there’s no way they shouldn’t have been the top D1 squad last year. I feel this will better portray a team’s top athletes.
Here are the figures that show the points for each mark:
To acquire points for your team, an athlete has to hit a regional qualifier in their event. As there are no regional qualifiers for relays (every team gets an entry), I had to make an estimation of what a regional qualifying mark might be. These are done on a ratio of the SQ/EQ marks for each individual and relay of that distance. On average, the relay qualifying time is around 4.1x the individual qualifying time (for example, the girls D1 200m EQ is 25.4, the 4×2 is 1:44.5). Anyhow, this is what I came up with for the relay times needed to obtain points here:
Estimated RQ
D1 Girls
D2 Girls
D3 Girls
D4 Girls
4x100m
52.25
54.05
55.25
56.75
4x200m
1:52.0
1:54.1
1:58.0
2:00.7
4x400m
4:21.3
4:32.1
4:42.3
4:50.7
4x800m
10:14.7
10:50.5
11:25.0
11:44.0
Estimated RQ
D1 Boys
D2 Boys
D3 Boys
D4 Boys
4x100m
44.75
45.8
46.9
48.25
4x200m
1:34.0
1:36.0
1:37.3
1:40.9
4x400m
3:35.4
3:41.8
3:43.9
3:55.0
4x800m
8:28.0
8:38.0
9:01.1
9:26.3
These contain results uploaded to athletic.net by Monday (4/14) evening. To keep things consistent, all times listed are FAT. Hand timing really shouldn’t be a thing in 2025, anyway.
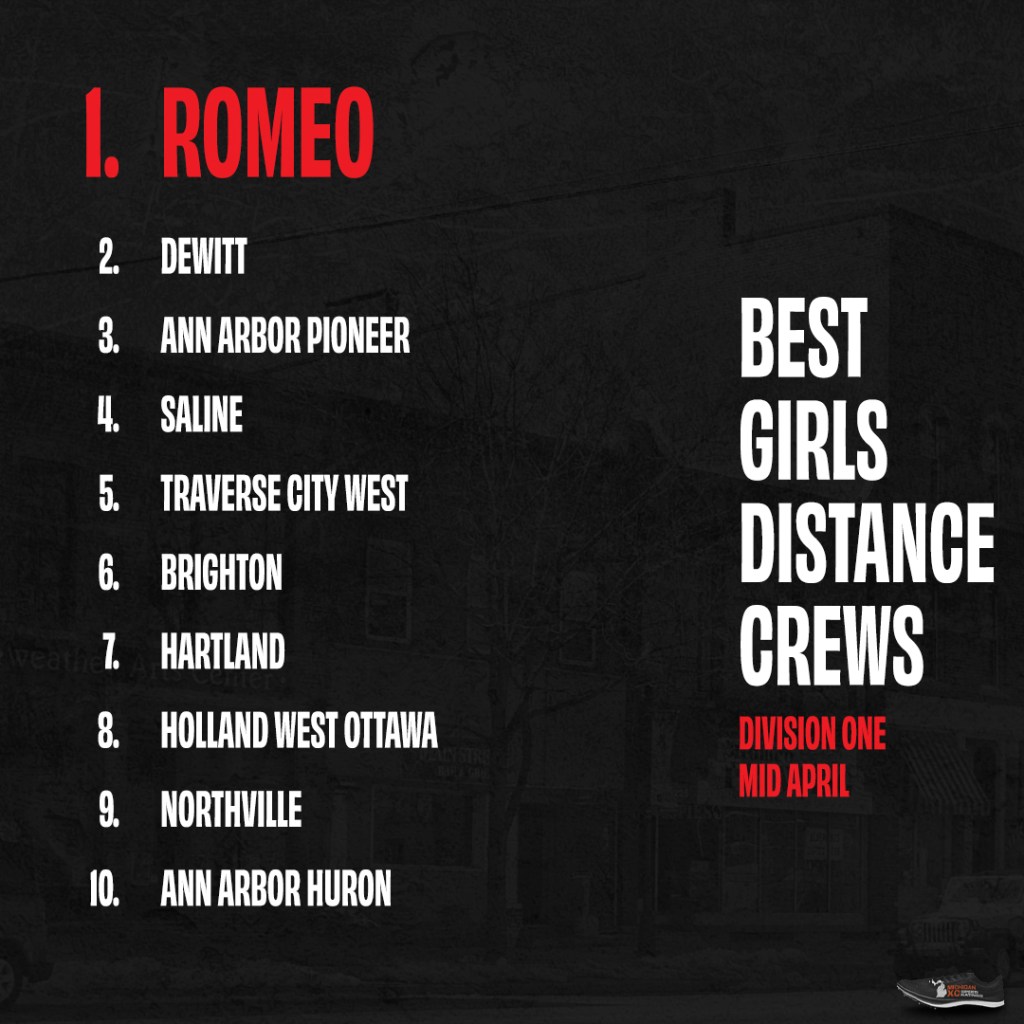
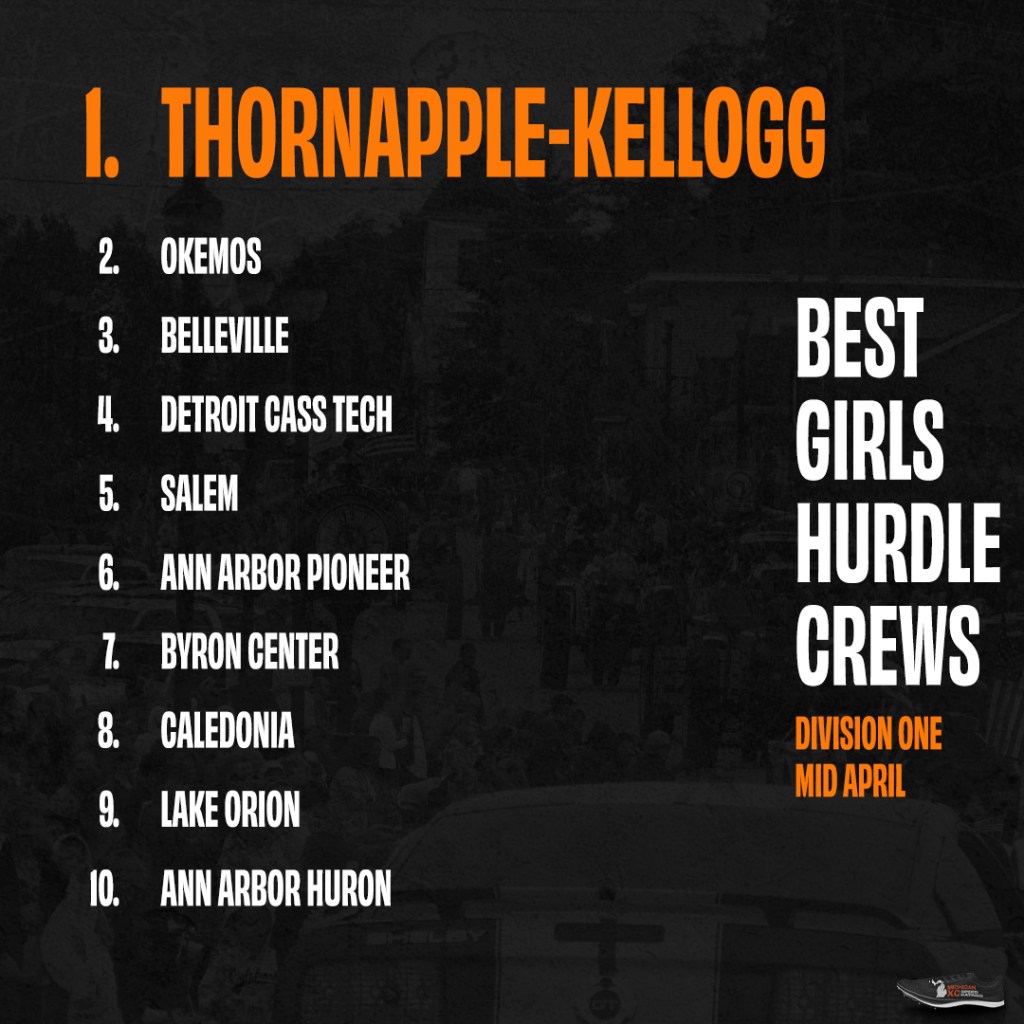
The Best Crews have been a thing around here for the past few years. They take their cues from USTFCCCA’s event squads and the World Athletics scoring system, combining the two ideas in order to compare Michigan’s teams against events in their common areas.
The goal of this is to help recognize the athletes and coaches that create cultures, history, and traditions in their respective event areas. Think about it like this: Minnesota always has great hockey, basketball hoops are nailed to Indiana barns, Texas churns out football talent, every Iowa boy has cauliflower ear. Where in Michigan does hurdling reign supreme? Is there a town where kids learn to shot put before they can tie their shoes?
2023’s explanation goes through much of it, but two things have changed for this year.
the Boys 200m points have been re-mathed and edited, as previous versions sold short athletes such as Jeremy Dixon and Jake Machiniak when it came to season end rankings.
instead of using a team’s top-four athletes to generate their total for an event, I’m using their top-three. Belleville’s hurdlers are the main reason for this, there’s no way they shouldn’t have been the top D1 squad last year. I feel this will better portray a team’s top athletes.
Here are the figures that show the points for each mark (well, except for the relays, I have to re-work the points chart to account for using 3 runners instead of 4)
These contain results uploaded to athletic.net by Sunday (4/13) evening. To keep things consistent, all times listed are FAT. Hand timing really shouldn’t be a thing in 2025, anyway.
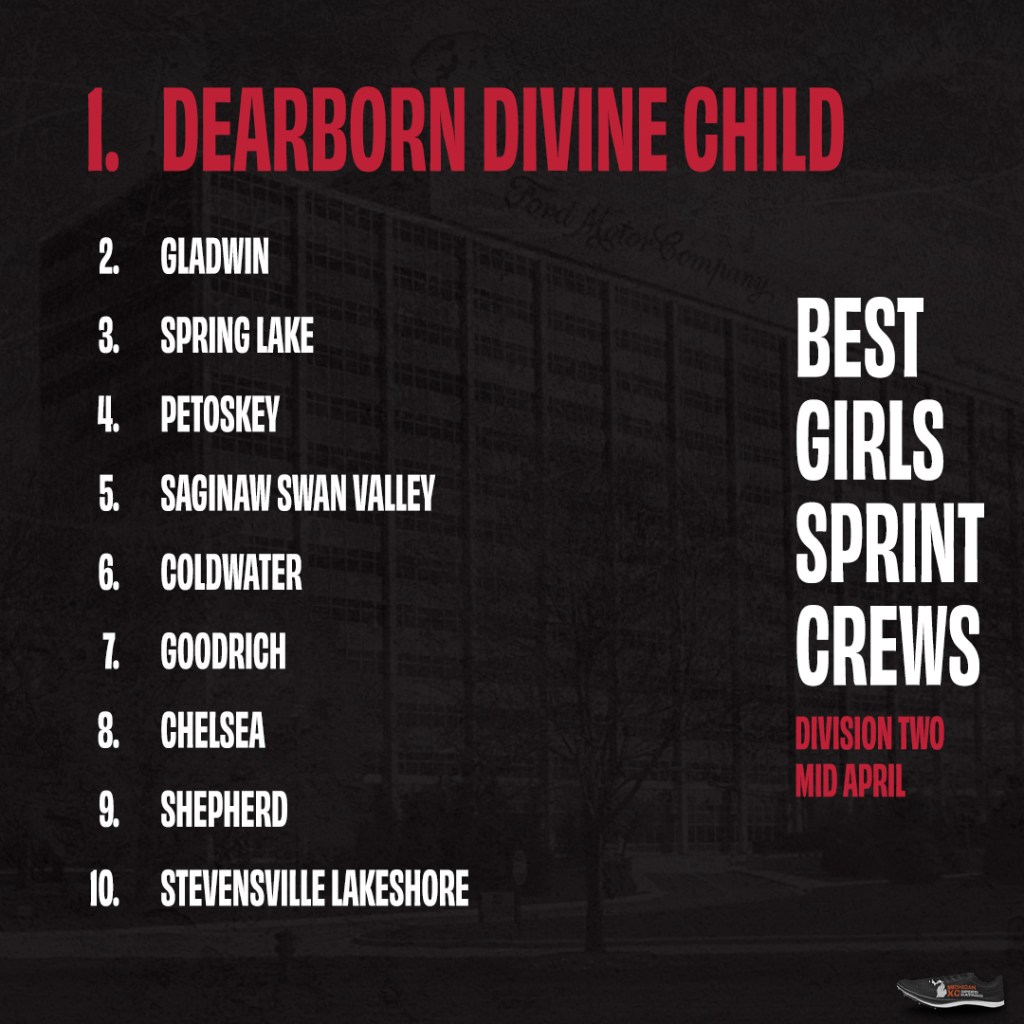
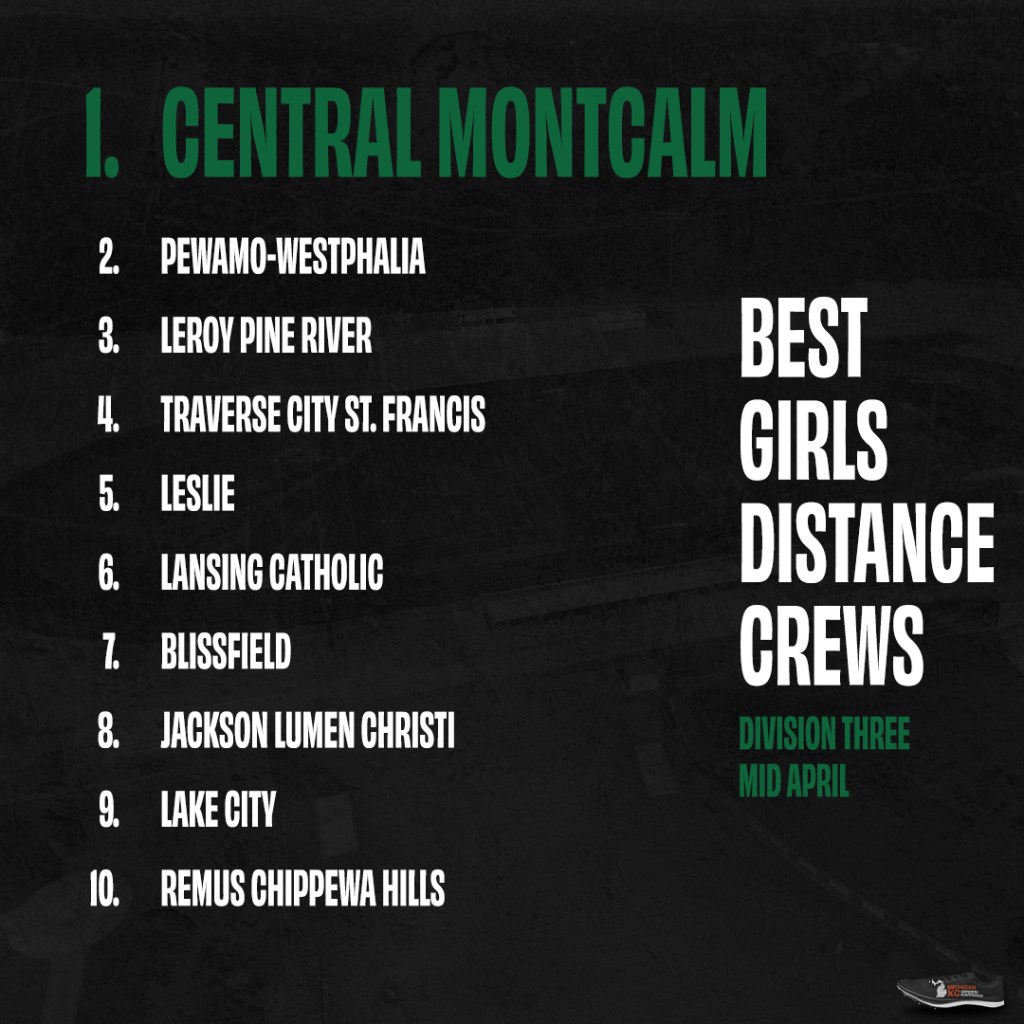
The Best Crews have been a thing around here for the past few years. They take their cues from USTFCCCA’s event squads and the World Athletics scoring system, combining the two ideas in order to compare Michigan’s teams against events in their common areas.
The goal of this is to help recognize the athletes and coaches that create cultures, history, and traditions in their respective event areas. Think about it like this: Minnesota always has great hockey, basketball hoops are nailed to Indiana barns, Texas churns out football talent, every Iowa boy has cauliflower ear. Where in Michigan does hurdling reign supreme? Is there a town where kids learn to shot put before they can tie their shoes?
2023’s explanation goes through much of it, but two things have changed for this year.
the Boys 200m points have been re-mathed and edited, as previous versions sold short athletes such as Jeremy Dixon and Jake Machiniak when it came to season end rankings.
instead of using a team’s top-four athletes to generate their total for an event, I’m using their top-three. Belleville’s hurdlers are the main reason for this, there’s no way they shouldn’t have been the top D1 squad last year. I feel this will better portray a team’s top athletes.
Here are the figures that show the points for each mark:
In the past, I’ve struggled grasping exactly what I want to write about for each event or division. Thankfully, these early qualifiers make it easy! If you’ve qualified in the timeframe before your event area has been posted or in between those posts, you’ll get a little sentence or three.
These contain results uploaded to athletic.net by Thursday (4/10) at 10pm.
Early Qualifiers
Laila Hawkins, Detroit Cass Tech
14.74 – 100 Hurdles – DDC Early Season All-Comers
One race in and she’s already 0.2 seconds faster than last year, a season that resulted in a 6th place D1 finish.
Grade
Name
Time
Team
Points
Event
12
Brooklyn Harmon
15.06
Middleville Thornapple-Kellogg
446
100h
11
Mia Hilton
46.91
Middleville Thornapple-Kellogg
418
300h
9
Amya Gater
16.72
Middleville Thornapple-Kellogg
346
100h
11
Mia Hilton
16.86
Middleville Thornapple-Kellogg
337
100h
Rank
Team
100h
300h
Total
1
Middleville Thornapple-Kellogg
1129
418
1548
2
Okemos
679
745
1424
3
Belleville
807
479
1286
4
Detroit Cass Tech
804
376
1181
5
Salem
736
359
1095
6
Ann Arbor Pioneer
667
366
1032
7
Byron Center
422
378
800
8
Caledonia
397
368
766
9
Lake Orion
381
375
756
10
Ann Arbor Huron
370
377
747
11
Clarkston
365
361
726
12
Rockford
352
346
698
13
Rochester Adams
677
–
677
14
Taylor
454
–
454
15
Utica Ford
382
–
382
16
Holland West Ottawa
–
372
372
17
Grand Ledge
371
–
371
18
Romeo
–
369
369
19
Oxford
–
360
360
20
Woodhaven Brownstown
–
348
348
21
Ann Arbor Skyline
335
–
335
22
Mount Pleasant
330
–
330
23
Troy
326
–
326
24
Holt
324
–
324
Grade
Name
Time
Team
Points
Event
12
Michael Wilkerson
14.80
Rochester Adams
448
110h
12
Lachlan Tillotson
15.05
Rochester Adams
429
110h
12
Michael Wilkerson
41.00
Rochester Adams
404
300h
12
Lachlan Tillotson
41.18
Rochester Adams
398
300h
12
Steven Wilkerson
15.60
Rochester Adams
387
110h
12
Steven Wilkerson
42.45
Rochester Adams
358
300h
Rank
Team
110h
300h
Total
1
Rochester Adams
1265
1161
2426
2
Belleville
1345
382
1728
3
Greenville
811
808
1619
4
Temperance Bedford
1214
360
1574
5
Holland West Ottawa
756
375
1131
6
Walled Lake Western
427
425
851
7
West Bloomfield
344
405
749
8
Detroit Cass Tech
368
378
745
9
Grosse Pointe South
365
376
740
10
Lowell
352
381
732
11
Ann Arbor Huron
–
442
442
12
Saline
–
422
422
13
Rockford
–
381
381
14
Caledonia
–
377
377
15
Byron Center
–
370
370
16
Rochester Hills Stoney Creek
–
368
368
17
Howell
366
–
366
18
Southgate Anderson
–
358
358
19
Farmington
355
–
355
20
Livonia Churchill
346
–
346
21
Grand Ledge
343
–
343
22
Portage Central
342
–
342
23
Grandville
342
–
342
24
Beverly Hills Groves
341
–
341
Grade
Name
Time
Team
Points
Event
12
Sydney Kuhn
44.76
Saginaw Swan Valley
469
300h
10
Aubrey Hare
49.27
Saginaw Swan Valley
363
300h
10
Aubrey Hare
17.54
Saginaw Swan Valley
296
100h
Rank
Team
100h
300h
Total
1
Saginaw Swan Valley
296
832
1128
2
Owosso
650
392
1043
3
Sturgis
589
315
903
4
Allegan
416
423
839
5
Hudsonville Unity Christian
364
349
712
6
Gladwin
357
324
682
7
Trenton
343
325
669
8
Plainwell
288
351
638
9
Portland
278
354
633
10
Shepherd
306
320
627
11
Spring Lake
317
300
617
12
Dearborn Divine Child
289
318
607
13
Parma Western
307
297
604
14
Forest Hills Eastern
289
312
602
15
Holland Christian
277
298
575
16
Chelsea
569
–
569
17
Monroe Jefferson
562
–
562
18
Cranbrook Kingswood
409
–
409
19
Fruitport
334
–
334
20
Freeland
–
316
316
21
Hopkins
–
297
297
22
Ann Arbor Gabriel Richard
277
–
277
23
Bay City John Glenn
272
–
272
23
Eaton Rapids
272
–
272
25
Otsego
269
–
269
Grade
Name
Time
Team
Points
Event
11
Conan Weeks
16.00
Clare
356
110h
12
Logan Carstensen
42.72
Clare
350
300h
11
Conan Weeks
42.78
Clare
348
300h
12
Logan Carstensen
16.79
Clare
295
110h
12
Ty Allbee
16.83
Clare
292
110h
Rank
Team
110h
300h
Total
1
Clare
944
698
1642
2
Parma Western
705
720
1425
3
Battle Creek Harper Creek
1056
–
1056
4
Shepherd
–
747
747
5
Freeland
377
342
719
6
Coldwater
709
–
709
7
Alma
677
–
677
8
Three Rivers
331
336
667
9
Trenton
280
333
613
10
Orchard Lake St. Mary’s
388
–
388
11
Corunna
363
–
363
12
Saginaw Swan Valley
–
357
357
13
Jackson Northwest
352
–
352
14
Grand Rapids South Christian
–
348
348
15
Grand Rapids Christian
–
336
336
16
Gladwin
335
–
335
17
Marshall
332
–
332
18
Hazel Park
308
–
308
Early Qualifiers
Julia Hughes, Ida
15.66 – 100 Hurdles – Hillsdale Jack Beilfuss Invitational
An off-season dedication to strength and power led to the ability to consistently three step. Which then brought about her first sub-16 ever.
Grade
Name
Time
Team
Points
Event
11
Julia Hughes
15.66
Ida
410
100h
11
Julia Hughes
48.34
Ida
385
300h
12
Mackenzie Dollison
52.41
Ida
289
300h
12
Mackenzie Dollison
17.89
Ida
275
100h
11
Grace May
17.97
Ida
270
100h
Rank
Team
100h
300h
Total
1
Ida
955
674
1629
2
Pewamo-Westphalia
277
616
893
3
Standish Sterling
570
271
841
4
Quincy
362
332
693
5
Bath
414
267
681
6
Kent City
277
295
571
7
Union City
257
271
528
8
Chesaning
–
523
523
9
Napoleon
285
–
285
10
The Potter’s House
–
281
281
11
Ovid-Elsie
275
–
275
12
Ravenna
262
–
262
13
Muskegon Western Mich. Christian
–
249
249
14
Stanton Central Montcalm
246
–
246
Early Qualifiers
Caleb Walker, Chesaning
14.72 – 110 Hurdles – Fowlerville Early Season Open
Twice All-State in the high hurdles, this is Caleb’s second foray into the 14’s – and the earliest in the season that he’s reached that mark.
2024’s 2x All-Stater can cruise into the State Finals knowing that he’s got a chance to repeat that same feat – or attain higher goals. Considering he opened last year with 16/42+ efforts, he’s in a good spot to be in contention come late May.
Logan Smith, Morrice
41.90 – 300 Hurdles – Fowlerville Early Season Open
Smith joined Scharer as a duplicate All-Stater. Like Dawson, Logan is far ahead of 2024’s pace. Having opened last season over 44, he’s already 3 sec. ahead of pace.