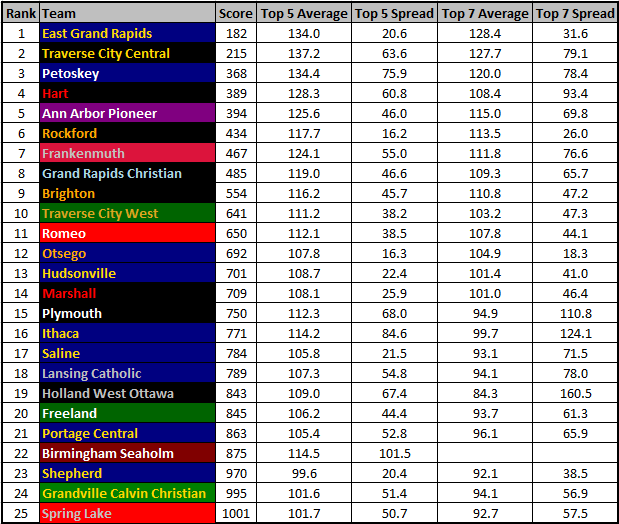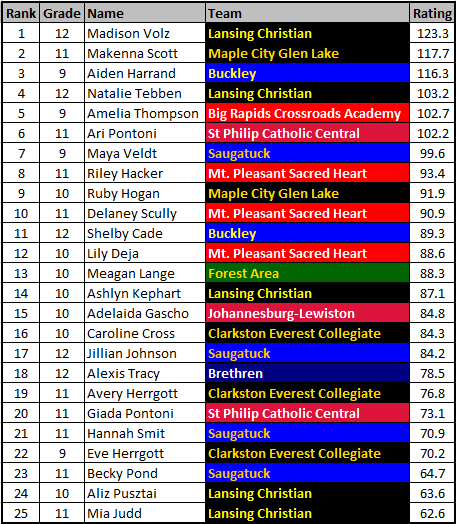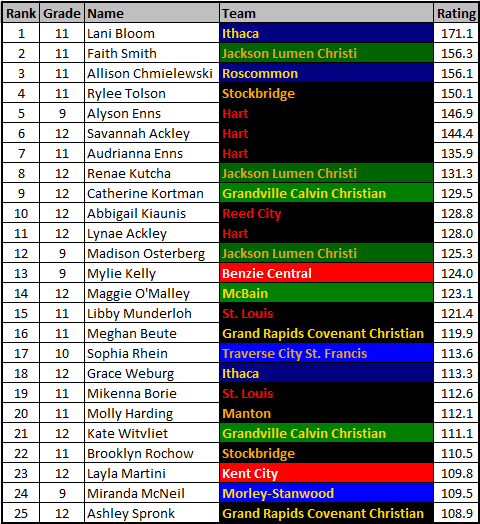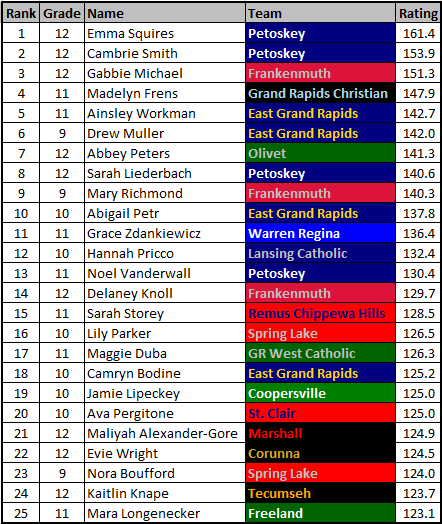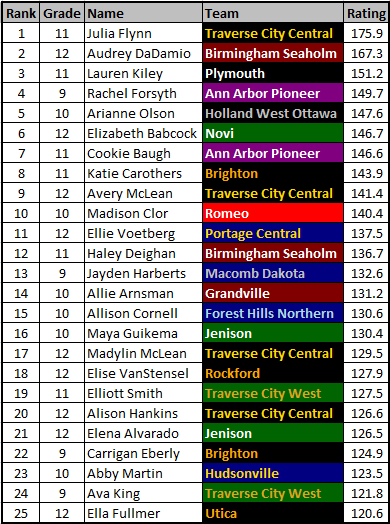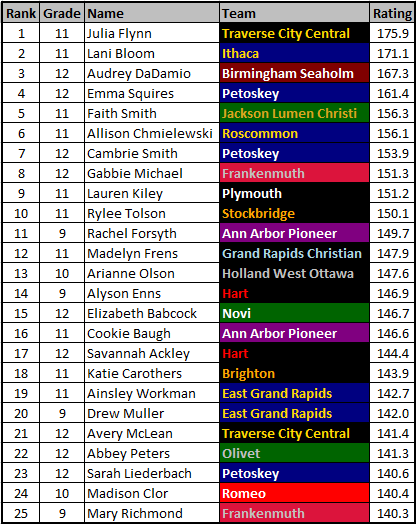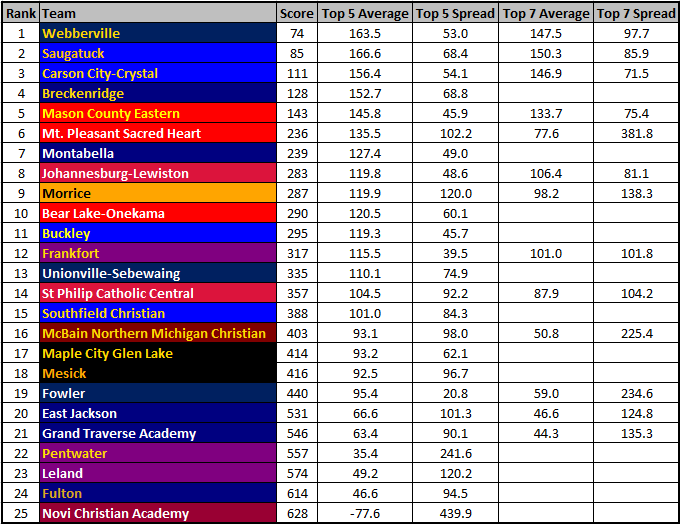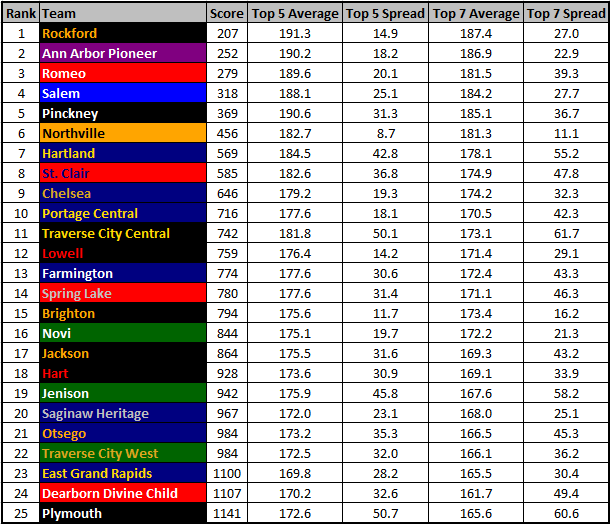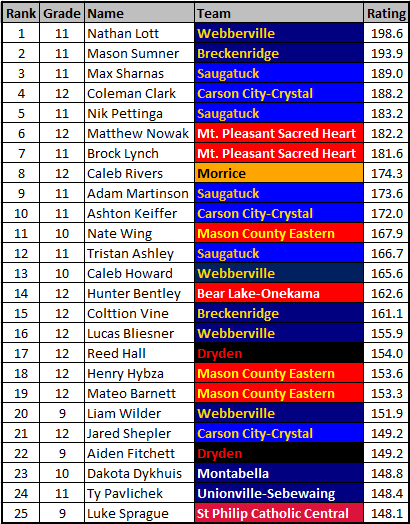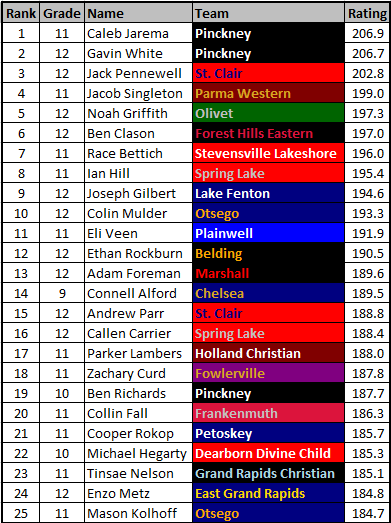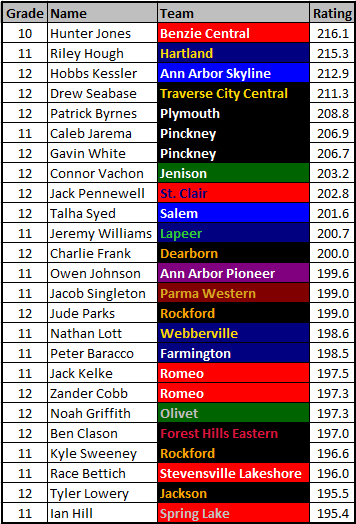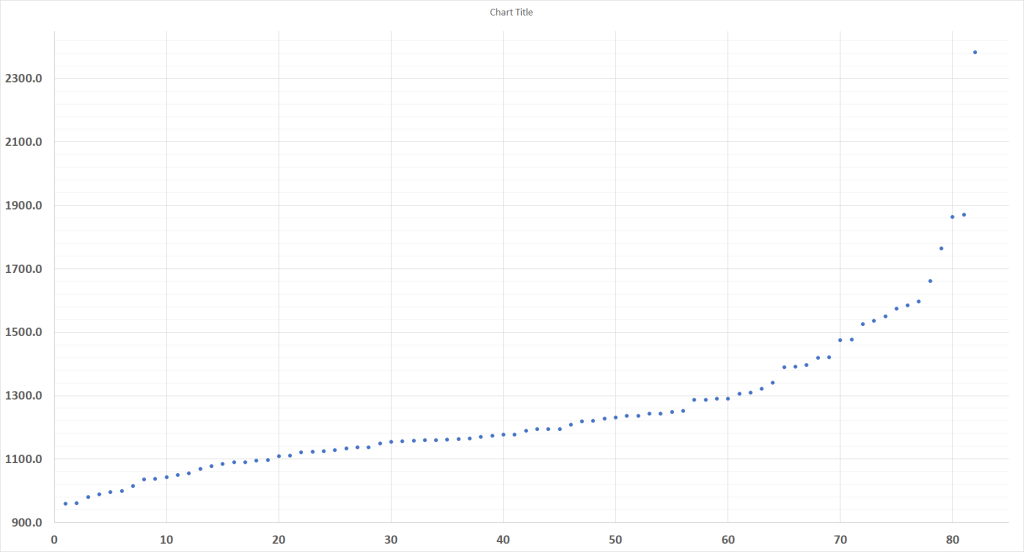

Last November, I detailed the two rating methods, both the graphing method and reference runner. The above graphs are from the Wednesday Boy’s races at Shepherd’s John Bruder Classic. The first picture represents time on the Y-axis and the number of runners on the X-axis. And what results is a typical graph found from races of larger fields. On the bottom left, you have the faster runners, the middle is the pack, and the top right are those who are taking a little more time to complete the course.
For the John Bruder Classic, I used the traditional graphing method. In a non-covid year, this is the more common strategy. There are larger fields at invitationals and more of those invitationals are occurring. 2020 has brought on more of the reference runner, but let’s refresh with the graph. The goal with the graph is to find the section of runners that appears closest to a straight line. To my (eye surgery at 16 months and definitely not 20/20) eyes, that looks to be the section between the 10th and 60th place runners. From that set, I draw a line that hits the closest amount of points and find where that line crosses the Y-axis. That crossing is at 1003 seconds.
To get to the adjustment, I compare the graph from this race to the Y-axis crossing of the 2018 Allendale Falcon race. That race has been the baseline for the past two seasons. The crossing in that race was at 1000 seconds. 1003-1000 is a 3 second adjustment.
The formula to get the ratings is (1560-(time-adjustment))/3. So for Braxton Lamey’s 15:59.5:
(1560 – (959.5 – 3))/3 = 201.2
We’ve pivoted towards a more one on one, small meet centric season. For runners, coaches, timers, anyone, this has been a major adjustment. On my side of things, this has been the case as well. A positive aspect of the graphing method is that given a quality, decent-sized field, it’s fairly straightforward. But we haven’t had much of those. We’ve already had many interesting dual meets that you’d never normally see. It’s funny, the SEC in football never goes out and plays anyone. But in Michigan’s SEC, Saline went out to run at Cass Benton and Skyline took on an upcoming power in Hartland.
Aside from these larger D1 schools going head to head, dual meets lack the two attributes that make the graphing method possible: field size and field quality. The graphing method relies on finding a field that would be comparable to that 2018 Allendale Falcon race, teams that will make noise at the state level. A large field emits a less volatile line. Onto the reference runner:
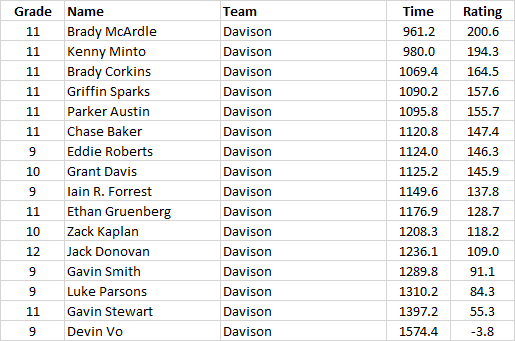
Here is a list of the Davison boys that ran at John Bruder, their times and their ratings. A week ago, Davison and Caro matched up in a dual meet. That dual had representation from two teams that will be players at the state level, but only 27 boys ran altogether. To calculate ratings for that dual meet, I used the reference runner method.
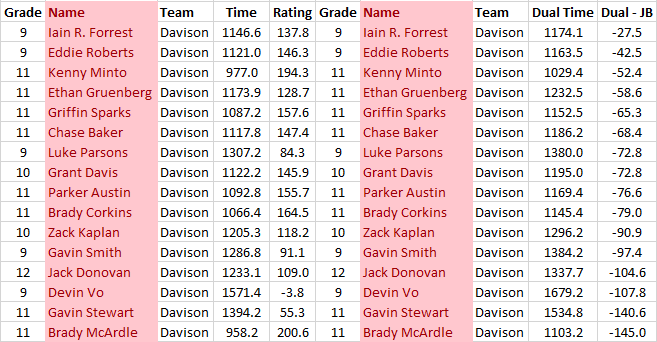
On the left you have Davison’s ratings from John Bruder and then adjusted time from that rating (actual time minus 3 seconds). On the right, you have their times from the dual meet with Caro, along with the difference between the two. If you graph out the difference, you come out with this:

A graph, of course. Again, we’re trying to find the largest section of the graph that forms a straight line, or eliminate as many anomalies as possible. In my estimation, the best area would be the points that are circled. The average of those points was -62, so the adjustment becomes -62. Now we can apply that adjustment to Caro, a team that had only run quads to that point:

An issue that still remains is the sample. The hope is that if I can perform these ratings for as many meets as possible, I’ll land on figures that will be reliable when referencing runners. I’m still trying to be judicious on this, any race with under 25 runners isn’t being rated. Which is why I haven’t posted anything for the girls side of this meet.
This has been quite an interesting puzzle to fill in. From the Davison/Caro dual meet, I was then able to rate Caro’s previous quad meets, and then take those and rate the USA and Mayville quads. As more invitationals occur, more pieces will get filled in. I hope you’ll bear with me as I navigate through all these meets.