
Finally, the start of the season we’ve all been waiting for. Throw out all the fast times from September, but apply all the lessons learned through the summer and fall. Regional week is here and with it comes the many projections and previews I’ll write.
Just as last year and throughout the season, I’m projecting these using race simulations. Through a season’s worth of speed ratings, one can determine a runner’s average rating and the variability of those ratings. Both those factors are then weighed towards more recent meets, which are then simulated thousands of times using a Monte Carlo analysis (also described by TullyRunners here). Over those thousands of race simulations, one can determine a team’s average place and average score, a runner’s average place, odds on winning, and odds on qualifying.
These are useful in cross country scenarios, where you have consistent runners and those who are a bit more up and down. For example:
| Tanner Time | Tanner Rating | Tanner Avg. | Tanner StDev. |
| 15:30 | 210 | ||
| 15:45 | 205 | ||
| 16:00 | 200 | ||
| 16:15 | 195 | ||
| 16:30 | 190 | 200 | 7.91 |
| MIXCSR Time | MIXCSR Rating | MIXCSR Avg. | MIXCSR StDev. |
| 16:09 | 197 | ||
| 16:12 | 196 | ||
| 16:15 | 195 | ||
| 16:18 | 194 | ||
| 16:21 | 193 | 195 | 1.58 |
Jacob at his best might be faster than I in four of the five races during the season. I’d almost never be All-State in Division 1, but he might contend for a top-5 spot or place 60th.
If we did 20 simulations, this is how it might turn out:
| Race | Tanner Avg. | Tanner StDev | Tanner Rating | MIXCSR Avg. | MIXCSR StDev | MIXCSR Rating |
| 1 | 200 | 7.9 | 202.1 | 195 | 1.6 | 195.6 |
| 2 | 200 | 7.9 | 196.2 | 195 | 1.6 | 194.1 |
| 3 | 200 | 7.9 | 190.0 | 195 | 1.6 | 199.2 |
| 4 | 200 | 7.9 | 193.4 | 195 | 1.6 | 192.5 |
| 5 | 200 | 7.9 | 206.8 | 195 | 1.6 | 195.7 |
| 6 | 200 | 7.9 | 201.8 | 195 | 1.6 | 196.1 |
| 7 | 200 | 7.9 | 171.6 | 195 | 1.6 | 194.9 |
| 8 | 200 | 7.9 | 189.2 | 195 | 1.6 | 195.9 |
| 9 | 200 | 7.9 | 205.5 | 195 | 1.6 | 197.0 |
| 10 | 200 | 7.9 | 203.8 | 195 | 1.6 | 192.6 |
| 11 | 200 | 7.9 | 192.3 | 195 | 1.6 | 196.5 |
| 12 | 200 | 7.9 | 196.9 | 195 | 1.6 | 196.4 |
| 13 | 200 | 7.9 | 198.5 | 195 | 1.6 | 195.6 |
| 14 | 200 | 7.9 | 203.2 | 195 | 1.6 | 194.1 |
| 15 | 200 | 7.9 | 193.9 | 195 | 1.6 | 192.6 |
| 16 | 200 | 7.9 | 199.3 | 195 | 1.6 | 193.2 |
| 17 | 200 | 7.9 | 208.7 | 195 | 1.6 | 194.2 |
| 18 | 200 | 7.9 | 213.7 | 195 | 1.6 | 194.6 |
| 19 | 200 | 7.9 | 212.6 | 195 | 1.6 | 197.1 |
| 20 | 200 | 7.9 | 206.3 | 195 | 1.6 | 193.9 |
I’d win four times, but I’d never have the ability to win a title like he had in Race 18. He’s usually All-State, but may cost his team a title through his effort in Race 7.
The simulations give the possibilities of those scenarios and all the various scoring scripts. A sixth girl that can pop off on any certain day, a reliable boy who always runs 17-flat, you name it. Hopefully, they better elucidate our contenders, qualifiers, and how these races play out over the weekend.
But always remember, races aren’t run on paper or on a computer. These projections are meant to better our sport, give more attention where little is given. Although I take pride in their accuracy, this endeavor would be quite boring if it were always perfect. I look forward to these being proven wrong and I expect to hear about it as well.
Is this the same intro from last year? Heck yeah. Let’s roll through these regionals!
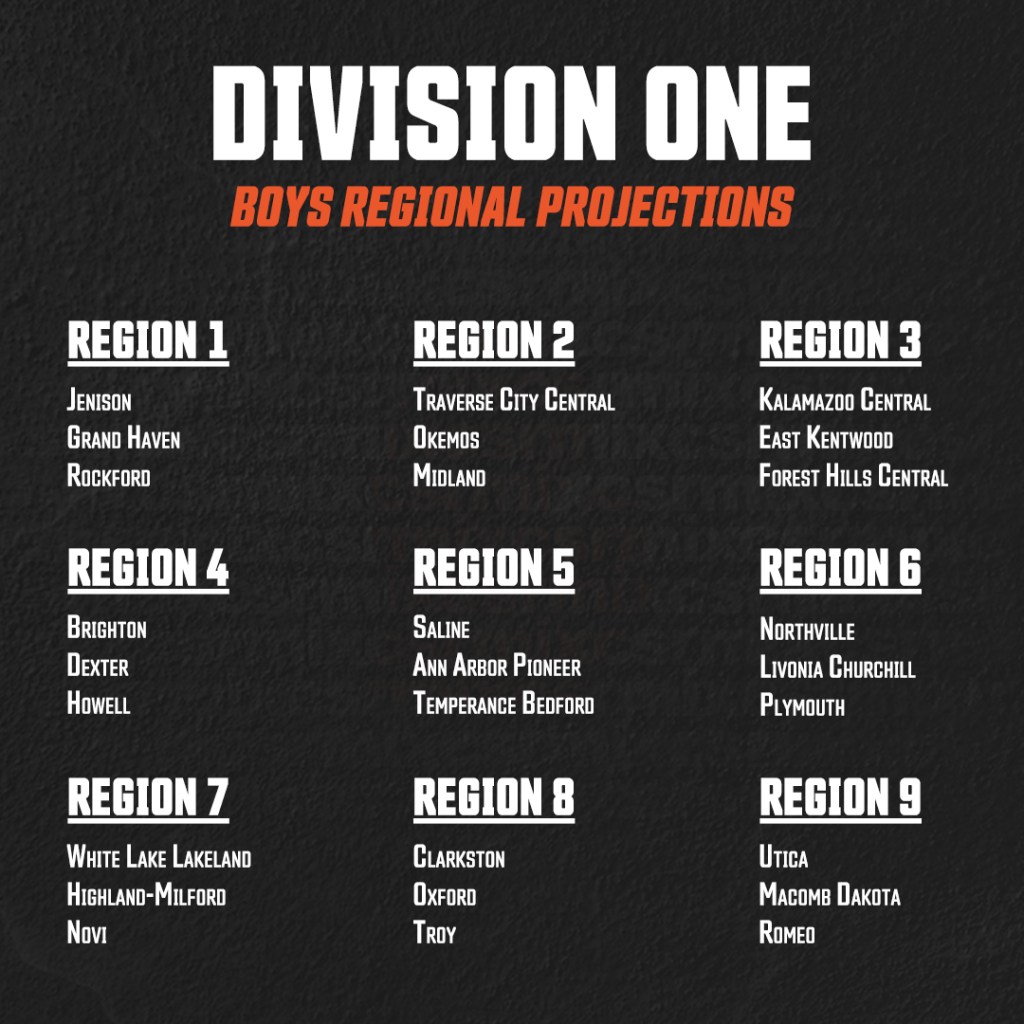
Region 1
What’s the Battle?
Grandville vs. the unexpected. Up front, the Livermore tandem is reliable. The OK Red Championship showed that the Bulldogs can go even deeper – all five scorers under 17:05. The team for them to catch is Rockford, who were able to all fall in under 17-flat. A closer gap between the two later in the race may lead to a Grandville upset.
Team
| Projected Place | Team | Avg. Score | Avg. Place | Win % | Qualify % | State Rank |
| 1 | Jenison | 39 | 1.0 | 95+ | 95+ | 3 |
| 2 | Grand Haven | 60 | 2.0 | 95+ | 8 | |
| 3 | Rockford | 93 | 3.1 | 93 | 23 | |
| 4 | Grandville | 111 | 4.0 | 7 | 29 | |
| 5 | Holland West Ottawa | 139 | 5.5 | 42 | ||
| 6 | Zeeland West | 142 | 5.9 | 43 | ||
| 7 | Hudsonville | 152 | 6.5 | 50 | ||
| 8 | Grand Rapids Northview | 246 | 8.1 | 83 | ||
| 9 | Greenville | 262 | 8.9 | 88 | ||
| 10 | Grand Rapids Union | 321 | 10.1 | 105 | ||
| 11 | Muskegon Reeths-Puffer | 334 | 11.1 | 108 | ||
| 12 | Muskegon Mona Shores | 343 | 11.8 | 112 | ||
| 13 | Wyoming | 374 | 13.0 | 118 | ||
| 14 | Muskegon | 460 | 14.0 | 135 |
Individual
| Projected Place | Grade | Name | Team | Avg. Place |
| 1 | 12 | Carter Livermore | Grandville | 1.4 |
| 2 | 12 | Seth Conner | Jenison | 1.8 |
| 3 | 10 | Luka Hammond | Grand Haven | 3.7 |
| 4 | 10 | Caden Livermore | Grandville | 4.2 |
| 5 | 12 | Ben Eisnor | Grand Haven | 5.0 |
| 6 | 11 | Aron Gal | Grand Haven | 6.8 |
| 7 | 12 | Parker Strelecki | Jenison | 6.8 |
| 8 | 12 | Mason Lucas | Jenison | 7.5 |
| 9 | 12 | Matthew Schwartz | Jenison | 8.5 |
| 10 | 12 | Noah Schuette | Rockford | 10.6 |
| 11 | 11 | Robert Dodd | Zeeland West | 13.0 |
| 12 | 11 | Keagan Smith | Zeeland West | 13.4 |
| 13 | 11 | Caleb TeBrake | Grand Rapids Northview | 13.5 |
| 14 | 11 | Preston VanOeffelen | Greenville | 14.8 |
| 15 | 11 | Nolan Wenglikowski | Jenison | 15.1 |
| 16 | 10 | Bradley Smies | Hudsonville | 15.8 |
| 17 | 11 | Hayden Lafferty | Rockford | 16.3 |
| 18 | 10 | Josiah Derksen | Rockford | 16.9 |
| 19 | 12 | Carson Berko | Grand Haven | 18.8 |
| 20 | 12 | Levi Jongekryg | Holland West Ottawa | 20.3 |
| 21 | 12 | Dominic Otto | Jenison | 21.0 |
| 22 | 12 | Nathan Loser | Rockford | 22.2 |
| 23 | 9 | Chase Sherman | Jenison | 25.0 |
| 24 | 11 | Kasen Todtz | Grand Haven | 27.0 |
| 25 | 11 | Jake Follett | Holland West Ottawa | 27.2 |
| 26 | 10 | Aaron Ebels | Grandville | 29.4 |
| 27 | 12 | Caden Karcher | Rockford | 29.5 |
| 28 | 12 | Dylan Pfeffer | Hudsonville | 30.7 |
| 29 | 12 | Aidan Ohanyan | Hudsonville | 30.7 |
| 30 | 11 | Michael Dummer | Holland West Ottawa | 31.0 |
Region 2
What’s the Battle?
Midland vs. Traverse City West for a qualifying spot. All year, the Chemics have been a welcome surprise, winning early at Northwood and the SVL Championship meet, racing with the big boys at Holly. Traverse City West travels south, hoping to spoil that year-round party. During last week’s Big North Championship, the Titans used the quick Cadillac course to attain PRs from four of their five scorers, nearly knocking off Traverse City Central in the process.
Team
| Projected Place | Team | Avg. Score | Avg. Place | Win % | Qualify % | State Rank |
| 1 | Traverse City Central | 65 | 1.2 | 82 | 95+ | 10 |
| 2 | Okemos | 85 | 2.2 | 16 | 93 | 20 |
| 3 | Midland | 93 | 2.8 | 88 | 21 | |
| 4 | Traverse City West | 108 | 3.8 | 19 | 25 | |
| 5 | Grand Ledge | 139 | 5.2 | 32 | ||
| 6 | Saginaw Heritage | 152 | 5.8 | 40 | ||
| 7 | H.H. Dow | 184 | 7.0 | 51 | ||
| 8 | Alpena | 223 | 8.6 | 58 | ||
| 9 | Bay City Western | 225 | 8.7 | 61 | ||
| 10 | Mt. Pleasant | 249 | 9.9 | 65 | ||
| 11 | East Lansing | 274 | 10.9 | 71 | ||
| 12 | Holt | 302 | 11.9 | 81 | ||
| 13 | Lansing Everett | 432 | 13.2 | 119 | ||
| 14 | Bay City Central | 437 | 13.8 | 120 |
Individual
| Projected Place | Grade | Name | Team | Avg. Place |
| 1 | 11 | Ian Morgan | Okemos | 1.8 |
| 2 | 11 | Caleb Keller | Traverse City Central | 2.7 |
| 3 | 10 | Liam Wierzba | Traverse City West | 4.6 |
| 4 | 11 | John Blaskowski | Saginaw Heritage | 4.9 |
| 5 | 11 | Benjamin Rottier | Grand Ledge | 5.5 |
| 6 | 11 | Jack Steen | Traverse City Central | 6.6 |
| 7 | 9 | Alexander Allen | Alpena | 7.6 |
| 8 | 12 | Ian Boss | Traverse City Central | 7.8 |
| 9 | 11 | Andrew Worsley | Midland | 10.1 |
| 10 | 12 | Logan Gehoski | Bay City Western | 10.6 |
| 11 | 10 | Cameron Cochran | Midland | 12.1 |
| 12 | 11 | Logan Bellinger | Midland | 12.7 |
| 13 | 12 | Nathan Beemer | Okemos | 15.0 |
| 14 | 11 | Hayden Murray | Traverse City West | 18.0 |
| 15 | 12 | Andrew Kaczmarczyk | Bay City Western | 18.3 |
| 16 | 12 | Lawrence Cubitt | Traverse City Central | 18.8 |
| 17 | 11 | Liam Preisser | East Lansing | 19.0 |
| 18 | 11 | Aidan Simrau | Traverse City West | 19.8 |
| 19 | 12 | Sam Scott | H.H. Dow | 20.1 |
| 20 | 12 | Leyton Minuth | H.H. Dow | 21.1 |
| 21 | 9 | Rylen Richey | Grand Ledge | 22.7 |
| 22 | 10 | Matthew Wortley | Saginaw Heritage | 23.4 |
| 23 | 12 | Nathan Wilkinson | Okemos | 24.9 |
| 24 | 12 | Spencer Porritt | Midland | 25.8 |
| 25 | 12 | Finley Markle | Okemos | 26.7 |
| 26 | 10 | Simon Shutt | Okemos | 27.1 |
| 27 | 11 | Malcolm Cesario | Okemos | 27.3 |
| 28 | 9 | Finn-Frost Grayson | Traverse City West | 27.6 |
| 29 | 11 | David Fiore | Saginaw Heritage | 28.7 |
| 30 | 12 | Andy Castro | H.H. Dow | 29.2 |
Region 3
What’s the Battle?
Five teams with a real shot of qualifying, three squads with legitimate chances of winning. Samuel Baker’s return has given Kalamazoo Central a major jab in the arm. Filtering for Region 3 teams at both Portage and the SMAC Championship results in a Giant wreck over the competition. Last week, this was all five scorers under 16:15.
Team
| Projected Place | Team | Avg. Score | Avg. Place | Win % | Qualify % | State Rank |
| 1 | Kalamazoo Central | 83 | 1.6 | 67 | 88 | 7 |
| 2 | East Kentwood | 99 | 2.6 | 14 | 78 | 13 |
| 3 | Forest Hills Central | 99 | 2.6 | 13 | 81 | 11 |
| 4 | Portage Central | 105 | 3.4 | 48 | 12 | |
| 5 | Kalamazoo Loy Norrix | 151 | 5.7 | 5 | 30 | |
| 6 | Caledonia | 152 | 5.7 | 28 | ||
| 7 | Lowell | 181 | 7.3 | 36 | ||
| 8 | Forest Hills Northern | 183 | 7.4 | 35 | ||
| 9 | Battle Creek Lakeview | 215 | 8.9 | 45 | ||
| 10 | Byron Center | 243 | 10.0 | 52 | ||
| 11 | Mattawan | 274 | 11.6 | 63 | ||
| 12 | Portage Northern | 279 | 11.8 | 56 | ||
| 13 | Grand Rapids Ottawa Hills | 294 | 12.6 | 68 |
Individual
| Projected Place | Grade | Name | Team | Avg. Place |
| 1 | 11 | Jackson Lam | Kalamazoo Loy Norrix | 1.4 |
| 2 | 10 | Ben Romero | Forest Hills Central | 4.4 |
| 3 | 12 | Sawyer McCarthy | Forest Hills Central | 5.3 |
| 4 | 12 | Kort Thompson | Caledonia | 6.5 |
| 5 | 10 | Samuel Baker | Kalamazoo Central | 6.8 |
| 6 | 12 | Evan Nickoles | East Kentwood | 7.4 |
| 7 | 12 | Isaac Tanis | East Kentwood | 7.9 |
| 8 | 12 | Spencer Parker | Portage Central | 8.1 |
| 9 | 12 | Mitchell Jeruzal | Byron Center | 8.6 |
| 10 | 11 | Cooper Byrne | Lowell | 11.4 |
| 11 | 10 | Marshall Huhn | Lowell | 12.3 |
| 12 | 10 | Justin Johnson | East Kentwood | 13.0 |
| 13 | 12 | Joseph Spada | Kalamazoo Central | 13.5 |
| 14 | 12 | Spencer Porter | Forest Hills Northern | 14.7 |
| 15 | 11 | Owen Fisher | Mattawan | 15.0 |
| 16 | 11 | Andrew Wright | Kalamazoo Central | 16.6 |
| 17 | 11 | Nicolas Morales – Sanchez | Kalamazoo Loy Norrix | 18.1 |
| 18 | 10 | Tristan Zhang | Portage Central | 19.4 |
| 19 | 11 | Ty Billings | Kalamazoo Central | 19.7 |
| 20 | 12 | Jacob Sanford | Forest Hills Central | 20.3 |
| 21 | 9 | Marcus Essling | Portage Central | 22.1 |
| 22 | 10 | Memphis Connor | Byron Center | 22.1 |
| 23 | 10 | Matii Tarekegn | East Kentwood | 22.8 |
| 24 | 12 | Jonah Bills | Battle Creek Lakeview | 26.7 |
| 25 | 11 | Owen Gifford | Portage Central | 27.1 |
| 26 | 11 | Logan Westgate | Portage Central | 28.1 |
| 27 | 11 | Elijah Thompson | Kalamazoo Central | 28.6 |
| 28 | 11 | Marcel Stork | Mattawan | 28.9 |
| 29 | 11 | Noah Johnston | Caledonia | 29.6 |
| 30 | 11 | Nicolas MoralesSan | Kalamazoo Loy Norrix | 31.2 |
Region 4
What’s the Battle?
Howell vs. Ann Arbor Skyline. The top-two spots should go to Brighton, a MIS podium contender and Dexter, an unheralded and reliable team. But Howell has been racing aggressively of late, moving up in the regional rankings thanks to prime performances from David DeLand and Alex Weller. On the other hand, Ann Arbor Skyline comes off an SEC Championship where 30 seconds separated their 1st and 5th runners. That sorta pack running can come in handy in a pressure-filled environment.
Team
| Projected Place | Team | Avg. Score | Avg. Place | Win % | Qualify % | State Rank |
| 1 | Brighton | 34 | 1.0 | 95+ | 95+ | 2 |
| 2 | Dexter | 100 | 2.4 | 95 | 27 | |
| 3 | Howell | 104 | 2.8 | 89 | 26 | |
| 4 | Ann Arbor Skyline | 129 | 4.1 | 13 | 41 | |
| 5 | Davison | 152 | 4.9 | 46 | ||
| 6 | Holly | 189 | 6.6 | 54 | ||
| 7 | Grand Blanc | 195 | 6.9 | 59 | ||
| 8 | Hartland | 206 | 7.6 | 62 | ||
| 9 | Flushing | 227 | 9.1 | 66 | ||
| 10 | Fenton | 240 | 9.7 | 69 | ||
| 11 | Lapeer | 276 | 11.0 | 82 | ||
| 12 | Swartz Creek | 317 | 12.1 | 91 | ||
| 13 | Jackson | 336 | 12.9 | 100 |
Individual
| Projected Place | Grade | Name | Team | Avg. Place |
| 1 | 10 | Jack MacGregor | Howell | 1.1 |
| 2 | 12 | Tyler Brock | Brighton | 2.2 |
| 3 | 12 | Julian Linebaugh | Dexter | 4.3 |
| 4 | 12 | James Latstetter | Flushing | 5.5 |
| 5 | 10 | Blake Kulesza | Brighton | 7.0 |
| 6 | 12 | Lucas Wood | Howell | 7.2 |
| 7 | 12 | Jacob Essenmacher | Lapeer | 7.5 |
| 8 | 12 | Tyler Outlaw | Brighton | 8.3 |
| 9 | 12 | Brady Millington | Brighton | 8.6 |
| 10 | 11 | Zach Wyderko | Brighton | 8.7 |
| 11 | 9 | Gavin Katic | Fenton | 9.3 |
| 12 | 12 | Caleb Snyder | Dexter | 10.1 |
| 13 | 12 | Drake Wallace | Howell | 15.1 |
| 14 | 12 | Elijah Forbord | Brighton | 15.6 |
| 15 | 10 | Broden Ladd | Holly | 15.8 |
| 16 | 11 | Mitchell Cory | Brighton | 16.8 |
| 17 | 12 | Maxwell Merrill | Grand Blanc | 20.9 |
| 18 | 12 | Luke Meyer | Davison | 21.9 |
| 19 | 10 | Coen Hill | Dexter | 22.0 |
| 20 | 10 | Nicholas Yuan | Ann Arbor Skyline | 22.6 |
| 21 | 11 | Bruno Cifaldi | Ann Arbor Skyline | 24.1 |
| 22 | 11 | Noah Linstrom | Davison | 24.2 |
| 23 | 11 | Braden Shiposh | Hartland | 24.6 |
| 24 | 10 | Matthew Guikema | Ann Arbor Skyline | 24.9 |
| 25 | 10 | Trevor Murphy | Holly | 25.2 |
| 26 | 12 | Landon Whitehead | Dexter | 28.0 |
| 27 | 9 | Gerard Gilmour | Fenton | 28.0 |
| 28 | 11 | Jonny Striler | Swartz Creek | 29.3 |
| 29 | 10 | Levi Mayer | Davison | 29.4 |
| 30 | 9 | Oskar MacArthur | Ann Arbor Skyline | 29.9 |
Region 5
What’s the Battle?
Seems… undramatic? Region 5 has always been a story of Saline + Ann Arbor Pioneer, then someone else. That someone else looks to be Temperance Bedford, who placed 4th in the final SEC Red jamboree. The Mules provide a few frontrunners and then a pack that can work together in the middle of the race.
Team
| Projected Place | Team | Avg. Score | Avg. Place | Win % | Qualify % | State Rank |
| 1 | Saline | 36 | 1.0 | 95+ | 95+ | 4 |
| 2 | Ann Arbor Pioneer | 51 | 2.0 | 95+ | 16 | |
| 3 | Temperance Bedford | 84 | 3.0 | 95+ | 33 | |
| 4 | Brownstown Woodhaven | 105 | 4.0 | 47 | ||
| 5 | Monroe | 136 | 5.0 | 57 | ||
| 6 | Allen Park | 210 | 6.4 | 90 | ||
| 7 | Dearborn | 218 | 6.9 | 89 | ||
| 8 | Gibraltar Carlson | 249 | 8.1 | 102 | ||
| 9 | Wyandotte Roosevelt | 265 | 8.8 | 106 | ||
| 10 | Dearborn Edsel Ford | 305 | 10.3 | 116 | ||
| 11 | Dearborn Fordson | 320 | 11.0 | 110 | ||
| 12 | Southgate Anderson | 337 | 11.9 | 117 | ||
| 13 | Ypsilanti Lincoln | 369 | 13.6 | 121 | ||
| 14 | Detroit Cass Tech | 369 | 13.6 | 124 | ||
| 15 | Belleville | 389 | 14.6 | 123 | ||
| 16 | Lincoln Park | 460 | 16.0 | 129 | ||
| 17 | Detroit Martin Luther King | 553 | 17.4 | 136 | ||
| 18 | Taylor | 555 | 17.6 | 137 |
Individual
| Projected Place | Grade | Name | Team | Avg. Place |
| 1 | 10 | Kamari Ronfeldt | Ann Arbor Pioneer | 1.0 |
| 2 | 11 | Beckett Crooks | Ann Arbor Pioneer | 2.0 |
| 3 | 10 | Jacob Szalay | Saline | 4.2 |
| 4 | 11 | Brennan LaRusso | Saline | 4.9 |
| 5 | 11 | Pierce Scheffler | Brownstown Woodhaven | 6.9 |
| 6 | 9 | Mourad Algahmi | Dearborn Fordson | 7.0 |
| 7 | 12 | Saman Meshinchi | Saline | 8.1 |
| 8 | 11 | Theo Sacks-Thomas | Ann Arbor Pioneer | 8.6 |
| 9 | 10 | Cameron Varner | Temperance Bedford | 8.7 |
| 10 | 11 | Dane Hieronimus | Temperance Bedford | 10.5 |
| 11 | 9 | Wesley Rogan | Saline | 10.6 |
| 12 | 12 | Collin Eckermann | Saline | 10.7 |
| 13 | 10 | John (Jack) Klein | Saline | 12.5 |
| 14 | 10 | Carlos Basulto | Saline | 13.6 |
| 15 | 12 | Myles Bray | Monroe | 14.9 |
| 16 | 11 | Alex Vazquez | Brownstown Woodhaven | 15.3 |
| 17 | 11 | Quinn Davis | Ann Arbor Pioneer | 19.0 |
| 18 | 12 | Nicholas (Nick) Balla | Temperance Bedford | 19.9 |
| 19 | 10 | Vincent Jones | Brownstown Woodhaven | 20.9 |
| 20 | 12 | Jordan Bunce | Temperance Bedford | 21.0 |
| 21 | 11 | Parker Bomia-Laberdee | Monroe | 21.2 |
| 22 | 11 | Thomas DeJesus | Ann Arbor Pioneer | 22.1 |
| 23 | 10 | Walker Ledbetter | Ann Arbor Pioneer | 23.0 |
| 24 | 11 | Jason Anderson | Dearborn | 26.4 |
| 25 | 10 | Logan Thomas | Temperance Bedford | 27.0 |
| 26 | 10 | Noah Amori | Wyandotte Roosevelt | 27.3 |
| 27 | 11 | Joshua Riggs | Monroe | 29.7 |
| 28 | 12 | Maceo Colon | Temperance Bedford | 30.4 |
| 29 | 12 | Aidan Ortiz | Temperance Bedford | 30.5 |
| 30 | 10 | Calen Alexander | Brownstown Woodhaven | 30.6 |
Region 6
What’s the Battle?
Canton vs. the question marks. At the end of September, the Cobras were in the MIS podium conversation. A month later and they’ve had some absences from their team. In spite of those missing, they’ve placed 3rd in Wayne County and 5th in the KLAA. With or without runners, Plymouth would be right in the conversation for advancing. I bet if I tracked improvement within a season (and between seasons), the Wildcats would be in contention for the most improved in the state. They find themselves here in the top-10 in the state and seemingly still growing.
Team
| Projected Place | Team | Avg. Score | Avg. Place | Win % | Qualify % | State Rank |
| 1 | Northville | 26 | 1.0 | 95+ | 95+ | 1 |
| 2 | Livonia Churchill | 70 | 2.1 | 95+ | 5 | |
| 3 | Plymouth | 82 | 3.2 | 72 | 9 | |
| 4 | Canton | 88 | 3.7 | 29 | 14 | |
| 5 | Salem | 118 | 5.0 | 24 | ||
| 6 | Ann Arbor Huron | 162 | 6.0 | 44 | ||
| 7 | Livonia Stevenson | 240 | 7.3 | 73 | ||
| 8 | Farmington | 251 | 8.0 | 79 | ||
| 9 | Detroit U-D Jesuit | 261 | 8.7 | 87 | ||
| 10 | Detroit Renaissance | 318 | 10.3 | 103 | ||
| 11 | Livonia Franklin | 334 | 11.6 | 113 | ||
| 12 | Westland John Glenn | 341 | 12.0 | 109 | ||
| 13 | Wayne Memorial | 341 | 12.0 | 111 | ||
| 14 | Dearborn Heights Crestwood | 442 | 14.1 | 128 | ||
| 15 | Ferndale | 458 | 14.9 | 130 | ||
| 16 | Detroit Mumford | 510 | 16.0 | 138 |
Individual
| Projected Place | Grade | Name | Team | Avg. Place |
| 1 | 11 | Aiden Pengelly | Canton | 1.0 |
| 2 | 12 | Ethan Powell | Northville | 2.2 |
| 3 | 12 | Joseph Rohmfeld | Livonia Churchill | 3.2 |
| 4 | 11 | Ben Hartigan | Northville | 3.8 |
| 5 | 10 | Brandon Cloud | Northville | 6.6 |
| 6 | 12 | Nick Barretto | Northville | 6.7 |
| 7 | 12 | Ishaan Kundapur | Northville | 6.8 |
| 8 | 12 | Chase Wolters | Livonia Churchill | 8.1 |
| 9 | 11 | Lucas LaPointe | Plymouth | 10.5 |
| 10 | 12 | Jack Chadwick | Plymouth | 10.6 |
| 11 | 12 | Ben Mussen | Plymouth | 11.9 |
| 12 | 12 | Malcolm Speigle | Livonia Churchill | 12.8 |
| 13 | 11 | Steven Dusseau | Canton | 13.4 |
| 14 | 11 | Ethan Hertza | Northville | 13.7 |
| 15 | 12 | Walker Brose | Ann Arbor Huron | 16.8 |
| 16 | 10 | Jack Hanner | Salem | 17.1 |
| 17 | 11 | Adrian Clarke | Plymouth | 17.5 |
| 18 | 11 | Ryan Stojov | Northville | 18.2 |
| 19 | 12 | Ben Clark | Canton | 19.1 |
| 20 | 10 | Austin Mercado | Salem | 20.5 |
| 21 | 12 | Adam Dicken | Canton | 20.8 |
| 22 | 12 | Isaac Demetter | Salem | 22.3 |
| 23 | 11 | Hudson Wojtkowicz | Livonia Churchill | 22.7 |
| 24 | 12 | Jonah Kraft | Ann Arbor Huron | 23.6 |
| 25 | 12 | Benjamin Peura | Farmington | 23.7 |
| 26 | 12 | Ethan Morche | Livonia Churchill | 23.9 |
| 27 | 12 | Aaron Messing | Livonia Stevenson | 28.5 |
| 28 | 12 | Teo Condevaux | Livonia Churchill | 29.8 |
| 29 | 11 | Max Frentner | Salem | 30.7 |
| 30 | 11 | Daniel Niehaus | Plymouth | 31.2 |
Region 7
What’s the Battle?
True proximity in these rivalries. White Lake Lakeland and Highland-Milford are LVC foes. This year’s iteration of the LVC was won by Lakeland, winning both their dual and the championship meet, where the Eagles were able to dot the top-seven with four of their athletes. Close in the mid-season, even closer now, Novi has snuck by Detroit Catholic Central in the projections.
Team
| Projected Place | Team | Avg. Score | Avg. Place | Win % | Qualify % | State Rank |
| 1 | White Lake Lakeland | 51 | 1.4 | 60 | 95+ | 17 |
| 2 | Highland-Milford | 55 | 1.6 | 40 | 95+ | 18 |
| 3 | Novi | 100 | 3.5 | 53 | 39 | |
| 4 | Detroit Catholic Central | 102 | 3.5 | 47 | 34 | |
| 5 | Walled Lake Northern | 134 | 5.0 | 49 | ||
| 6 | Royal Oak | 165 | 5.9 | 55 | ||
| 7 | South Lyon | 213 | 7.1 | 70 | ||
| 8 | South Lyon East | 238 | 8.0 | 75 | ||
| 9 | Beverly Hills Groves | 267 | 8.9 | 86 | ||
| 10 | West Bloomfield | 301 | 10.0 | 92 | ||
| 11 | Birmingham Seaholm | 342 | 11.4 | 101 | ||
| 12 | Brother Rice | 347 | 11.8 | 97 | ||
| 13 | Berkley | 369 | 13.1 | 104 | ||
| 14 | North Farmington | 381 | 13.9 | 107 | ||
| 15 | Walled Lake Western | 422 | 15.2 | 115 | ||
| 16 | Walled Lake Central | 443 | 15.5 | 122 |
Individual
| Projected Place | Grade | Name | Team | Avg. Place |
| 1 | 11 | Kyle O’Rourke | Highland-Milford | 1.0 |
| 2 | 12 | Drew Abbott | Detroit Catholic Central | 2.4 |
| 3 | 11 | Gavin Johns | White Lake Lakeland | 5.2 |
| 4 | 12 | Matthew Verellen | White Lake Lakeland | 5.4 |
| 5 | 11 | Bastien Beaubien | Highland-Milford | 6.2 |
| 6 | 10 | Trevor Baptist | Novi | 8.1 |
| 7 | 9 | Todd Tobin | Highland-Milford | 9.9 |
| 8 | 12 | Nolan Till | Royal Oak | 9.9 |
| 9 | 10 | Musa Kay | West Bloomfield | 10.0 |
| 10 | 12 | Ayden McDonald | White Lake Lakeland | 11.0 |
| 11 | 11 | Soma Sato | Novi | 11.6 |
| 12 | 11 | Finn Gammerath | Walled Lake Northern | 12.2 |
| 13 | 11 | Nolan Collins | Brother Rice | 12.5 |
| 14 | 12 | Jacob Kosidlo | White Lake Lakeland | 13.8 |
| 15 | 12 | Chase Griffith | Walled Lake Northern | 15.3 |
| 16 | 10 | Briggs Warren | Novi | 17.2 |
| 17 | 11 | Gavin Tisch | Detroit Catholic Central | 18.0 |
| 18 | 12 | Michael Nivala | White Lake Lakeland | 18.6 |
| 19 | 12 | Thomas Watson | Detroit Catholic Central | 19.3 |
| 20 | 10 | Josh Sanchez | Highland-Milford | 21.7 |
| 21 | 11 | Dylan Doggett | Highland-Milford | 22.6 |
| 22 | 11 | Isaac German | Novi | 24.2 |
| 23 | 11 | Brenden Humitz | White Lake Lakeland | 24.9 |
| 24 | 10 | Nathan Bruss | Walled Lake Northern | 25.0 |
| 25 | 11 | Aiden LaVictor | Beverly Hills Groves | 26.1 |
| 26 | 12 | Ryan Carrannanto | Highland-Milford | 26.1 |
| 27 | 12 | Liam Wyman | South Lyon | 26.4 |
| 28 | 9 | Nikhil Ball | South Lyon East | 27.4 |
| 29 | 12 | Evan Kelly | Highland-Milford | 28.2 |
| 30 | 12 | Jacob Mack | South Lyon East | 29.7 |
Region 8
What’s the Battle?
Troy and Rochester going at it for the final spot. Ranked right near each other in the state standings, separated a bit with regard to the region. Troy finds a major advantage by having six boys that could contend for four scoring spots, insurance in the case of a poor race. I wouldn’t discount the Falcons though, as they’re coming off an OAA White victory and they showed the ability in track to show up on regional day.
Team
| Projected Place | Team | Avg. Score | Avg. Place | Win % | Qualify % | State Rank |
| 1 | Clarkston | 54 | 1.1 | 89 | 95+ | 6 |
| 2 | Oxford | 67 | 1.9 | 11 | 95+ | 15 |
| 3 | Troy | 103 | 3.1 | 87 | 38 | |
| 4 | Rochester | 115 | 3.9 | 13 | 37 | |
| 5 | Lake Orion | 143 | 5.1 | 48 | ||
| 6 | Troy Athens | 162 | 5.9 | 53 | ||
| 7 | Utica Ford | 229 | 7.7 | 72 | ||
| 8 | Rochester Adams | 234 | 8.0 | 77 | ||
| 9 | Sterling Heights Stevenson | 252 | 9.6 | 80 | ||
| 10 | Bloomfield Hills | 254 | 9.6 | 76 | ||
| 11 | Rochester Hills Stoney Creek | 260 | 10.2 | 85 | ||
| 12 | Warren Cousino | 304 | 12.0 | 94 | ||
| 13 | Waterford Kettering | 382 | 13.0 | 114 | ||
| 14 | Waterford Mott | 439 | 14.1 | 125 | ||
| 15 | Warren Mott | 466 | 14.9 | 126 | ||
| 16 | Auburn Hills Avondale | 501 | 16.2 | 131 | ||
| 17 | Sterling Heights | 509 | 16.9 | 133 |
Individual
| Projected Place | Grade | Name | Team | Avg. Place |
| 1 | 12 | Alex McArthur | Oxford | 1.7 |
| 2 | 12 | Taye Levenson | Bloomfield Hills | 2.3 |
| 3 | 12 | Kian Schneeweis | Troy | 3.2 |
| 4 | 11 | Ryan Barnes | Clarkston | 4.6 |
| 5 | 12 | James Cusick | Oxford | 4.7 |
| 6 | 12 | Cayden DeGrendel | Clarkston | 6.1 |
| 7 | 11 | Nate Linden | Troy Athens | 8.5 |
| 8 | 11 | Max Houvener | Lake Orion | 8.8 |
| 9 | 12 | Collin McLaughlin | Rochester | 10.0 |
| 10 | 12 | Maxton Myrand | Oxford | 11.1 |
| 11 | 11 | David Dubeck | Clarkston | 11.3 |
| 12 | 11 | Dylan Pascoe | Rochester | 11.5 |
| 13 | 12 | Jaxson Nowik | Clarkston | 11.5 |
| 14 | 11 | Evan Owczarek | Rochester | 11.6 |
| 15 | 12 | Raymond Lucero II | Lake Orion | 15.6 |
| 16 | 12 | Myles Linden | Troy Athens | 16.0 |
| 17 | 12 | Aiden Baugh | Waterford Kettering | 18.0 |
| 18 | 12 | Akshat Arora | Troy | 19.8 |
| 19 | 9 | Cooper McNaughton | Clarkston | 20.9 |
| 20 | 11 | Cayden Canham | Oxford | 22.3 |
| 21 | 11 | Aaron Hemstreet | Warren Cousino | 22.9 |
| 22 | 12 | John Lonsway | Sterling Heights Stevenson | 23.0 |
| 23 | 12 | Jack Tultz | Clarkston | 24.5 |
| 24 | 12 | Kent Wilson | Clarkston | 25.1 |
| 25 | 11 | Isaac Clark | Troy | 26.1 |
| 26 | 12 | Braden Cinato | Warren Cousino | 28.5 |
| 27 | 10 | Zach Shaffer | Utica Ford | 28.9 |
| 28 | 9 | Ricardo Guajardo | Lake Orion | 29.5 |
| 29 | 12 | Jack Dysarz | Oxford | 29.6 |
| 30 | 10 | Henry Witt | Troy | 30.5 |
| 31 | 12 | Austin Xiao | Troy | 31.7 |
Region 9
What’s the Battle?
Utica, hoping to repeat the feat from two weeks back. At Eastwood in mid-October, spurred by a dominant top-two, the Chieftains were able to capture the County crown. With two weeks to celebrate and bask in the glory of their accomplishment, they could benefit from the gained confidence. On the other hand, a Romeo or Macomb Dakota may have spent these past two weeks stewing and concocting a strategy to pull an upset.
Team
| Projected Place | Team | Avg. Score | Avg. Place | Win % | Qualify % | State Rank |
| 1 | Utica | 59 | 1.4 | 68 | 95+ | 19 |
| 2 | Macomb Dakota | 65 | 1.9 | 29 | 95+ | 22 |
| 3 | Romeo | 81 | 2.8 | 95+ | 31 | |
| 4 | Grosse Pointe South | 167 | 4.5 | 60 | ||
| 5 | Utica Eisenhower | 178 | 5.3 | 64 | ||
| 6 | Fraser | 180 | 5.3 | 67 | ||
| 7 | Anchor Bay | 222 | 7.7 | 74 | ||
| 8 | Warren DeLaSalle | 222 | 7.9 | 78 | ||
| 9 | Grosse Pointe North | 231 | 8.3 | 84 | ||
| 10 | L’Anse Creuse North | 273 | 10.6 | 95 | ||
| 11 | L’Anse Creuse | 287 | 11.6 | 93 | ||
| 12 | Chippewa Valley | 292 | 12.0 | 96 | ||
| 13 | Port Huron Northern | 300 | 12.8 | 99 | ||
| 14 | St. Clair Shores Lakeview | 301 | 13.0 | 98 | ||
| 15 | Roseville | 467 | 15.0 | 127 | ||
| 16 | Warren Woods Tower | 515 | 16.2 | 132 | ||
| 17 | Detroit East English | 527 | 16.8 | 134 |
Individual
| Projected Place | Grade | Name | Team | Avg. Place |
| 1 | 11 | Harper Wesley | Utica | 1.8 |
| 2 | 12 | Lucas LaMilza | Macomb Dakota | 1.8 |
| 3 | 12 | Luke Morehouse | Utica | 2.8 |
| 4 | 11 | James Brickel | Romeo | 6.1 |
| 5 | 12 | Gavin Frandle | Utica | 8.7 |
| 6 | 11 | Owen Perry | Romeo | 9.1 |
| 7 | 12 | Jack Martin | Grosse Pointe South | 9.3 |
| 8 | 11 | Luke Allen | Romeo | 10.9 |
| 9 | 11 | Lance Edghill | Fraser | 12.2 |
| 10 | 12 | Aidan Daly | L’Anse Creuse | 12.5 |
| 11 | 11 | Charlie Curtis | Utica | 13.1 |
| 12 | 11 | Anthony Frei | Utica Eisenhower | 13.2 |
| 13 | 12 | Jensen McCutcheon | St. Clair Shores Lakeview | 13.9 |
| 14 | 11 | Joseph Kaleto | Macomb Dakota | 14.5 |
| 15 | 11 | Andrew Scheloske | Macomb Dakota | 15.1 |
| 16 | 12 | Greg Vogt | Anchor Bay | 15.3 |
| 17 | 11 | Oliver Davis | Macomb Dakota | 15.8 |
| 18 | 11 | Aaron Osterman | Anchor Bay | 17.7 |
| 19 | 12 | Colden Gray | Utica Eisenhower | 19.2 |
| 20 | 9 | Xavier Solgot | L’Anse Creuse North | 19.8 |
| 21 | 12 | Noah Redman | Macomb Dakota | 21.3 |
| 22 | 11 | Jacob Giovannini | Macomb Dakota | 22.2 |
| 23 | 12 | Alex Habarth | L’Anse Creuse | 23.0 |
| 24 | 12 | Tethyan McKenzie | Grosse Pointe South | 23.2 |
| 25 | 12 | Caleb Kosel | Grosse Pointe North | 26.3 |
| 26 | 11 | Nathan Kafoury | Warren DeLaSalle | 27.3 |
| 27 | 11 | Malcolm Richardson | Warren DeLaSalle | 28.0 |
| 28 | 11 | Eric DeWaele | Chippewa Valley | 28.9 |
| 29 | 10 | Carson Hlavin | Romeo | 29.7 |
| 30 | 12 | Colton Howell | Macomb Dakota | 29.8 |


