Finally, the start of the season we’ve all been waiting for. Throw out all the fast times from September, but apply all the lessons learned through the summer and fall. Regional week is here and with it comes the many projections and previews I’ll write.
Just as last year and throughout the season, I’m projecting these using race simulations. Through a season’s worth of speed ratings, one can determine a runner’s average rating and the variability of those ratings. Both those factors are then weighed towards more recent meets, which are then simulated thousands of times using a Monte Carlo analysis (also described by TullyRunners here). Over those thousands of race simulations, one can determine a team’s average place and average score, a runner’s average place, odds on winning, and odds on qualifying.
These are useful in cross country scenarios, where you have consistent runners and those who are a bit more up and down. For example:
| Tanner Time | Tanner Rating | Tanner Avg. | Tanner StDev. |
| 15:30 | 210 | ||
| 15:45 | 205 | ||
| 16:00 | 200 | ||
| 16:15 | 195 | ||
| 16:30 | 190 | 200 | 7.91 |
| MIXCSR Time | MIXCSR Rating | MIXCSR Avg. | MIXCSR StDev. |
| 16:09 | 197 | ||
| 16:12 | 196 | ||
| 16:15 | 195 | ||
| 16:18 | 194 | ||
| 16:21 | 193 | 195 | 1.58 |
Jacob at his best might be faster than I in four of the five races during the season. I’d almost never be All-State in Division 1, but he might contend for a top-5 spot or place 60th.
If we did 20 simulations, this is how it might turn out:
| Race | Tanner Avg. | Tanner StDev | Tanner Rating | MIXCSR Avg. | MIXCSR StDev | MIXCSR Rating |
| 1 | 200 | 7.9 | 202.1 | 195 | 1.6 | 195.6 |
| 2 | 200 | 7.9 | 196.2 | 195 | 1.6 | 194.1 |
| 3 | 200 | 7.9 | 190.0 | 195 | 1.6 | 199.2 |
| 4 | 200 | 7.9 | 193.4 | 195 | 1.6 | 192.5 |
| 5 | 200 | 7.9 | 206.8 | 195 | 1.6 | 195.7 |
| 6 | 200 | 7.9 | 201.8 | 195 | 1.6 | 196.1 |
| 7 | 200 | 7.9 | 171.6 | 195 | 1.6 | 194.9 |
| 8 | 200 | 7.9 | 189.2 | 195 | 1.6 | 195.9 |
| 9 | 200 | 7.9 | 205.5 | 195 | 1.6 | 197.0 |
| 10 | 200 | 7.9 | 203.8 | 195 | 1.6 | 192.6 |
| 11 | 200 | 7.9 | 192.3 | 195 | 1.6 | 196.5 |
| 12 | 200 | 7.9 | 196.9 | 195 | 1.6 | 196.4 |
| 13 | 200 | 7.9 | 198.5 | 195 | 1.6 | 195.6 |
| 14 | 200 | 7.9 | 203.2 | 195 | 1.6 | 194.1 |
| 15 | 200 | 7.9 | 193.9 | 195 | 1.6 | 192.6 |
| 16 | 200 | 7.9 | 199.3 | 195 | 1.6 | 193.2 |
| 17 | 200 | 7.9 | 208.7 | 195 | 1.6 | 194.2 |
| 18 | 200 | 7.9 | 213.7 | 195 | 1.6 | 194.6 |
| 19 | 200 | 7.9 | 212.6 | 195 | 1.6 | 197.1 |
| 20 | 200 | 7.9 | 206.3 | 195 | 1.6 | 193.9 |
I’d win four times, but I’d never have the ability to win a title like he had in Race 18. He’s usually All-State, but may cost his team a title through his effort in Race 7.
The simulations give the possibilities of those scenarios and all the various scoring scripts. A sixth girl that can pop off on any certain day, a reliable boy who always runs 17-flat, you name it. Hopefully, they better elucidate our contenders, qualifiers, and how these races play out over the weekend.
But always remember, races aren’t run on paper or on a computer. These projections are meant to better our sport, give more attention where little is given. Although I take pride in their accuracy, this endeavor would be quite boring if it were always perfect. I look forward to these being proven wrong and I expect to hear about it as well.

GIRLS
Ranked Teams
#9 Buckley
#12 Grand Traverse Academy
#13 Mason County Eastern
#26 Leland
Projected Individual Qualifier Cutoff
18th place.
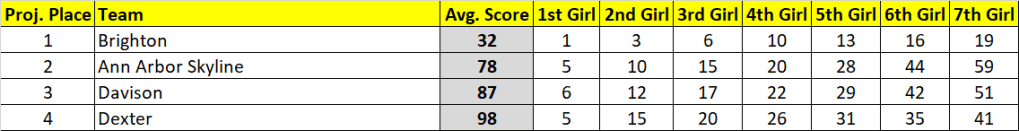
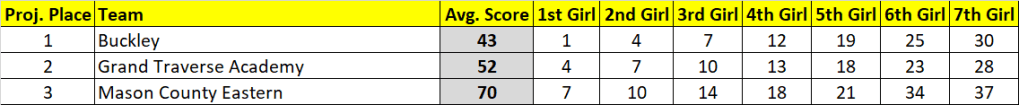
| Projected Place | Team | Avg. Score | Avg. Place | Win % | Top 3 % |
| 1 | Buckley | 43 | 1.3 | 71 | 95+ |
| 2 | Grand Traverse Academy | 52 | 1.8 | 29 | 95+ |
| 3 | Mason County Eastern | 70 | 2.9 | 95+ | |
| 4 | Leland | 105 | 4.1 | ||
| 5 | Frankfort | 120 | 5.1 | ||
| 6 | Lake Leelanau St. Mary | 130 | 5.8 | ||
| 7 | Pentwater | 171 | 7.0 |
| Projected Place | Grade | Name | Team | Avg. Place |
| 1 | 12 | Aiden Harrand | Buckley | 1.0 |
| 2 | 11 | Ella Knudsen | Leland | 2.2 |
| 3 | 9 | Addy Zeller | Bear Lake-Onekama | 3.9 |
| 4 | 10 | Kinsey Peer | Buckley | 7.5 |
| 5 | 9 | Addison Patrzik | Grand Traverse Academy | 7.6 |
| 6 | 10 | Lauren Niedzielski | Mason County Eastern | 8.6 |
| 7 | 10 | Brooklynn Frazee | Buckley | 8.8 |
| 8 | 12 | Paige Bell | Grand Traverse Academy | 10.1 |
| 9 | 10 | Shenoah Collier | Grand Traverse Academy | 10.7 |
| 10 | 11 | Lucy Shoup | Mason County Eastern | 10.8 |
| 11 | 9 | Mikayla Kulawiak | Buckley | 11.3 |
| 12 | 10 | Addison Chownyk | Frankfort | 12.4 |
| 13 | 9 | Natalie Burpee | Leland | 12.5 |
| 14 | 8 | Claire Couturier | Lake Leelanau St. Mary | 13.4 |
| 15 | 9 | Bailey Stephen | Grand Traverse Academy | 15.3 |
| 16 | 10 | Jennifer Kmiecik | Bear Lake-Onekama | 15.9 |
| 17 | 9 | Brailyn Johnson | Mason County Eastern | 16.7 |
| 18 | 12 | Abby Kissling | Brethren | 20.3 |
| 19 | 9 | Addison Malburg | Mason County Eastern | 21.9 |
| 20 | 10 | Natalie Brown | Bear Lake-Onekama | 22.8 |
| 21 | 9 | Kaylee Swanson | Buckley | 23.0 |
| 22 | 12 | Olivia Wing | Mason County Eastern | 23.1 |
| 23 | 9 | Ellen Schwaiger | Leland | 23.1 |
| 24 | 10 | Sofia Alaimo | Frankfort | 23.5 |
| 25 | 9 | Madison Smith | Grand Traverse Academy | 24.8 |
| 26 | 12 | Ava Butera | Grand Traverse Academy | 24.8 |
| 27 | 9 | Bailey Case | Pentwater | 25.4 |
| 28 | 9 | Tess Hoedel | Grand Traverse Academy | 25.7 |
| 29 | 12 | Kendra Couturier | Lake Leelanau St. Mary | 26.9 |
| 30 | 11 | Emily Alaimo | Maple City Glen Lake | 28.2 |
BOYS
Ranked Teams
#5 Mason County Eastern
#11 Maple City Glen Lake
#19 Frankfort
#27 Pentwater
Projected Individual Qualifier Cutoff
17th place.
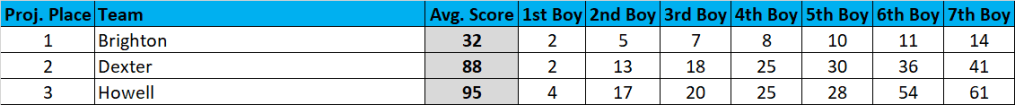
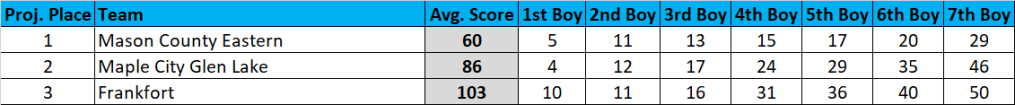
| Projected Place | Team | Avg. Score | Avg. Place | Win % | Top 3 % |
| 1 | Mason County Eastern | 60 | 1.0 | 95+ | 95+ |
| 2 | Maple City Glen Lake | 86 | 2.1 | 95+ | |
| 3 | Frankfort | 103 | 2.9 | 95+ | |
| 4 | Pentwater | 129 | 4.4 | ||
| 5 | Leland | 136 | 5.0 | ||
| 6 | Bear Lake-Onekama | 149 | 6.0 | ||
| 7 | Lake Leelanau St. Mary | 170 | 7.7 | ||
| 8 | Mesick | 171 | 7.8 | ||
| 9 | Grand Traverse Academy | 178 | 8.2 | ||
| 10 | Walkerville | 250 | 10.0 |
| Projected Place | Grade | Name | Team | Avg. Place |
| 1 | 11 | Mason Sinke | Bear Lake-Onekama | 1.8 |
| 2 | 12 | Abe VanDuinen | Pentwater | 2.6 |
| 3 | 9 | Kyle Redman | Mesick | 3.3 |
| 4 | 11 | Colebrook Sutherland | Maple City Glen Lake | 4.2 |
| 5 | 11 | Alex Tyndall | Mason County Eastern | 4.6 |
| 6 | 9 | Ty Redman | Mesick | 5.4 |
| 7 | 12 | Kaden Forward | Bear Lake-Onekama | 6.4 |
| 8 | 12 | Mitchel Daniels | Pentwater | 8.7 |
| 9 | 9 | Sebastian Dunaway | Frankfort | 9.8 |
| 10 | 11 | Carroll Robotham | Frankfort | 10.6 |
| 11 | 12 | Luke Niedzielski | Mason County Eastern | 11.5 |
| 12 | 9 | Abraham Feeney | Maple City Glen Lake | 12.9 |
| 13 | 11 | Henry Malburg | Mason County Eastern | 14.0 |
| 14 | 9 | Milo Shoup | Mason County Eastern | 15.0 |
| 15 | 12 | Peter Hybza | Mason County Eastern | 15.5 |
| 16 | 10 | Keith Crompton | Frankfort | 15.7 |
| 17 | 12 | Agustin Creamer | Leland | 16.0 |
| 18 | 10 | Liam McCaw | Maple City Glen Lake | 17.0 |
| 19 | 11 | Greyson Hoeflinger | Mason County Eastern | 19.6 |
| 20 | 11 | Parker Rubin | Grand Traverse Academy | 20.1 |
| 21 | 10 | Cody Couturier | Lake Leelanau St. Mary | 21.5 |
| 22 | 10 | Matthew Bentley | Buckley | 22.4 |
| 23 | 9 | Evan Keen | Leland | 24.4 |
| 24 | 10 | Oliver Mitchell | Lake Leelanau St. Mary | 24.9 |
| 25 | 9 | Joel Martin | Maple City Glen Lake | 27.2 |
| 26 | 9 | Aron Mascorro | Walkerville | 30.0 |
| 27 | 11 | Ron Hasenbank | Mason County Eastern | 30.2 |
| 28 | 10 | Wyatt Roberts | Pentwater | 30.2 |
| 29 | 10 | Easton Nowak | Bear Lake-Onekama | 31.5 |
| 30 | 10 | Jacob Plamondon | Maple City Glen Lake | 32.2 |