Finally, the start of the season we’ve all been waiting for. Throw out all the fast times from September, but apply all the lessons learned through the summer and fall. Regional week is here and with it comes the many projections and previews I’ll write.
Just as last year and throughout the season, I’m projecting these using race simulations. Through a season’s worth of speed ratings, one can determine a runner’s average rating and the variability of those ratings. Both those factors are then weighed towards more recent meets, which are then simulated thousands of times using a Monte Carlo analysis (also described by TullyRunners here). Over those thousands of race simulations, one can determine a team’s average place and average score, a runner’s average place, odds on winning, and odds on qualifying.
These are useful in cross country scenarios, where you have consistent runners and those who are a bit more up and down. For example:
| Tanner Time | Tanner Rating | Tanner Avg. | Tanner StDev. |
| 15:30 | 210 | ||
| 15:45 | 205 | ||
| 16:00 | 200 | ||
| 16:15 | 195 | ||
| 16:30 | 190 | 200 | 7.91 |
| MIXCSR Time | MIXCSR Rating | MIXCSR Avg. | MIXCSR StDev. |
| 16:09 | 197 | ||
| 16:12 | 196 | ||
| 16:15 | 195 | ||
| 16:18 | 194 | ||
| 16:21 | 193 | 195 | 1.58 |
Jacob at his best might be faster than I in four of the five races during the season. I’d almost never be All-State in Division 1, but he might contend for a top-5 spot or place 60th.
If we did 20 simulations, this is how it might turn out:
| Race | Tanner Avg. | Tanner StDev | Tanner Rating | MIXCSR Avg. | MIXCSR StDev | MIXCSR Rating |
| 1 | 200 | 7.9 | 202.1 | 195 | 1.6 | 195.6 |
| 2 | 200 | 7.9 | 196.2 | 195 | 1.6 | 194.1 |
| 3 | 200 | 7.9 | 190.0 | 195 | 1.6 | 199.2 |
| 4 | 200 | 7.9 | 193.4 | 195 | 1.6 | 192.5 |
| 5 | 200 | 7.9 | 206.8 | 195 | 1.6 | 195.7 |
| 6 | 200 | 7.9 | 201.8 | 195 | 1.6 | 196.1 |
| 7 | 200 | 7.9 | 171.6 | 195 | 1.6 | 194.9 |
| 8 | 200 | 7.9 | 189.2 | 195 | 1.6 | 195.9 |
| 9 | 200 | 7.9 | 205.5 | 195 | 1.6 | 197.0 |
| 10 | 200 | 7.9 | 203.8 | 195 | 1.6 | 192.6 |
| 11 | 200 | 7.9 | 192.3 | 195 | 1.6 | 196.5 |
| 12 | 200 | 7.9 | 196.9 | 195 | 1.6 | 196.4 |
| 13 | 200 | 7.9 | 198.5 | 195 | 1.6 | 195.6 |
| 14 | 200 | 7.9 | 203.2 | 195 | 1.6 | 194.1 |
| 15 | 200 | 7.9 | 193.9 | 195 | 1.6 | 192.6 |
| 16 | 200 | 7.9 | 199.3 | 195 | 1.6 | 193.2 |
| 17 | 200 | 7.9 | 208.7 | 195 | 1.6 | 194.2 |
| 18 | 200 | 7.9 | 213.7 | 195 | 1.6 | 194.6 |
| 19 | 200 | 7.9 | 212.6 | 195 | 1.6 | 197.1 |
| 20 | 200 | 7.9 | 206.3 | 195 | 1.6 | 193.9 |
I’d win four times, but I’d never have the ability to win a title like he had in Race 18. He’s usually All-State, but may cost his team a title through his effort in Race 7.
The simulations give the possibilities of those scenarios and all the various scoring scripts. A sixth girl that can pop off on any certain day, a reliable boy who always runs 17-flat, you name it. Hopefully, they better elucidate our contenders, qualifiers, and how these races play out over the weekend.
But always remember, races aren’t run on paper or on a computer. These projections are meant to better our sport, give more attention where little is given. Although I take pride in their accuracy, this endeavor would be quite boring if it were always perfect. I look forward to these being proven wrong and I expect to hear about it as well.
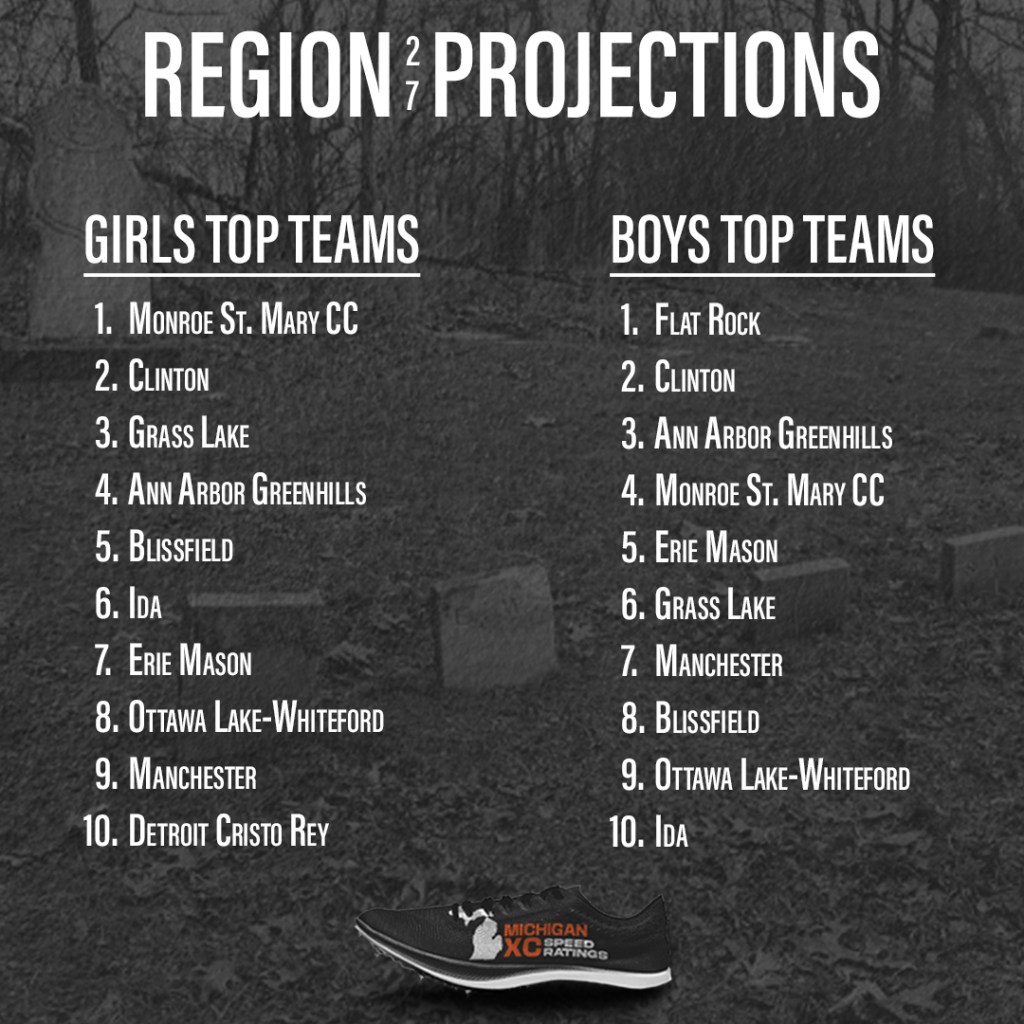
GIRLS
Ranked Teams
#23 Chelsea
Projected Individual Qualifier Cutoff
With essentially four teams battling for two spots, good luck figuring this one out!
| Projected Place | Team | Avg. Score | Avg. Place | Win % | Top 3 % |
| 1 | Chelsea | 75 | 1.1 | 92 | 95+ |
| 2 | Tecumseh | 99 | 2.5 | 85 | |
| 3 | Adrian | 110 | 3.5 | 45 | |
| 4 | Monroe Jefferson | 110 | 3.5 | 49 | |
| 5 | Ann Arbor Gabriel Richard | 122 | 4.4 | 21 | |
| 6 | Carleton Airport | 148 | 6.0 | ||
| 7 | New Boston Huron | 181 | 7.8 | ||
| 8 | Grosse Ile | 185 | 8.0 | ||
| 9 | Riverview | 186 | 8.2 | ||
| 10 | Dundee | 256 | 10.1 | ||
| 11 | Milan | 270 | 10.9 | ||
| 12 | Ypsilanti | 323 | 12.0 |

| Projected Place | Grade | Name | Team | Avg. Place |
| 1 | 11 | Sophy Skeels | Adrian | 1.9 |
| 2 | 12 | Jenna Pilachowski | Monroe Jefferson | 2.1 |
| 3 | 11 | Natalia DeMea | Chelsea | 2.6 |
| 4 | 12 | Anastee Davis | Adrian | 4.0 |
| 5 | 9 | Ayda Skeels | Adrian | 5.4 |
| 6 | 12 | Cecilia Ortega | Carleton Airport | 7.2 |
| 7 | 11 | Madison Morris | Tecumseh | 7.4 |
| 8 | 12 | Sparrow Centeno | Southgate Anderson | 8.3 |
| 9 | 10 | Avery Turk | New Boston Huron | 8.8 |
| 10 | 11 | Courtney Bovair | Carleton Airport | 10.2 |
| 11 | 10 | Falyn Doss | New Boston Huron | 10.3 |
| 12 | 10 | Samantha Bieber | Chelsea | 12.2 |
| 13 | 12 | Riley Peer | Monroe Jefferson | 15.9 |
| 14 | 12 | Daniela Hinojos | Riverview | 16.7 |
| 15 | 10 | Alyssa Korte | Grosse Ile | 17.2 |
| 16 | 9 | Zora Ziolkowski | Chelsea | 17.9 |
| 17 | 12 | Erin Stuk | Ann Arbor Gabriel Richard | 18.3 |
| 18 | 11 | Kim Miller | Monroe Jefferson | 19.4 |
| 19 | 10 | Claire Cousineau | Tecumseh | 20.3 |
| 20 | 11 | Marisa Chuey | Trenton | 22.2 |
| 21 | 12 | Seren Angus | Chelsea | 22.5 |
| 22 | 11 | Kaylee Hovey | Dundee | 23.2 |
| 23 | 10 | Avery Boggs | Riverview | 23.3 |
| 24 | 9 | Ava Pfaffenbach | Ann Arbor Gabriel Richard | 26.1 |
| 25 | 9 | Maya Whelan | Tecumseh | 26.2 |
| 26 | 11 | Lauren Thompson | Chelsea | 26.9 |
| 27 | 10 | Avery Faut | Ann Arbor Gabriel Richard | 27.8 |
| 28 | 11 | Avery Dent | Ann Arbor Gabriel Richard | 28.3 |
| 29 | 9 | London Landini | Tecumseh | 29.2 |
| 30 | 9 | Leila Morris | Tecumseh | 30.0 |
BOYS
Ranked Teams
#7 Adrian
#22 Chelsea
Projected Individual Qualifier Cutoff
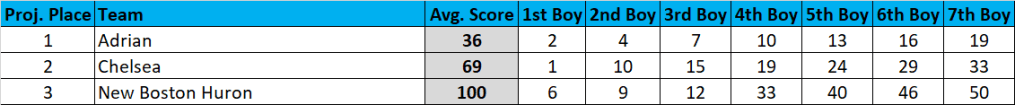
Adrian leaving their footprint all over the top-20 leaves many individual spots further back to 21st.
| Projected Place | Team | Avg. Score | Avg. Place | Win % | Top 3 % |
| 1 | Adrian | 36 | 1.0 | 95+ | 95+ |
| 2 | Chelsea | 69 | 2.0 | 95+ | |
| 3 | New Boston Huron | 100 | 3.0 | 95+ | |
| 4 | Ann Arbor Gabriel Richard | 128 | 4.1 | ||
| 5 | Riverview | 156 | 5.1 | ||
| 6 | Monroe Jefferson | 172 | 6.1 | ||
| 7 | Tecumseh | 186 | 7.0 | ||
| 8 | Carleton Airport | 196 | 7.7 | ||
| 9 | Dundee | 248 | 9.2 | ||
| 10 | Grosse Ile | 266 | 10.0 | ||
| 11 | Ypsilanti | 289 | 10.9 | ||
| 12 | Milan | 326 | 11.9 | ||
| 13 | Summit Academy North | 403 | 13.0 |
| Projected Place | Grade | Name | Team | Avg. Place |
| 1 | 12 | Connell Alford | Chelsea | 1.0 |
| 2 | 12 | Braylon Petty | Adrian | 2.4 |
| 3 | 12 | Logan Ruffner | Riverview | 2.7 |
| 4 | 10 | Moises Salazar | Adrian | 4.1 |
| 5 | 11 | Lucas Kuhn | New Boston Huron | 6.2 |
| 6 | 11 | Isaak Rubley | Dundee | 6.4 |
| 7 | 12 | Matthew Canales | Adrian | 7.3 |
| 8 | 10 | Luke Dulecki | New Boston Huron | 10.2 |
| 9 | 12 | Abdul Ghennewa | New Boston Huron | 10.5 |
| 10 | 12 | Hayden Holmes | Riverview | 11.6 |
| 11 | 12 | Jackson Dell | Chelsea | 11.8 |
| 12 | 12 | Chase Nyack | Adrian | 12.2 |
| 13 | 9 | Carter Fenner | Adrian | 13.3 |
| 14 | 12 | Jackson Nyack | Adrian | 14.1 |
| 15 | 10 | Beckett Boos | Chelsea | 15.0 |
| 16 | 12 | Grant Fahle | Tecumseh | 16.3 |
| 17 | 9 | Silas Skeels | Adrian | 17.1 |
| 18 | 10 | Linus Helzerman | Chelsea | 17.3 |
| 19 | 11 | Callum Bell | Carleton Airport | 19.6 |
| 20 | 12 | Sunishthh Singh | Ann Arbor Gabriel Richard | 20.0 |
| 21 | 12 | Luke Bounerba | Ann Arbor Gabriel Richard | 20.8 |
| 22 | 10 | Joseph Horn | Ann Arbor Gabriel Richard | 24.0 |
| 23 | 9 | Wyeth Angus | Chelsea | 24.6 |
| 24 | 10 | William Dobbertin | Carleton Airport | 25.6 |
| 25 | 12 | Israel Garcia | Riverview | 27.9 |
| 26 | 12 | William Steinhour | Monroe Jefferson | 28.0 |
| 27 | 11 | Malaki Muhammud | Ypsilanti | 28.9 |
| 28 | 11 | Brant Maley | Chelsea | 30.8 |
| 29 | 12 | Gabriel Natividad | Trenton | 31.2 |
| 30 | 10 | Matthew Carbajo | Grosse Ile | 31.7 |

GIRLS
Ranked Teams
#2 Ann Arbor Pioneer
#7 Saline
Projected Individual Qualifier Cutoff
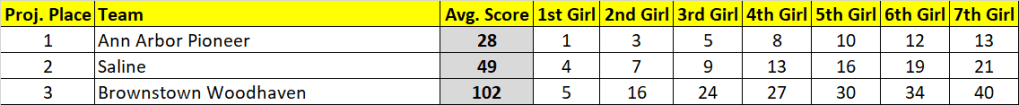
Two dominant teams knock individuals down to 23rd place.
| Projected Place | Team | Avg. Score | Avg. Place | Win % | Top 3 % |
| 1 | Ann Arbor Pioneer | 28 | 1.0 | 95+ | 95+ |
| 2 | Saline | 49 | 2.0 | 95+ | |
| 3 | Brownstown Woodhaven | 102 | 3.0 | 95+ | |
| 4 | Temperance Bedford | 165 | 4.2 | ||
| 5 | Allen Park | 178 | 5.4 | ||
| 6 | Monroe | 181 | 5.7 | ||
| 7 | Wyandotte Roosevelt | 193 | 6.7 | ||
| 8 | Dearborn Heights Crestwood | 220 | 8.2 | ||
| 9 | Detroit Cass Tech | 242 | 9.0 | ||
| 10 | Gibraltar Carlson | 259 | 9.8 | ||
| 11 | Dearborn | 304 | 11.1 | ||
| 12 | Lincoln Park | 359 | 12.5 | ||
| 13 | Belleville | 372 | 13.0 | ||
| 14 | Dearborn Edsel Ford | 403 | 13.9 | ||
| 15 | Detroit Martin Luther King | 430 | 14.7 | ||
| 16 | Dearborn Fordson | 466 | 15.8 |
| Projected Place | Grade | Name | Team | Avg. Place |
| 1 | 12 | Rachel Forsyth | Ann Arbor Pioneer | 1.0 |
| 2 | 12 | Lydia Bowman | Ann Arbor Pioneer | 3.3 |
| 3 | 12 | Elaina (Laney) Alig | Saline | 4.0 |
| 4 | 12 | Payton Scheffler | Brownstown Woodhaven | 4.8 |
| 5 | 9 | Anyla Robinson | Detroit Cass Tech | 4.9 |
| 6 | 12 | Natalie Mello | Ann Arbor Pioneer | 5.8 |
| 7 | 11 | Corynn Gady | Saline | 7.5 |
| 8 | 10 | Lillian Schlack | Saline | 7.9 |
| 9 | 12 | Sylvia Sanok Dufallo | Ann Arbor Pioneer | 8.6 |
| 10 | 12 | Katie Hume | Ann Arbor Pioneer | 9.7 |
| 11 | 10 | Quincy Behm | Ann Arbor Pioneer | 11.5 |
| 12 | 9 | Nina Moore | Ann Arbor Pioneer | 12.7 |
| 13 | 9 | Iva Ravindra | Temperance Bedford | 14.2 |
| 14 | 9 | Sophie Roth | Saline | 14.2 |
| 15 | 12 | Viktoria Bloniarz | Monroe | 14.8 |
| 16 | 9 | Hope Noal | Brownstown Woodhaven | 15.5 |
| 17 | 12 | Nancy Gage | Saline | 16.9 |
| 18 | 10 | Eleanor Grant | Wyandotte Roosevelt | 18.7 |
| 19 | 11 | Mackenzie Sellenraad | Saline | 18.9 |
| 20 | 11 | Abby Roth | Saline | 19.2 |
| 21 | 12 | Batoul Hamka | Dearborn | 21.4 |
| 22 | 12 | Claire Bireta | Allen Park | 21.4 |
| 23 | 10 | Sarah Wazne | Dearborn Heights Crestwood | 23.5 |
| 24 | 9 | Reagan Reaume | Gibraltar Carlson | 24.4 |
| 25 | 11 | Raelyn McLaughlin | Brownstown Woodhaven | 25.9 |
| 26 | 10 | Elliana Perugi | Brownstown Woodhaven | 26.9 |
| 27 | 12 | Lauren Moreno | Wyandotte Roosevelt | 28.2 |
| 28 | 10 | Anna Coury | Monroe | 28.8 |
| 29 | 10 | Joslyn Bechtol | Brownstown Woodhaven | 30.4 |
| 30 | 11 | Anahi Chapa | Allen Park | 30.7 |
BOYS
Ranked Teams
#5 Ann Arbor Pioneer
#20 Saline
Projected Individual Qualifier Cutoff
Weighing out the percentages and last qualifiers between Bedford, AP, Woodhaven advancing, I’m coming out on 21st place.
| Projected Place | Team | Avg. Score | Avg. Place | Win % | Top 3 % |
| 1 | Ann Arbor Pioneer | 27 | 1.0 | 95+ | 95+ |
| 2 | Saline | 50 | 2.0 | 95+ | |
| 3 | Temperance Bedford | 114 | 3.8 | 45 | |
| 4 | Brownstown Woodhaven | 115 | 3.9 | 35 | |
| 5 | Allen Park | 119 | 4.5 | 19 | |
| 6 | Monroe | 138 | 5.9 | ||
| 7 | Dearborn | 219 | 7.1 | ||
| 8 | Wyandotte Roosevelt | 237 | 8.2 | ||
| 9 | Gibraltar Carlson | 251 | 8.8 | ||
| 10 | Belleville | 312 | 10.3 | ||
| 11 | Detroit Cass Tech | 324 | 10.9 | ||
| 12 | Dearborn Heights Crestwood | 353 | 12.1 | ||
| 13 | Lincoln Park | 366 | 12.7 |

| Projected Place | Grade | Name | Team | Avg. Place |
| 1 | 9 | Kamari Ronfeldt | Ann Arbor Pioneer | 1.1 |
| 2 | 12 | Truman Johnson | Saline | 2.3 |
| 3 | 12 | Vincent Peterson Sand | Ann Arbor Pioneer | 3.0 |
| 4 | 12 | Eric Overdier | Ann Arbor Pioneer | 5.5 |
| 5 | 10 | Beckett Crooks | Ann Arbor Pioneer | 5.7 |
| 6 | 12 | Andrew Foshag | Monroe | 6.7 |
| 7 | 10 | Pierce Scheffler | Brownstown Woodhaven | 7.9 |
| 8 | 9 | Jacob Szalay | Saline | 8.9 |
| 9 | 10 | Brennan LaRusso | Saline | 9.0 |
| 10 | 12 | Caleb Wynn | Allen Park | 10.2 |
| 11 | 10 | Alex Vazquez | Brownstown Woodhaven | 12.9 |
| 12 | 10 | Theo Sacks-Thomas | Ann Arbor Pioneer | 13.6 |
| 13 | 10 | Dane Hieronimus | Temperance Bedford | 13.8 |
| 14 | 11 | Brady Boroniec | Allen Park | 13.9 |
| 15 | 11 | Saman Meshinchi | Saline | 14.2 |
| 16 | 12 | Patrick Donoghue | Ann Arbor Pioneer | 15.0 |
| 17 | 12 | Koen Lanker | Saline | 16.4 |
| 18 | 12 | Grayson Albers | Ypsilanti Lincoln | 18.3 |
| 19 | 12 | Evan Smith | Brownstown Woodhaven | 20.4 |
| 20 | 12 | Joey Stevenson | Ann Arbor Pioneer | 20.9 |
| 21 | 9 | John (Jack) Klein | Saline | 21.1 |
| 22 | 11 | Myles Bray | Monroe | 21.6 |
| 23 | 9 | Cameron Varner | Temperance Bedford | 22.2 |
| 24 | 11 | William Rosales | Saline | 24.8 |
| 25 | 12 | Matthew Mizzi | Allen Park | 26.4 |
| 26 | 11 | Jordan Bunce | Temperance Bedford | 27.3 |
| 27 | 11 | Reggie Geftos | Monroe | 28.4 |
| 28 | 11 | Aidan Ortiz | Temperance Bedford | 28.9 |
| 29 | 12 | Ethan Johnson | Wyandotte Roosevelt | 31.1 |
| 30 | 10 | Nicholas Balla | Temperance Bedford | 31.5 |