Uncategorized

An Early Look: Region 20

jakeflynn

(Jake Flynn still holds the school record at Benzie, I’m wouldn’t be shocked if he holds the course record as well)

GIRLS

Reg20gt

Reg20gi

Hart isn’t as strong as last year, but they should walk here, potentially sweeping the top 5.  Benzie Central is undoubtedly a top 10 team, but you wouldn’t know it by the score.  Two ranked teams in the battle for 3rd, practically neighbors even, unfortunately only one can make it.  Individually, this is about as tough as you’ll get for Division 3.  This might be even stronger than the next region I’ll be looking at (in Division 1).

Hart

  • Rank: 1

Defending state champs that could’ve made an argument for being the best team last year.  They probably can’t make that case this year, but again have excellent depth.

  • Highest Rated: Savannah Ackley

Savannah started out with a bang, 18:09 at Pete Moss, then suffered at Spartan.  Recovered to consistently run 18’s for the rest of the year.  Finished 7th at State Finals.  Then went 11:10 and finished 6th (11:25) at the track Finals.

  • Career achievement/improvement: Brenna Aerts

Brenna has spent three years in the program.  She barely broke 20 as a freshman and has dropped into the low 19’s the past two seasons.  Her 8th place here last year has been her best finish and she was All-State last year as well.

  • Darkhorse: Audrianna Enns

Hard to find a darkhorse with this team, though Audrianna has a chance for improvement.  She’s always had some speed, running 2:20 as an 8th grader, but showed increased strength in dropping her 1600m to 5:20.  Expect to see multiple sub-19 performances this season.

Benzie Central

  • Rank: 6

As I said, Benzie is undoubtedly a top 10 team.  They were 8th at MIS last year and return many of those same girls.  My guess is competing against a team like Hart pulls them along and benefits them for big races later in the season.

  • Highest Rated: Cierra Guay

Cierra has shown some nice gradual progression throughout her years.  She’s dropped more than 30 seconds each year, and 2018 was the first time she placed top 15 at regionals.  In track, she saw some major leaps, especially in the 1600m, getting down to 5:30

  • Career achievement/improvement: Paige Johnston

Another girl that’s done about every event in track.  The only events missing from her profile are the disc and 300h.  She’s spent every year under 20 and every year in the top 15 here.

  • Darkhorse: Haley VanWagoner

Haley really sped up as 2018’s season went on.  Finished in over 24 minutes at Pete Moss, but ended the year in the 20’s.  Her track times indicate someone capable of running in the low 20’s, perhaps faster.

McBain

  • Rank: 15

McBain was about on the same level as Benzie last year, but loses their top two runners.  The team finished 5th at Northern Michigan, 3rd at Regionals, and 9th at State Finals.  They add some talented freshman to mitigate those losses.

  • Highest Rated: Maggie O’Malley

As far as I know, the last of the O’Malley clan.  Maggie was just barely over 20 minutes last year, finishing 16th here.  She made a nice jump in the 16 during track, erasing 15 seconds down to 5:36.

  • Career achievement/improvement: Megan Taylor

Megan has been a model of consistency.  Her best times the last three years have been 21:23, 21:21, 21:22.  Someone like Megan is essential for every team, comes on strong at the end of every season, is dependable, and can likely place before others 5th runners.

  • Darkhorse: Regan Hill

Regan has consistently been in the 13’s for McBain’s middle school team.  In track, she snagged two major PRs, running 6:03 and 13:06.

Others to Watch

  • Dreea Atchison, Morley Stanwood

Dreea ran a HUGE personal best to finish 11th here last year.  19:24 when her best time during the season was a 20:03.

  • Paige Swiriduk, Manton

Paige has been near or at the front of many northern Michigan invitationals for years now.  She’s been first at Cecil Burch two years running, picked up a win at Late Season Warrior in 2017.  Three time qualifier, two time All-Stater.

  • Abbigail Kiaunis, Reed City

As with Atchison, ran out of her mind to qualify last year.  19:14 while her season best had been a minute higher.  Showed some major potential with her 1600 time, she has the highest chance of breaking into Hart’s sweep.

BOYS

Reg20bt

Reg20bi

The boys side is concentrated into two battles.  Hart vs. Benzie for the champ and Pine River, Manistee, McBain for third place.  As always, it’ll come down to everyone on the team, but especially those in the middle of the pack.

Hart

  • Rank: 6

Don’t overlook Hart’s boys squad.  They didn’t have any Ackleys walking through those doors (but now they do) and were still able to finish top-10 the past two years.

  • Highest rated: Alex Enns

A bit of assuming here, but Alex’s track season was cut short.  My guess would be injury, but it was early enough that he’ll hopefully get in some summer training.  We’ve seen what he can do when healthy, 11th at State last year and multiple times in the 16’s.  Defending regional champ.

  • Career achievement/improvement: Hunter Tubbs

Three years in the Hart program, three years of running at State Finals.  Another top-100 finish last year for Hunter and the second straight year under 17.

  • Darkhorse: Clayton Ackley

I think we’ve learned to expect great things from this family.  Clayton ran 11:20 on the XC course last fall, 5:09/11:18 in track.

Benzie Central

  • Rank: 5

Benzie has a little better overall rating, but a little less depth than Hart.  They’re a senior-laden team, that group finished 15th last year, but they have what might be the best addition in the country.  That addition has the potential begin a new regional championship streak at Benzie, they had previously won 6 straight, from 2011 to 2016.

  • Highest rated: Hunter Jones

As an 8th grader, ran 2:09/4:32/9:34.  Best 3200m time of any middle schooler in the country last year.  Hard to find middle school national records, looked at the USATF JO records for 13/14 year olds.  The best 3000 run there was a 9:08, Jones’s pace would put him at 8:58.

  • Career achievement/improvement: Wesley VanPoortfliet

Wesley dropped 1:30 from his freshman to sophomore year.  That sophomore year saw him come on strong at the end of October, 17:43 at Manistee National and 17:20 here.

  • Darkhorse: Connor Mclaren

Connor has always been solid at the 4/8, it’s translated to XC in some races, but not all.  He made another jump this year, dropping down to 2:03.  If he brings more consistency to the table, Benzie has a real shot of winning here.

Leroy Pine River

  • Rank: N/R

Pine River isn’t a team you’d traditionally count on to be here.  But they’re young, have a nice little pack, and a few of their athletes had nice track seasons.

  • Highest rated: Jayce Methner

Jayce ran 17:49 last year and finished 42nd here.  In track, he was able to run 10:40 for the second straight year.

  • Career achievement/improvement: Kaden Darrow

Kaden made quite a leap from his 9th to 10th grade year, dropping down from the 22’s to the 19’s.  He continued that progression last year and was able to run 5:09 in track.

  • Darkhorse: Phil Rigling

Another case of my assumptions.  Phil’s track season ended shortly after he ran a 2:17 in late March.  Once again, if he’s healthy enough to partake in summer training, watch out, as a freshman he was able to run in the 18’s at the end of the year.

Others to Watch

  • Connor Murphy, McBain

In Connor’s first year of XC, he managed to run 16:25 and finish 6th here.  He flashed some 1600m ability, hitting multiple 4:4x performances throughout the season.

  • Ransom Hoeflinger, Manistee

Ransom dropped nearly a minute from his freshman year PR.  Perhaps the most impressive of that year to year improvement was a 21:06 at 2017’s Pete Moss to a 17:28 last September.

  • Aiden McLaughlin, Morley-Stanwood

The question is, how much does an 800 translate?  Aiden has been decent at XC, not spectacular, but running 1:55.1 is spectacular.  That 800 netted him a 1st place finish at State Finals and definitely makes one think he can spend some time in the 15s in a few months.
Uncategorized

How are Speed Ratings Calculated?

Curious runners/coaches/parents have been piling on the questions lately, one of which has been on repeat, how are these dang numbers calculated?

I’m putting regional previews on hold for a few days (26 is next) to go over my process.

First, a little background:

What are speed ratings?

Speed ratings are derived from horse racing.  In the 1970’s, Beyer Speed Figures were created to compare horses across the country.  Horse racing has some similarities to cross country.  Horses race in varying weather, track surfaces, and race distances.  Cross country runners race in varying weather and surfaces, but also not every course is measured exactly to 5 kilometers.  There might be wheel slippage, there might be rounded turns, there might be a missing cone here or there.

In essence, speed ratings are a figure to see how fast an athlete ran on that course on that day.  Then they are used to compare against other runners on other courses/other days.

When can we use speed ratings?

They can be used year-round.  During the season, an athlete can judge themselves week to week.  They can judge how they compare against other athletes.  A coach can look to see if there’s week to week improvement, or in the off-season, take a second look at how an athlete responded to training.  College coaches can hopefully use these in accordance with track times to find recruits that wouldn’t normally be on one’s radar.

Where can we use speed ratings?

Preferably in your free time.  Don’t browse this site at school.

How are speed ratings calculated?

It’s all about that baseline.

For last year, I used MIS.  This year, I’m working to find a meet (or more, will expand on that later) that will work as a baseline.  The baseline determines the differential between races.

One of my projects this summer is to find meets that will make a good baseline.  One of them that’s looking like a contender (on the boys side) is Bath.  Why Bath?  It’s second week in September, so many meets are within a few weeks time.  Of the 734 boys finishers, 132 ran at MIS, and the average difference in rating between those 132 was 0.6 rating points.  It was an accurate predictor of how athletes ran at the end of the year and it’s one of the higher sample sizes you’ll find.

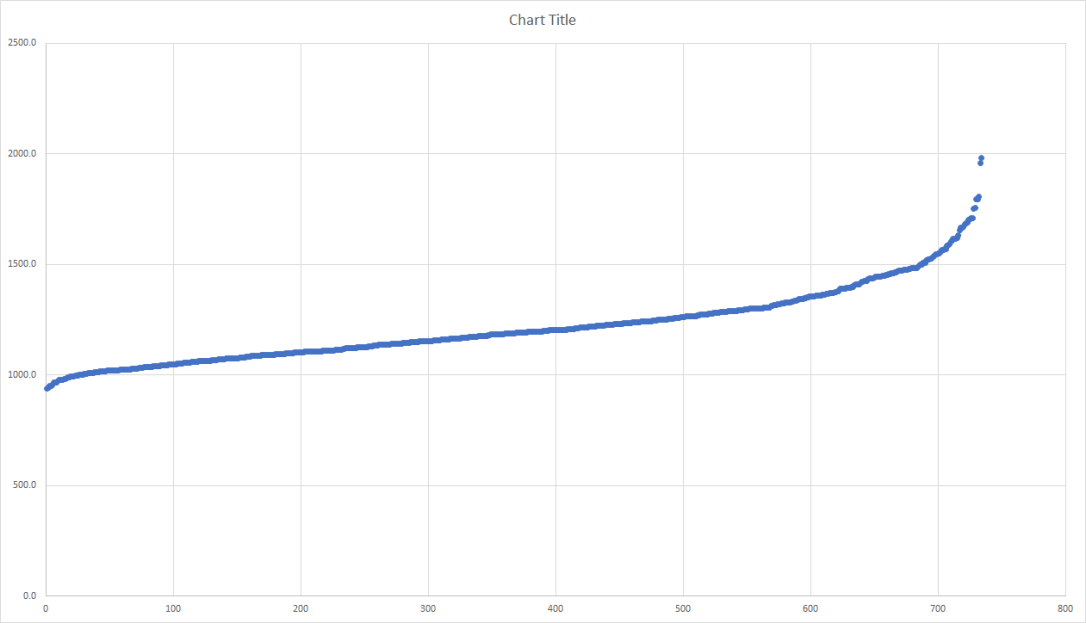
When you list all the race times (in seconds) from Bath, you come up with this graph:

bathboys1

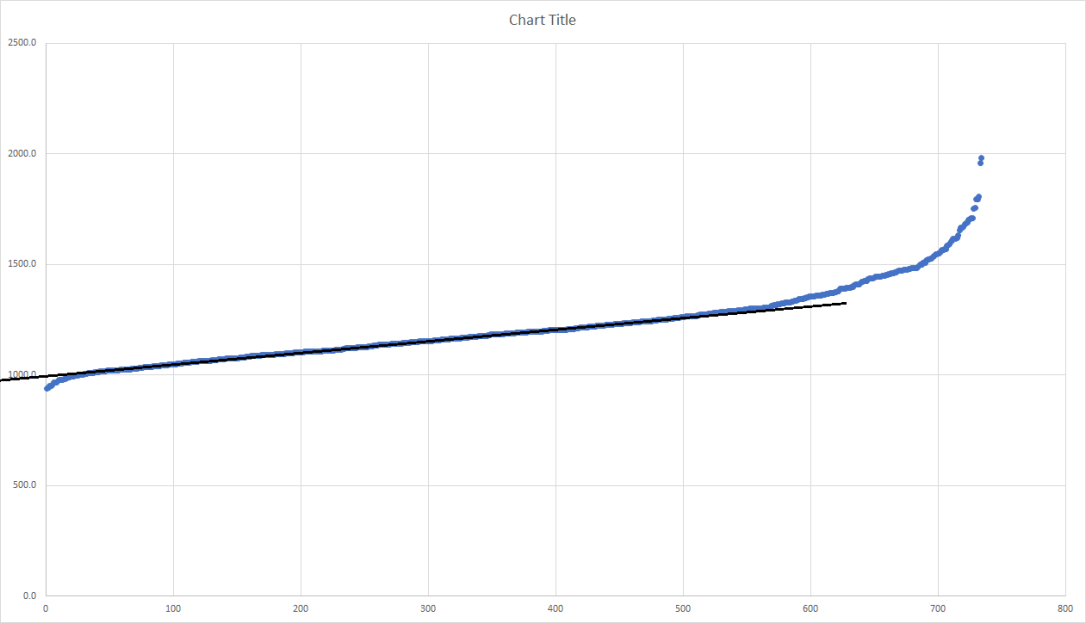
Seconds are listed on the y-axis, faster times are on the left, slower on the right.  In meets, especially those with a larger sample, you’ll get a curve of a similar shape.  The straight line in the middle are your “average” runners (in this case running between 17:30 and 20:00).  Using that straight line, we determine the best fit using our eyes, and find the y-intercept of that line.

bathboys2

On this graph, I’ve determined that to be 1004 seconds.

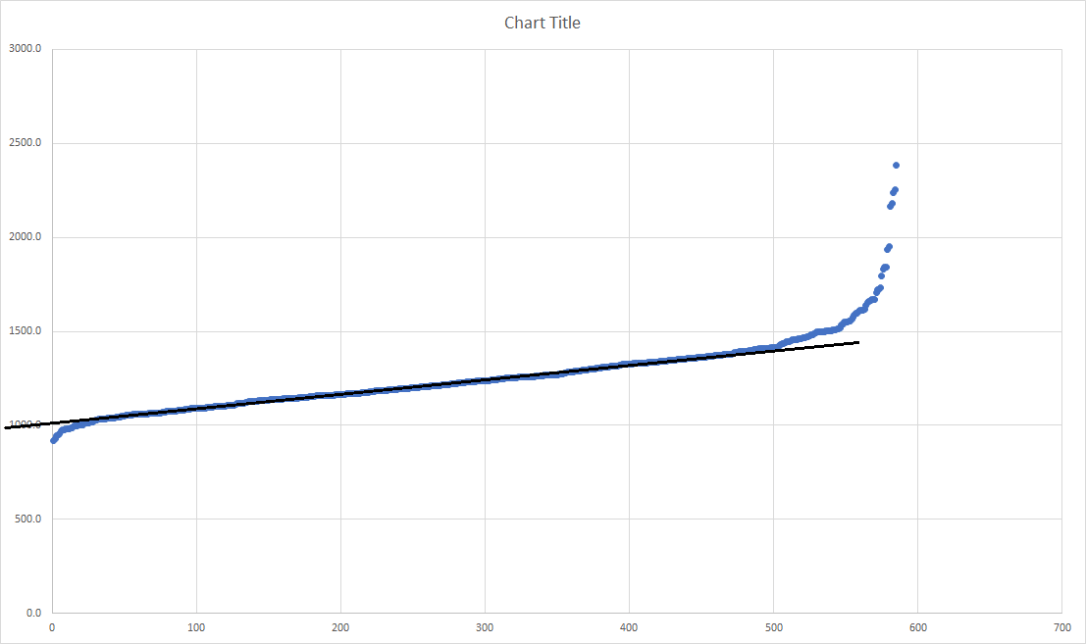
Ann Arbor Running Company’s Early Bird is a meet a few weeks prior with a similar amount of runners.  Here’s the graph from that race:

a2eb1

I’ve determined the y-intercept to be at 1013 seconds.  The baseline of Bath was 1004 seconds, so A2EB (2018) is 9 seconds slower than Bath (2018).  For last year’s ratings, I had Bath as being 12 seconds slower than a typical, non-muddy MIS.  So if Bath is used as a baseline, the differential between A2EB and MIS (on a normal day where they cut the grass) would be 21 seconds.

All that is great, what do the actual numbers mean?

Nick Foster ran 15:17.9 at A2EB.  The formula being used is:

((1560 – (time in seconds – course differential))/3

(1560 – (917.9 – 21))/3 = 221.0

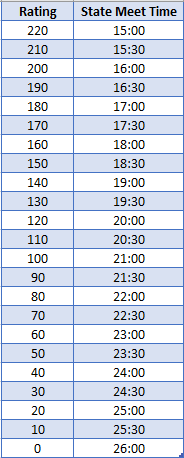
Eventually, I’ll figure out how to put a calculator that converts ratings to potential State Meet race times, but as for now, use this chart:

RatingStateMeet

Each rating point is worth 3 seconds.  Those 132 runners that ran at Bath and States, they were 0.6 rating points, or 1.8 seconds apart.

What are you working on this summer?

My primary goal is to get people talking about cross country year round.  To get kids to realize their potential or to prove my projections wrong, that they’ll outperform what my previews state.  To lighten the load on coaches as well as they scout those in their region.  And maybe, if these previews are accurate, find a way to get in that room where they select regions.

Behind the scenes, I’m trying to find the best baselines.  Bath is a great start, but there are plenty of meets with less participants and a slower average field.  I can’t just rate the big meets.  I’m looking to find invitationals that have less runners and a variation of strength within those runners.  ‘

I cannot predict how the differentials will turn out, but I can give a good guess based on an initial look at the times.  Two of the factors I’m looking at are the amount of “average runners” in relation to the size of the field and the average strength of the field.  If I can compare meets that have similar ratios of average runners or similar abilities, that will hopefully be more accurate than potentially comparing the OAA Red vs. the Ski Valley Conference.  Field size is a factor as well.

Before the season begins, I’ll report back on which baselines will be used.  They’ll all be from the 2018 season.

YOUR PROJECTIONS HAVE ME TOO LOW

That’s fine, they’re just projections.  I cannot predict how much work you’ll put in.  I cannot change what you ran last year.  There are so many factors that go into a change in times from early November to early August.  I cannot list them all or even begin to try.  Luckily, the projections WILL NOT MATTER when the season (it can’t come soon enough) begins.

Last winter, I looked into the average improvement made by each runner that competed in both 2017 and 2018.  I expected to see a pretty graph that showed slower runners improving a slightly higher rate than faster runners, freshmen improving at a higher rate than juniors.  Instead, it was all a bunch of noise.  Many improvements high and low, some downfalls, all in all highly variant.

That stunk, so the backup plan was to place runners into segments.  For example, 9th grade boys that were rated between 180-185 improved by 6.1 rating points.  So if you’re a Max Sharnas and were rated 181.4 as a freshman, your projected rating is 187.5

But that’s not all!  Track has to play a role.  Track times have a correlation with XC success.  By comparing track times with XC ratings the past two years, I came up with some rough formulas that attempt to equate those track times to ratings.  For the 3200m, that was 490 – (time in seconds/2).

Let’s take Adam Jesse’s 9:29.73, that equates to a 205.1.  His projected improvement only had him at 201.8.  Is he a 205.1 or 201.8?  They’re both distance running, but a 5k is a different beast and we’re not rating for track courses, so XC gets a larger weight.  He ended up at 203.1.  It might not seem like much, only 10 seconds between those two spots, but I have 10 runners occupying those 10 seconds.

Hope this explains the numbers and calculations!


Uncategorized

An Early Look: Region 1

Well, I got started with typing up this preview, then my laptop just stopped working.  So here we are, a few hours later, new laptop in tow.

GIRLS

Reg1GTUpdated

Reg1GIUpdated

On the girls side, this is a pretty fair region.  You have one top team, three other good teams, and a few outstanding individuals.

The original version of this post didn’t include Forest Hills Northern.  Not sure where I messed up, but here they are.  What they’ve really got going for them is their 1-5 spread.  Freshman Alli Cornell should really contribute as a front-runner, as she was in the 12’s for much of middle school XC.

Traverse City Central is a steady power in our northwest corner of the state.  Sitting in that gym pre-Bayshore, you can see their dominance across all sports, championship banners abound.  Julia Flynn has already been profiled.  What makes them great is their depth, as is usually the case with top teams.  Even those on that 20 min. bubble seem to improve, examples being Alison Hankins, who dropped her PR from 20:08 to 19:14 and Ellen Gerhard, who dropped hers from 21:01 to 19:48.

Traverse City West’s Hannah Smith should be right in the mix for All-State again this year.  She’s finished 26th and 23rd the past two years.  She didn’t as well in track as past seasons, but even at the level she ran, she should still be near that top 30.  Elliott Smith put together a solid season in middle-distance, going 2:27/5:17, capitalizing on a freshman year where she was able to break 19.

Rockford obviously loses VanderLende, but don’t forget the contributions of Everhart-Deckard.  A darkhorse candidate to break their top 7 might be Hailey Fike.  She dropped nearly 3.5 minutes over the course of last season and ran 5:44 in track.  Other contributors who have shown steady progression include Elizabeth Bennett, Bailey Ewen, and Lexie Allshouse.

If they could only find some depth, GR Ottawa Hills would be right in contention.

Nicole Marco had a massive PR in the 1600 this spring, dropping from 5:24 to 5:08.  Hopefully that will extend into XC, as this would be her first state appearance.

Jocelyn Hendricks narrowly missed out on All-State last year.  No track results that I can find, but if she keeps on the same path, she’ll be making it to MIS for the 3rd straight year.

BOYS

Reg1BT

Reg1BI

On the boys side, it’s a little tighter 2-4.

Cedar Springs would undoubtedly be a contender in Division 2, but they’ve moved up.  They have enough depth and front-running to make it to the top 10, quite possibly higher.  Corey Bowers has already been profiled, I should note that he split 1:54 in a relay at States.  He’s followed by three seniors who should provide some consistency in Gavin Braciak, Dilan Sargent, and Jaydon Moleski.

It really comes down to those 4th-7th runners for teams such as Lowell, Rockford, and Traverse City Central.  I have TCC and Lowell ranked in the top 25, but Rockford’s quality depth may spurt them ahead.  Kyle Sweeney hit 17:16 last fall, then followed that up with a 10:22.  Lowell’s Cole Weston is a similar case, running 17:23 and then 10:23, a rising sophomore as well.

Traverse City Central does have a low stick in Cole Truszkowski.  He’s shown improvement the past three years in the fall, almost breaking 16.  On the track, he was able to get 14th in the 1600 with a 4:21.

In order to make it out as an individual, one will probably have to be around 16:45 for a majority of the season, at least on faster courses.  Many kids that I have into the 20’s here have broken 17 before.  Two sophomores I’d watch for are Klay Grant and Isaac Stone, both able to break into those 10:20’s in track.  Two others that made major leaps are Brett Schlaff, dropping his 3200m PR by 0:38 and Josiah Frazier, a 0:48 drop.

Finally, how does Ottawa Hills acquire this talent?  They have NO distance results in track from anyone other than Juan David Hernandez.  Their XC roster for this fall has one other runner.  Normally, people will improve (yes, there are other ways) by chasing others in their training group.  The guy ran 2:06/4:35/9:59/16:15 as a freshman.  Literally by himself.  Unbelievable stuff.