
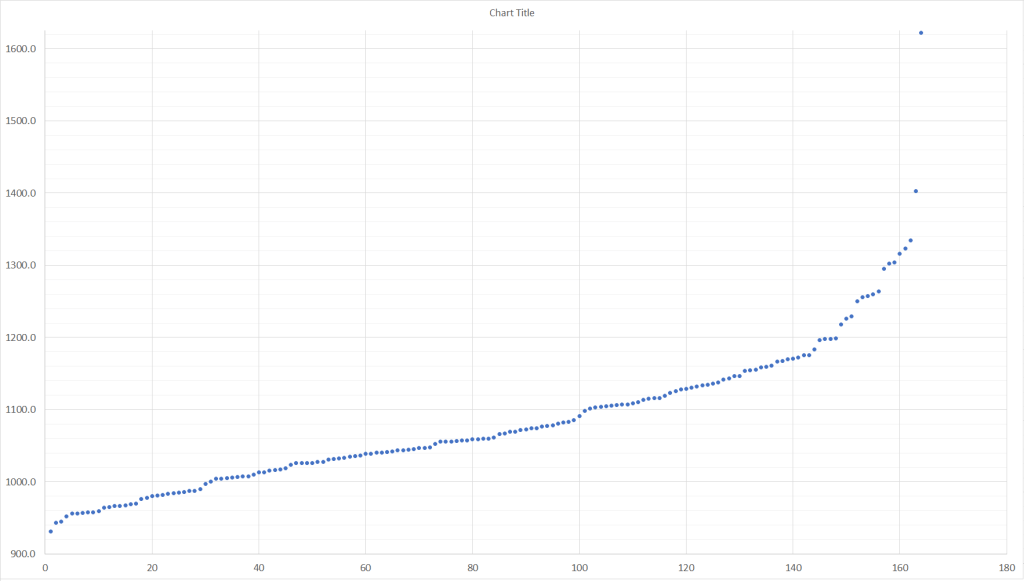
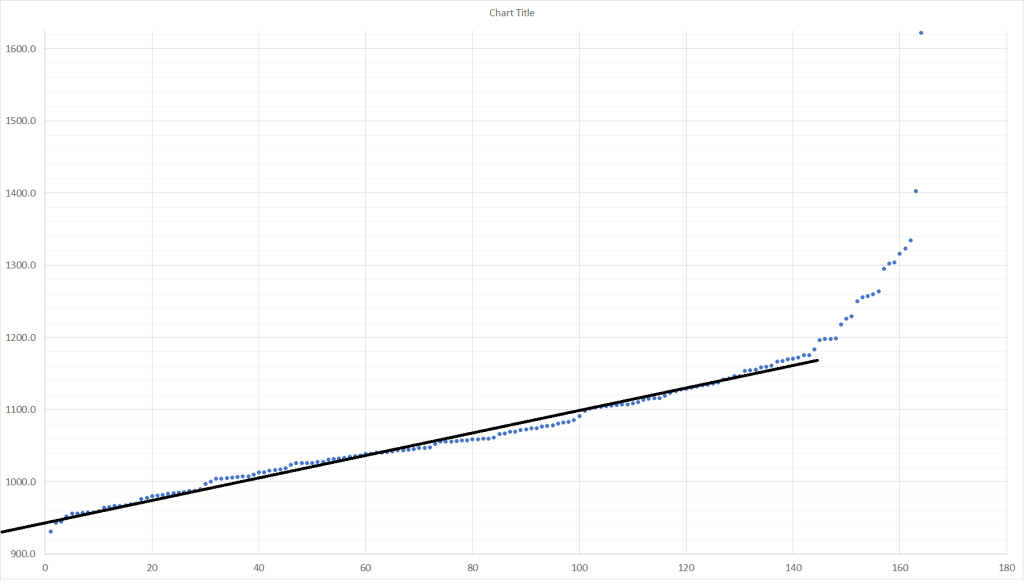
Above are the graphs from the Boys MITCA race this past weekend. The line hits the y-intercept at 943, so the adjustment is 54 seconds faster than AF2018.
So for Brendan Favazza, the formula is:
(1560-(931.1+54))/3 = 191.6
He won the race, one loaded with all-state talent. THIS DOESN’T MAKE ANY SENSE. IT SHOULD BE HIGHER.
Here is the problem with the graphing method. It assumes that the field you’re comparing is equal.
Allendale Falcon is a pretty fair representation of an invitational. MITCA is not. Neither are States or Regionals. The faster runners are competing and many below our top sevens are not. The line for these races ends up trending towards too low of a number.
That’s where I use REFERENCE RUNNERS.
This late in the year, there are 35,000+ performances from either boys or girls, on average of about 6-7 rated races per runner. There is a built in expectation of one’s rating, and that’s what I used to determine the adjustment for MITCA.
| Name | MITCA Time | Unadjusted Rating | Name | 2019 Rating | Difference |
| Aidan Hollandsworth | 19:35.2 | 128.3 | Aidan Hollandsworth | 162.9 | -34.6 |
| Akshay Reddy | 16:44.3 | 185.2 | Akshay Reddy | 194.4 | -9.1 |
| Alan Atkinsmith | 17:37.0 | 167.7 | Alan Atkinsmith | 169.4 | -1.7 |
| Alex Lawhorne | 20:18.1 | 114.0 | Alex Lawhorne | 135.5 | -21.5 |
| Alex Mathews | 19:14.9 | 135.0 | Alex Mathews | 151.2 | -16.2 |
| Andrew Daniels | 19:13.7 | 135.4 | Andrew Daniels | 140.6 | -5.2 |
| Andrew Grier | 19:43.5 | 125.5 | Andrew Grier | 117.8 | 7.7 |
| Andrew Lane | 15:56.1 | 201.3 | Andrew Lane | 204.5 | -3.2 |
| Andrew Nolan | 15:44.7 | 205.1 | Andrew Nolan | 207.5 | -2.4 |
| Andrew Sesti | 16:20.9 | 193.0 | Andrew Sesti | 194.9 | -1.9 |
| Armaan Lehal | 21:56.1 | 81.3 | Armaan Lehal | 98.8 | -17.5 |
| Austin Aldrich | 19:06.8 | 137.7 | Austin Aldrich | 159.3 | -21.6 |
| Austin Smelker | 17:51.8 | 162.7 | Austin Smelker | 173.2 | -10.4 |
| Bo Anderson | 18:48.8 | 143.7 | Bo Anderson | 151.9 | -8.1 |
| Braxton Shutko | 19:03.7 | 138.8 | Braxton Shutko | 147.5 | -8.7 |
| Brendan Favazza | 15:31.1 | 209.6 | Brendan Favazza | 216.7 | -7.1 |
| Brenden Schroeder | 17:58.3 | 160.6 | Brenden Schroeder | 176.6 | -16.0 |
| Brenden Wallace | 20:59.6 | 100.1 | Brenden Wallace | 118.0 | -17.9 |
| Bryce Brown | 17:07.6 | 177.5 | Bryce Brown | 178.3 | -0.8 |
| Bryce Mathews | 18:53.9 | 142.0 | Bryce Mathews | 142.8 | -0.7 |
Here, I am determining how much slower Shepherd ran compared to the average rating. I had 143 matches, showing Shepherd was 7.9 rating points slower than the average rating.
But as with the graphing method, I want to eliminate outliers. Taking the average of the data points between the two lines, Shepherd ran 7.3 points (or 22 seconds slower) than the average rating.
So again, for Favazza:
(1560-(931.1-22))/3 = 217.0
Personally, I prefer using the graphing method first, especially in larger fields. We’re blessed here to have large meets opening the season, such as your Ann Arbor Early Bird, Pete Moss, Corunna, Portage Early Bird, or Under the Lights. Those help set a standard for using reference runners to begin the season. For the record, reference runners were the primary method used for Regionals and State.

7 thoughts on “MITCA: Where the Graphing Method Goes Wrong”