
Okay, they matter. But not how you think they do.

Came across this tweet the other day and it hit me pretty hard. Although I’ve posted a few times my methodology, it sometimes feels the word isn’t getting across. Which is 100% my fault, not that I’m seeking sympathy, but just giving myself an honest appraisal. I can explain it to myself in my head and in person to others, but usually in a convoluted ramble.
I’ll go into why times DO NOT matter but they really do kind of matter in a bit, but first a reminder of how ratings are created:

X axis = number of runners
Y axis = time (in seconds)
On my summer post, I mentioned how I was looking for a baseline. It wasn’t a Eureka! moment, but Allendale Falcon 2018 seemed to fit the bill. In comparison between that race and MIS 2018, the difference between the two ratings was very minimal (on both boys & girls), stdev of that difference also low.
AF 2018 was the baseline for races this year. It may be the baseline for races next year. Other reasons I like it are that it’s in the middle of the season, reasonably healthy competition, and has a large sample of runners.
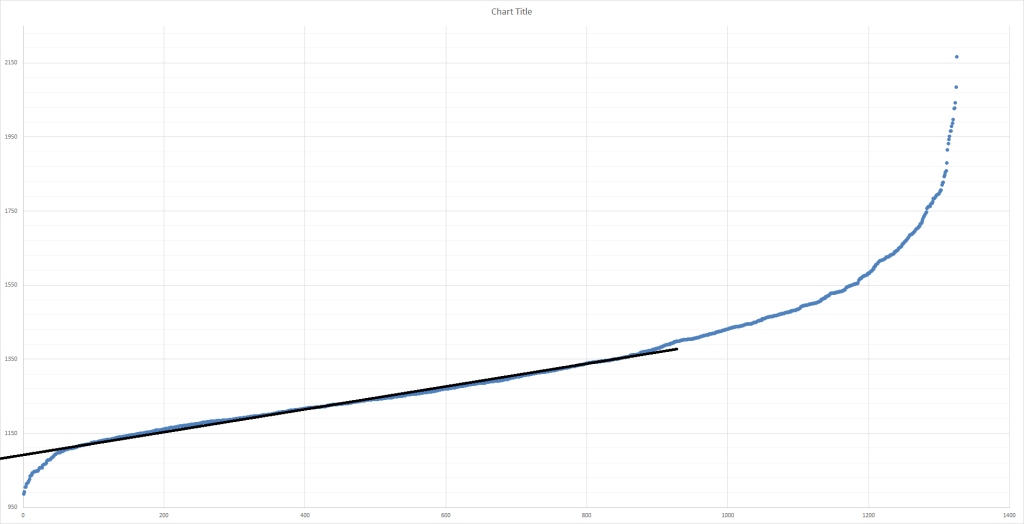
That large sample helps smooth out the graph. The graph is an S-curve, which you’ll get in almost all races. Extend that out to almost 500 runners, it gives you some pretty identifiable patterns. I drew a line through the mid-section of runners. Why the mid-section? These are your “average” runners, and with a greater number/less variability between “average” runners, one can begin to make an assumption between the difference between two races.
That line hits the Y-intercept at 997 seconds. Invitationals of a decent size (>150) and of comparable quality can then rated against this.
Here’s the graph from Holly this year:

Holly’s line hits the Y-intercept at 1031 seconds. The difference between the two is 34 seconds, and that is the course adjustment FOR THAT DAY. There are some drawbacks to merging races across a day, but I’m strapped for time as is, so that’s what we’re going with for now.
So, Carter Solomon ran 15:26.3 at Holly.
15:26.3 = 926.3
The formula for ratings calculation is: (1560 minus (time minus adjustment))/3
(1560-(926.3-34))/3 = 222.6
You may notice his rating this year was 221.6. AF2018 was listed in 2018 as 3 seconds faster than the baseline that year. I decided to try to keep the numbers consistent through the years, so the formula for Solomon’s race was actually (1560-(926.3-31))/3 = 221.6
TIMES DO NOT MATTER
Let’s say someone missed a turn at Holly and led everyone on a path to make the course 300m long. Every single runner in the boys races added exactly a minute to their time. Carter Solomon runs 16:26.3 in this example. Here’s the graph:
The line hits the Y-intercept at 1091 seconds. 1091-997 = 94. With the 3 second adjustment, then the difference is 91 seconds.
16:26.3 = 986.3
(1560-(986.3-91))/3 = 221.6
You can repeat this exercise for adding 10 minutes, 3 hours, subtracting 5 minutes.
A runner’s individual time, independent of everything else DOES NOT MATTER.
But you said time does matter. Yes, it does. The time it takes a runner to finish a course in and of itself doesn’t. The time it takes a runner to finish a course compared to other runners on that same course the same day does matter. For every runner in every race ever run, there is a time differential between that runner and every other runner in the race (this is the reason you can still make ratings if you start the clock when the first runner crosses the line – it would just be in a different format).
Comparing runners against one another
| Athlete | Team | Holly | Difference (WS vs Others) |
| Peter Baracco | Farmington | 987.8 | -73.9 |
| Adam Hill | Royal Oak | 1006.6 | -55.1 |
| Connor Myatt | Royal Oak | 1077.3 | 15.6 |
| Jakar Dhillon | Bloomfield Hills | 1057.2 | -4.5 |
| Weston Schroeder | Royal Oak | 1061.7 | 0 |
| Ian Dunn | Farmington | 1065.1 | 3.4 |
| Kemp Winkler | Royal Oak | 1046.9 | -14.8 |
| Kevin Miller | Farmington | 1077.9 | 16.2 |
| Bryan Hanes | Royal Oak | 1049.1 | -12.6 |
| Jack Rickle | Royal Oak | 1081.9 | 20.2 |
The chart here shows 10 runners that ran at Holly. Third column is their time in seconds, fourth column is the difference between their time and Weston Schroeder’s time. Adam Hill ran 55.1 seconds faster than Schroeder here.
Now at the OAA White Jamboree the next week:
| Athlete | Team | OAA White 2 | Difference |
| Peter Baracco | Farmington | 1001.5 | -59.5 |
| Adam Hill | Royal Oak | 1009.1 | -51.9 |
| Connor Myatt | Royal Oak | 1046.1 | -14.9 |
| Jakar Dhillon | Bloomfield Hills | 1046.6 | -14.4 |
| Weston Schroeder | Royal Oak | 1061.0 | 0.0 |
| Ian Dunn | Farmington | 1061.2 | 0.2 |
| Kemp Winkler | Royal Oak | 1068.3 | 7.3 |
| Kevin Miller | Farmington | 1069.2 | 8.2 |
| Bryan Hanes | Royal Oak | 1071.6 | 10.6 |
| Jack Rickle | Royal Oak | 1085.3 | 24.3 |
Same format as before, now Adam Hill ran 51.9 seconds faster than Schroeder. Now Adam’s rating would still being higher, having run the faster time. But relative to one another between races, Schroeder would cut the gap between the two.
This is a tiny example of using reference runners. That is a different, yet still viable method of rating. I’ll get into it next week, but I believe around 100 runners ran at Holly and OAA White 2. The average time difference between the two had OAA White 2 around 24 seconds faster than Holly.
SUMMARY (or just a section where I use another source that might explain it better)
I’m stealing this from the Godfather, TullyRunners. Meylan’s explanations are much longer but cover all the bases:


2 thoughts on “Times DO NOT Matter”