
A few notes on these before anyone bites my head off:
- These are for FUN. They are not the end all, be all.
- Currently, there are about 2500 boys and 2000 girls that have ratings this season. In a typical season, there are usually around 7500 runners per gender. Either through not having run a race or having run one that hasn’t been rated, these rankings are not representing the whole state, just the ones I have numbers for.
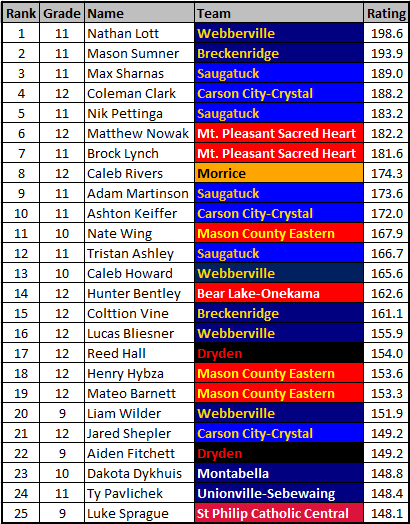
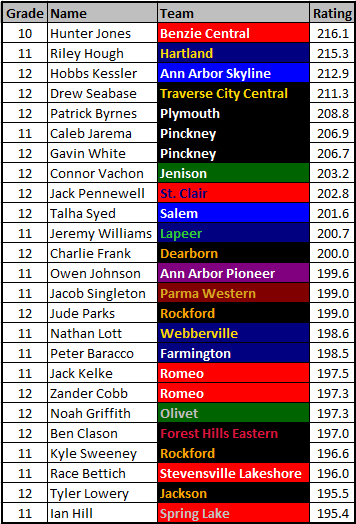
- The individual rankings are based on a weighted average of all races rated. Hobbs Kessler owns the best individual performance thus far, but his dual against Allen Park is lower, resulting in Hunter Jones taking the top spot. This is the method I’ve used for the past 2 years.
- This will likely change. With potentially more races, smart runners won’t “go to the well” every race. I’m considering using the top x% of ratings or top 3-5 races. We’ll see.
- This will likely change. With potentially more races, smart runners won’t “go to the well” every race. I’m considering using the top x% of ratings or top 3-5 races. We’ll see.
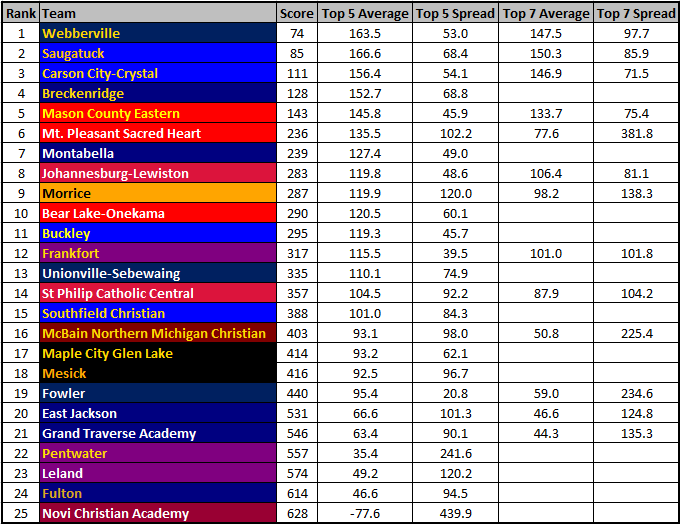
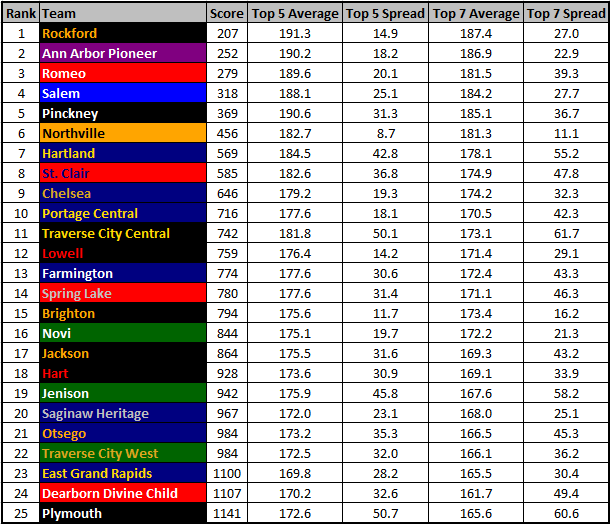
- The team rankings are based on a hypothetical meet.
- Girls will be posted tomorrow.
- I’m planning on writing a post for Thursday detailing the methods I’ve been using this season.
- Here is a list of the races that have been rated and here is a calculator to convert ratings into times (for a fair course later in the year).
- These are for FUN.
Team Rankings
Division 4
Division 3

Division 2

Division 1

Overall
Individual Rankings
Division 4
Division 3

Division 2
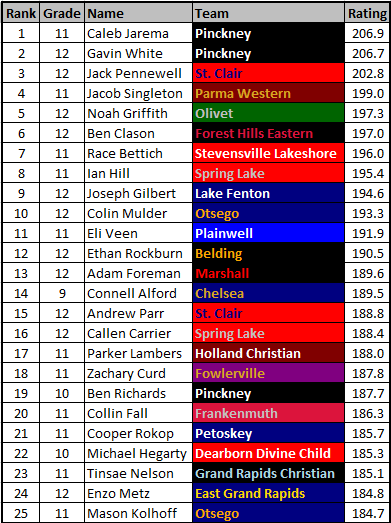
Division 1

Overall

10 thoughts on “Boys Labor Day Rankings”