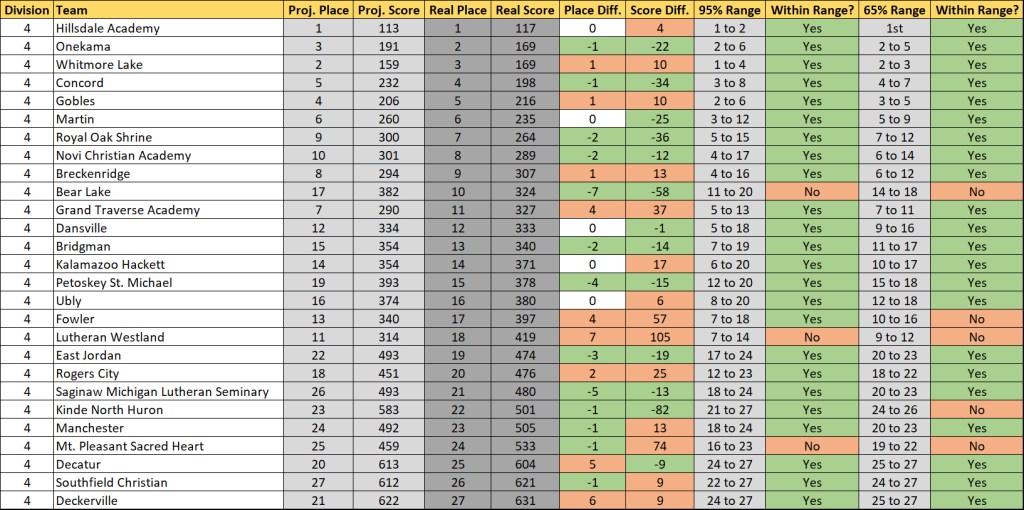
Before I get deep into analysis, highlighting the many deserving kids and teams from yesterday, some charts that show who proved the projections wrong.
In the More Predictions and Expected Outcomes post from Saturday, I outlined just how many projections I’d look to be “right” based on their percentages.
For the team champions, that was 6.63 teams. In reality, 5 teams were correct. Meh performance from MIXC.
For the podium teams, expectation was to be correct on 12.8 teams. In reality, 10 teams were correct. Another ho-hum performance from MIXC.
For the top-10 teams, I wanted to be right on 70 teams. The projections nailed 71 teams. This is pretty good!
The projected ranges bring in anything but the outliers, the middle 95% and 65% of the places a team could get. The expectation is then that those would be correct on 95% and 65% of the teams. They were correct on 91.4% of the teams and 70% of the teams. Not the greatest, but okay.
You can also track the average place difference between the projections and reality. That was 2.27 places this year. Much lower than anything pre-2024, but not as accurate as the previous two years.
Overall, I’d give the projections a B- (which was kinda like my grades!). If the projections were completely accurate on everything ever, there’d be so few stories, teams, and individuals to highlight. I’m always motivated too, looking to return to 2025 levels. So you’re stuck with me for another year.
With MITCA on the horizon and much time spent there, more writeups will come in future weeks. We’ll hopefully see you in Shepherd on Saturday.
Division 1 Boys
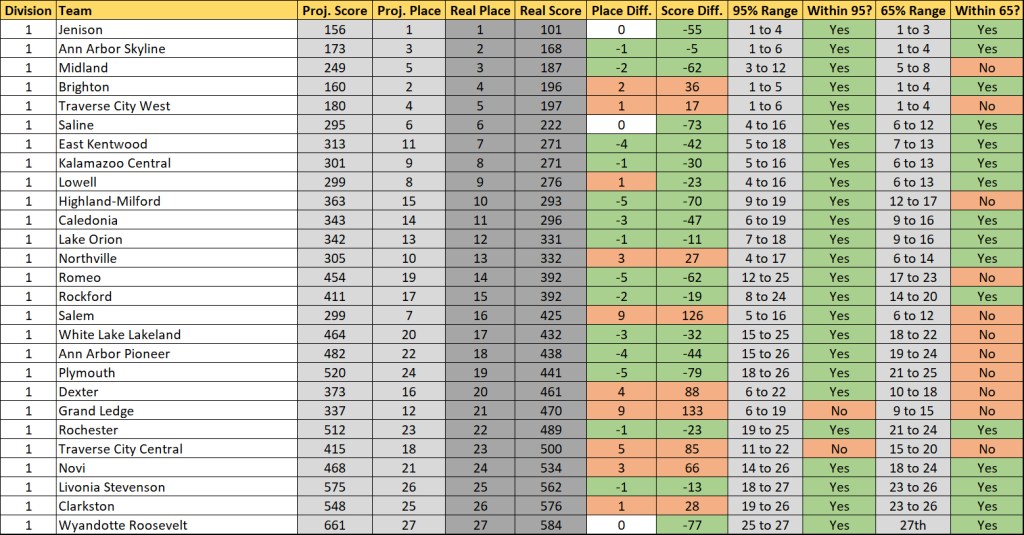
Division 2 Boys
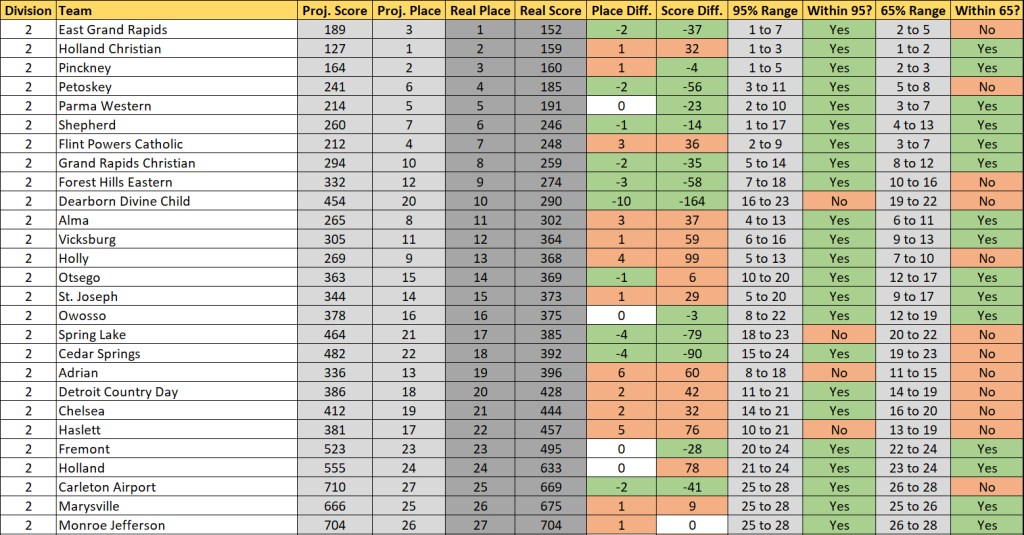
Division 3 Boys
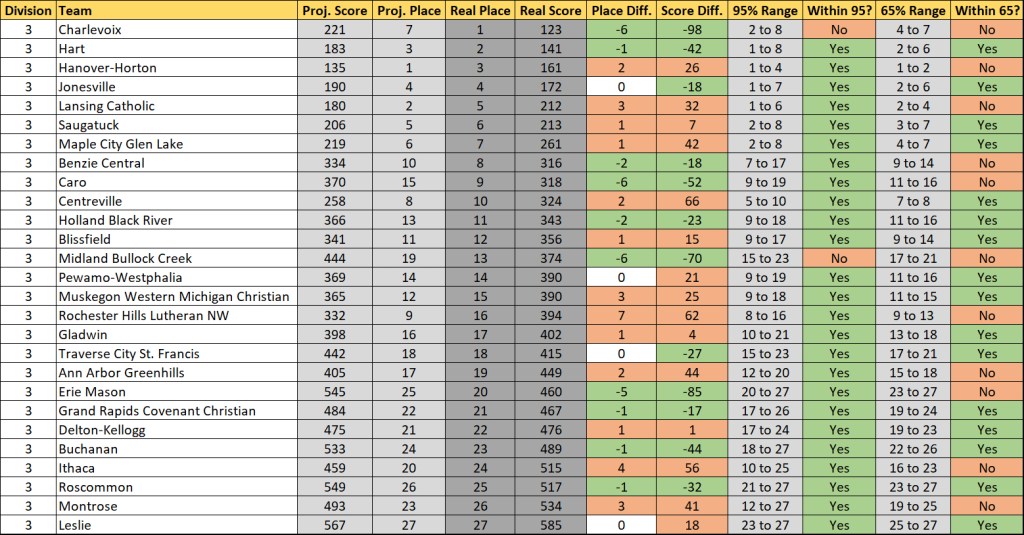
Division 4 Boys
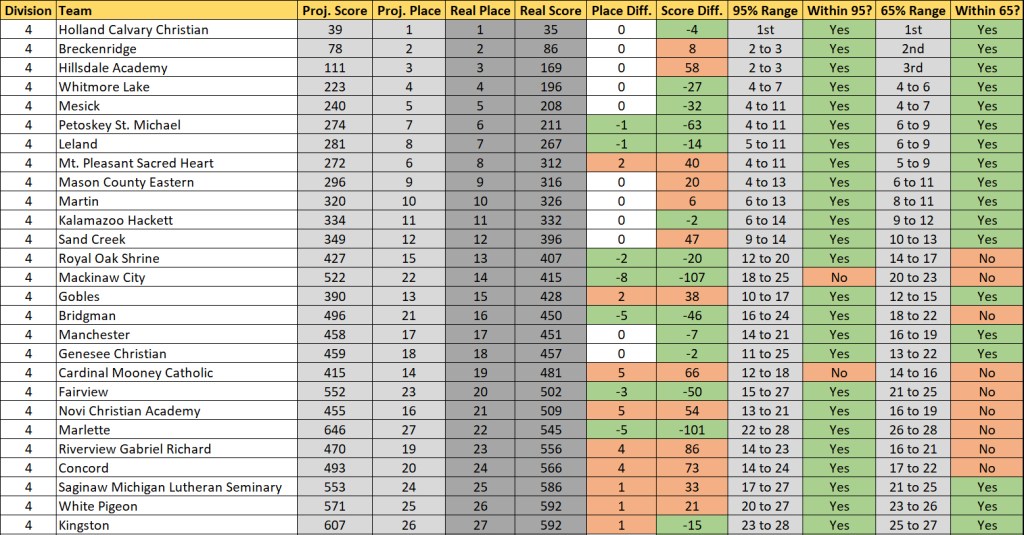
Division 1 Girls
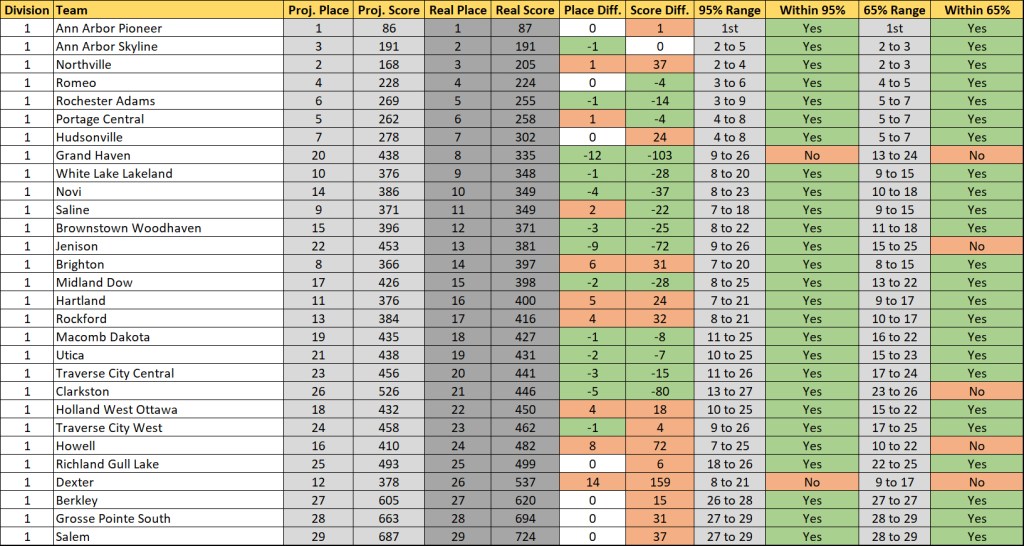
Division 2 Girls
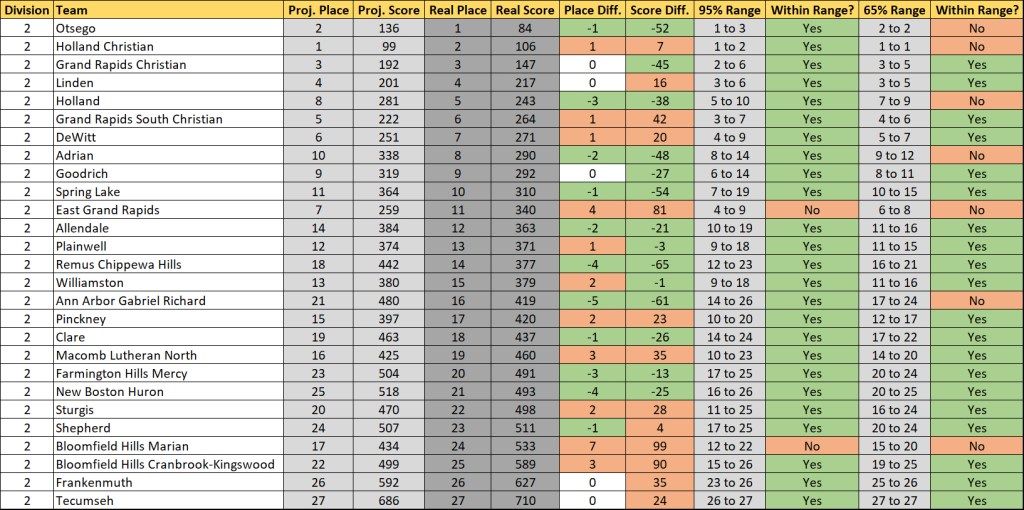
Division 3 Girls
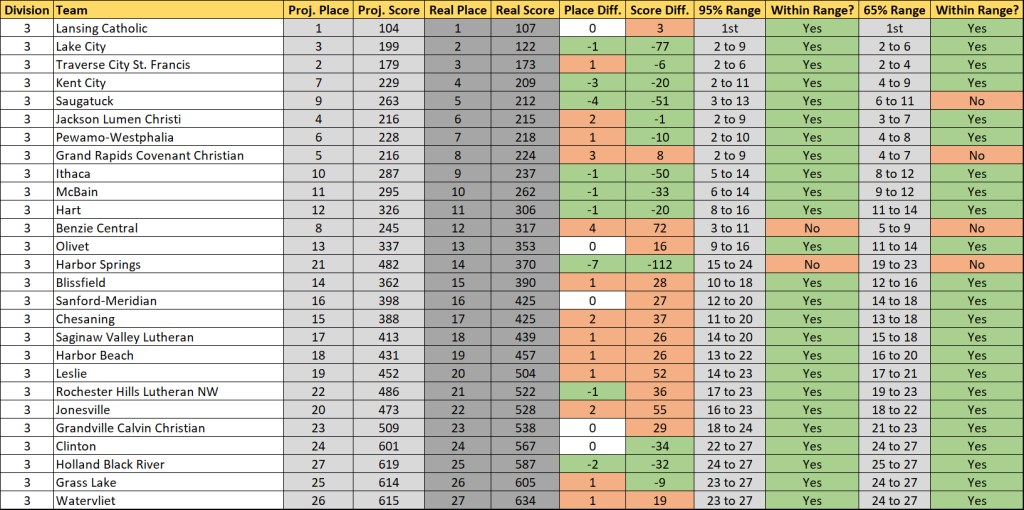
Division 4 Girls