Blog

Uncategorized

How are Speed Ratings Calculated?

Curious runners/coaches/parents have been piling on the questions lately, one of which has been on repeat, how are these dang numbers calculated?

I’m putting regional previews on hold for a few days (26 is next) to go over my process.

First, a little background:

What are speed ratings?

Speed ratings are derived from horse racing.  In the 1970’s, Beyer Speed Figures were created to compare horses across the country.  Horse racing has some similarities to cross country.  Horses race in varying weather, track surfaces, and race distances.  Cross country runners race in varying weather and surfaces, but also not every course is measured exactly to 5 kilometers.  There might be wheel slippage, there might be rounded turns, there might be a missing cone here or there.

In essence, speed ratings are a figure to see how fast an athlete ran on that course on that day.  Then they are used to compare against other runners on other courses/other days.

When can we use speed ratings?

They can be used year-round.  During the season, an athlete can judge themselves week to week.  They can judge how they compare against other athletes.  A coach can look to see if there’s week to week improvement, or in the off-season, take a second look at how an athlete responded to training.  College coaches can hopefully use these in accordance with track times to find recruits that wouldn’t normally be on one’s radar.

Where can we use speed ratings?

Preferably in your free time.  Don’t browse this site at school.

How are speed ratings calculated?

It’s all about that baseline.

For last year, I used MIS.  This year, I’m working to find a meet (or more, will expand on that later) that will work as a baseline.  The baseline determines the differential between races.

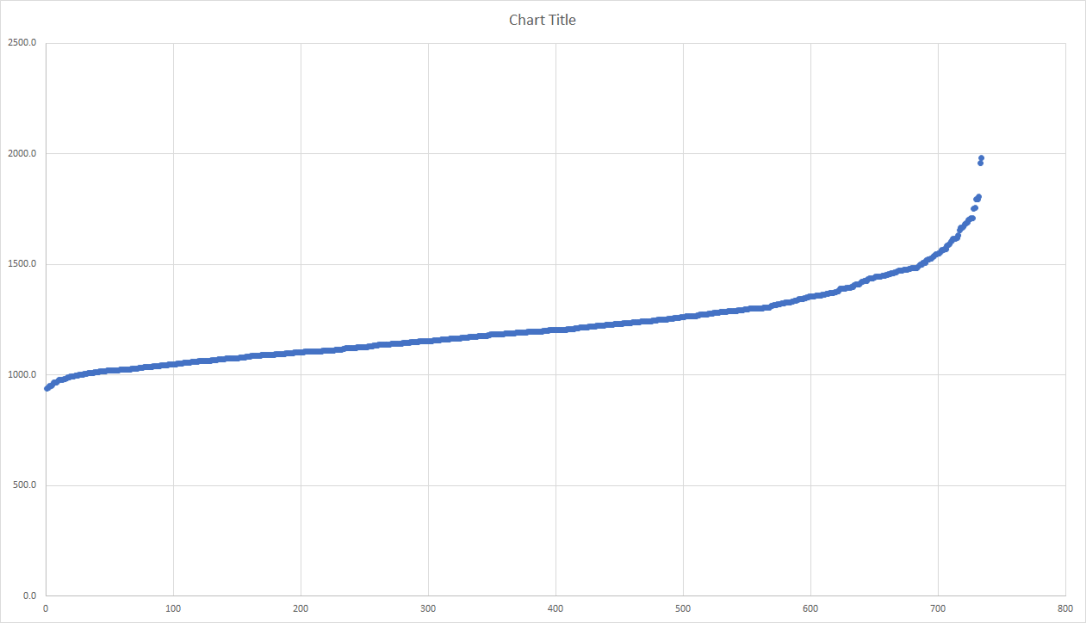
One of my projects this summer is to find meets that will make a good baseline.  One of them that’s looking like a contender (on the boys side) is Bath.  Why Bath?  It’s second week in September, so many meets are within a few weeks time.  Of the 734 boys finishers, 132 ran at MIS, and the average difference in rating between those 132 was 0.6 rating points.  It was an accurate predictor of how athletes ran at the end of the year and it’s one of the higher sample sizes you’ll find.

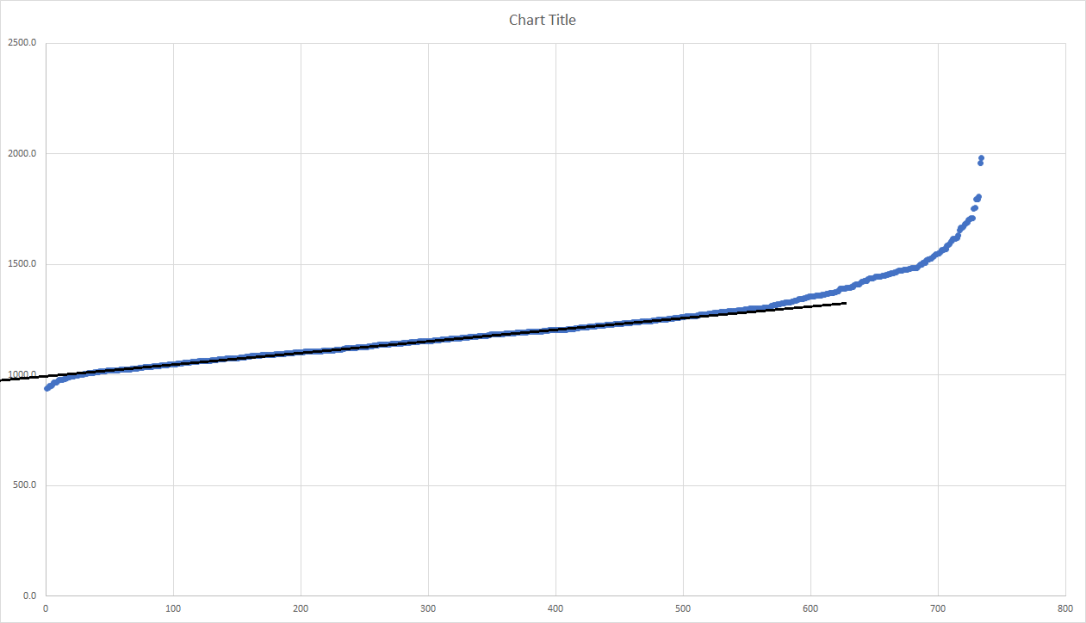
When you list all the race times (in seconds) from Bath, you come up with this graph:
bathboys1

Seconds are listed on the y-axis, faster times are on the left, slower on the right.  In meets, especially those with a larger sample, you’ll get a curve of a similar shape.  The straight line in the middle are your “average” runners (in this case running between 17:30 and 20:00).  Using that straight line, we determine the best fit using our eyes, and find the y-intercept of that line.
bathboys2

On this graph, I’ve determined that to be 1004 seconds.

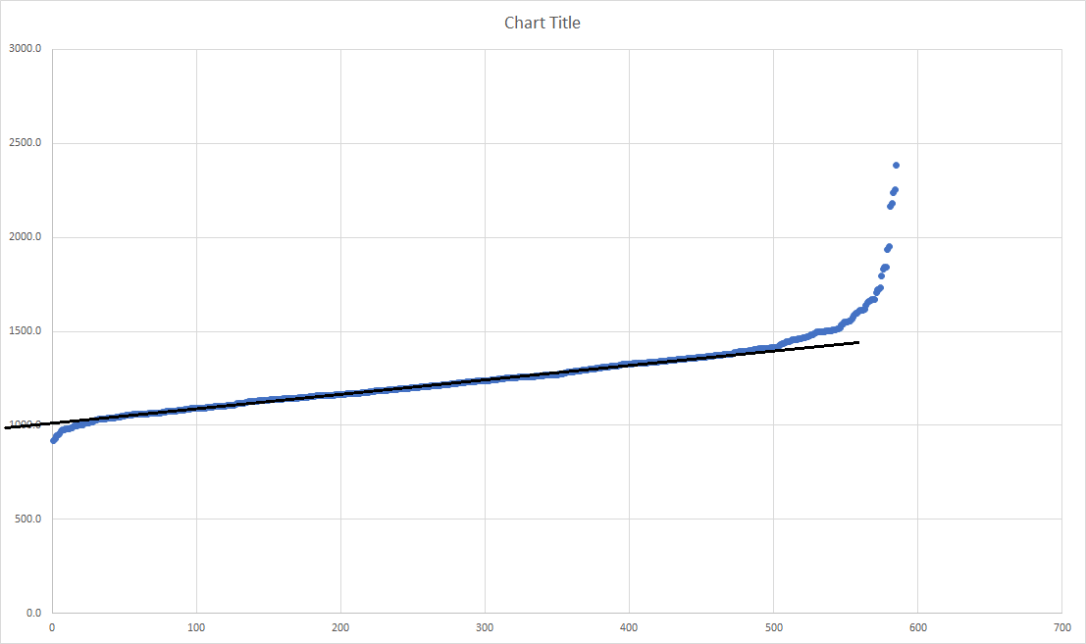
Ann Arbor Running Company’s Early Bird is a meet a few weeks prior with a similar amount of runners.  Here’s the graph from that race:
a2eb1

I’ve determined the y-intercept to be at 1013 seconds.  The baseline of Bath was 1004 seconds, so A2EB (2018) is 9 seconds slower than Bath (2018).  For last year’s ratings, I had Bath as being 12 seconds slower than a typical, non-muddy MIS.  So if Bath is used as a baseline, the differential between A2EB and MIS (on a normal day where they cut the grass) would be 21 seconds.

All that is great, what do the actual numbers mean?

Nick Foster ran 15:17.9 at A2EB.  The formula being used is:

((1560 – (time in seconds – course differential))/3

(1560 – (917.9 – 21))/3 = 221.0

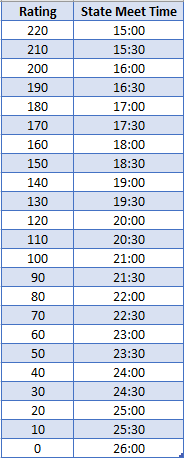
Eventually, I’ll figure out how to put a calculator that converts ratings to potential State Meet race times, but as for now, use this chart:
RatingStateMeet

Each rating point is worth 3 seconds.  Those 132 runners that ran at Bath and States, they were 0.6 rating points, or 1.8 seconds apart.

What are you working on this summer?

My primary goal is to get people talking about cross country year round.  To get kids to realize their potential or to prove my projections wrong, that they’ll outperform what my previews state.  To lighten the load on coaches as well as they scout those in their region.  And maybe, if these previews are accurate, find a way to get in that room where they select regions.

Behind the scenes, I’m trying to find the best baselines.  Bath is a great start, but there are plenty of meets with less participants and a slower average field.  I can’t just rate the big meets.  I’m looking to find invitationals that have less runners and a variation of strength within those runners.  ‘

I cannot predict how the differentials will turn out, but I can give a good guess based on an initial look at the times.  Two of the factors I’m looking at are the amount of “average runners” in relation to the size of the field and the average strength of the field.  If I can compare meets that have similar ratios of average runners or similar abilities, that will hopefully be more accurate than potentially comparing the OAA Red vs. the Ski Valley Conference.  Field size is a factor as well.

Before the season begins, I’ll report back on which baselines will be used.  They’ll all be from the 2018 season.

YOUR PROJECTIONS HAVE ME TOO LOW

That’s fine, they’re just projections.  I cannot predict how much work you’ll put in.  I cannot change what you ran last year.  There are so many factors that go into a change in times from early November to early August.  I cannot list them all or even begin to try.  Luckily, the projections WILL NOT MATTER when the season (it can’t come soon enough) begins.

Last winter, I looked into the average improvement made by each runner that competed in both 2017 and 2018.  I expected to see a pretty graph that showed slower runners improving a slightly higher rate than faster runners, freshmen improving at a higher rate than juniors.  Instead, it was all a bunch of noise.  Many improvements high and low, some downfalls, all in all highly variant.

That stunk, so the backup plan was to place runners into segments.  For example, 9th grade boys that were rated between 180-185 improved by 6.1 rating points.  So if you’re a Max Sharnas and were rated 181.4 as a freshman, your projected rating is 187.5

But that’s not all!  Track has to play a role.  Track times have a correlation with XC success.  By comparing track times with XC ratings the past two years, I came up with some rough formulas that attempt to equate those track times to ratings.  For the 3200m, that was 490 – (time in seconds/2).

Let’s take Adam Jesse’s 9:29.73, that equates to a 205.1.  His projected improvement only had him at 201.8.  Is he a 205.1 or 201.8?  They’re both distance running, but a 5k is a different beast and we’re not rating for track courses, so XC gets a larger weight.  He ended up at 203.1.  It might not seem like much, only 10 seconds between those two spots, but I have 10 runners occupying those 10 seconds.

Hope this explains the numbers and calculations!

 

Regional Previews

An Early Look: Region 2

deltacollege1

GIRLS

Reg2gt

Reg2gi

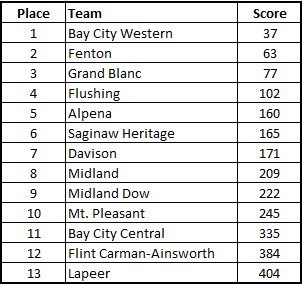
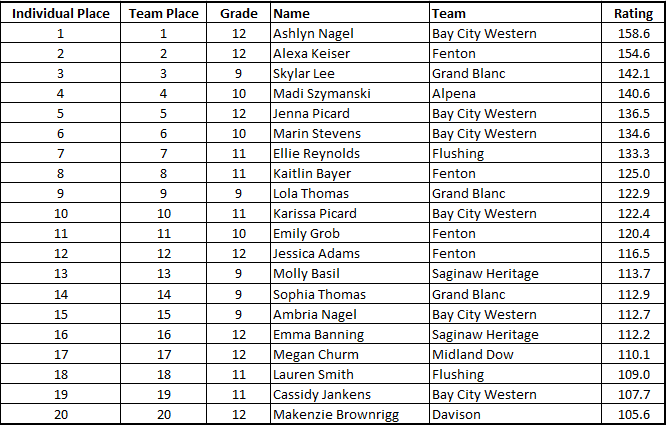
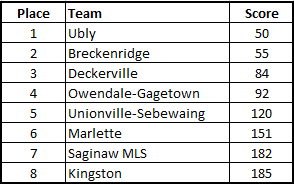
Region 2 is about as well-represented of a region you’ll find.  One team in the top 10, one ranked 11-20, one ranked 21-25.  It’s fair, there’s a battle at the top, but shouldn’t be too much drama past the top three teams.

Bay City Western has been well-documented.  Their distance relays just finished an outstanding season, finishing 1st in the 4×8 at States and 3rd in the DMR at NBN.  They return three of those girls, Ashlyn Nagel, Karissa Picard, and Jenna Picard.  The rich even get richer as Ashlyn’s younger sister, Ambria Nagel moves up to join the team.  From their social media, one thing present is the positive accountability their coaches provide, much attention is given to the work their athletes put in.

Fenton returns four girls from a squad that finished 9th at last year’s State Finals.  What would normally be a tough job to replace over 40% of your top 7 is an afterthought, as they had 9 girls under 21, 4 of which being freshmen.  Emily Grob is probably the most impressive of those, she ended up going 5:38 in track.  The girl I’d expect to outperform her rating is Jessica Adams, her 12:26 in track was a massive PR and no fluke either, as she had multiple performances in the mid-12’s.

The freshman class will have a large impact on Grand Blanc.  Sophia and Lola Thomas were both able to run in the 12’s as middle schoolers last year.  They’d often finish 2nd or 3rd, mainly because Skylar Lee was out there winning.  Skylar then ran 5:20/11:35 in track, expect her to be one of the better freshmen girls in the state.

Madi Szymanski is coming off a freshman year where she was able to spend much time in the 19’s.  She had a breakthrough race here, finishing 6th in 18:37.  That carried over to track, where she ran 5:22 in early April.  Her season was cut short, hopefully she’ll be back in form in a few months.

Can Emma Banning recapture her form from her sophomore year?  Track season indicates that could happen, a 5:29 is definitely in line with the low 19 performances she’s capable of and has run in the past.

BOYS

Reg2bt

Reg2bi

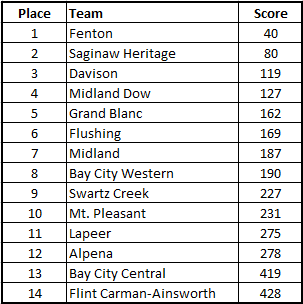
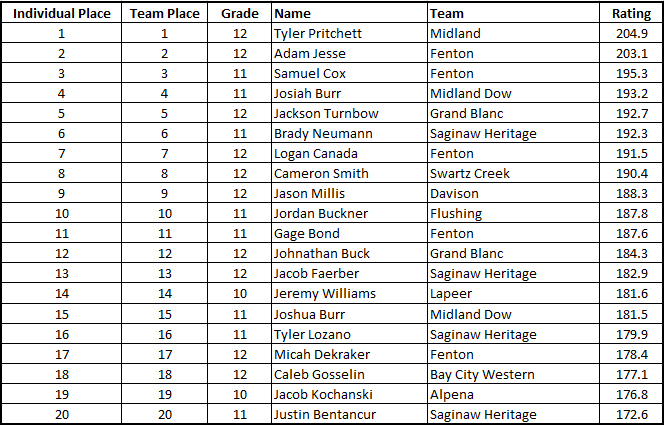
Fenton could very well possibly place five runners in the top 20.  Adam Jesse is a top 30 runner, but he did this mainly on the back of his track season.  His 9:29 was a bit better than some of his counterparts who finished similarly at MIS.  Two other members of their crew also had excellent 32 times, Gage Bond and Logan Canada.  Gage nearly broke 10 and Logan snuck right under.  As with Jesse, both were improvements in condition in relation to XC.  They’re one of a few teams (Stony Creek, TCC, Cedar Springs) that should be on the cusp of that top 5.

Prior to last year, I may have thought Saginaw Heritage would be in a rebuilding year.  They had potential, but probably underdogs to make it to States.  Lo and behold, they made it again.  I’m curious to see where they’ll place on JFTMichigan’s list of consecutive qualifiers.  They’re a young team that has put many people under 18, meaning my top 7 might not be the top 7 at year’s end.  There’s potential, but there’s also protection against subpar performances or injuries.  Brady Neumann is their top guy.  As a sophomore he was able to finish 8th here last year and then run 9:55 in track.

Davison is projected as the third team here, largely on the strength of their 5th-7th runners.  The race between them and Midland Dow should be equal through their top 4s, but Davison can take the next 3 spots.  That shouldn’t diminish the track season of Jason Millis, which was outstanding.  4:31/9:43, if he continues that form, could put him in the top 3 here.

Jeremy Williams has been begging and pleading for this preview, he should make a leap this fall.  His track profile indicates someone who’s more endurance-based, even if that didn’t show last year.  9:59 as a freshman shows the potential, even with the greater weight applied to XC, he’s still rated top 15 here.  Long story short, he could be higher.

He doesn’t know it, but Cameron Smith has long been a bane of my existence.  Common names screw with Excel sheets (looking at you too, Paige Anderson and Jacob Brown).  He broke the 10 minute barrier this spring.  He was 11th last year and looks to be putting in mileage already this summer.

Regional Previews

An Early Look: Region 35

wagenerpark

GIRLS

Reg35gt

Reg35gi

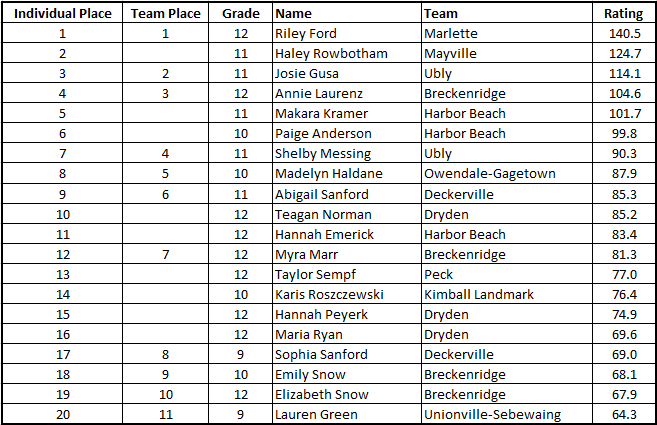
One only has to peek at their athleticnet homepage to realize Ubly’s success over the years.  At States, they were runner-ups two years ago and 8th last year.  They’re favorites for another regional championship and are in the running for another top-10 finish this year.  They’re led at the top by Josie Gusa.  Josie broke 20 for the first time here last year and went on to finish 23rd a week later.  For a Division 4 school, they have great numbers and what looks to be a strong MS feeder program.  Two runners coming into 9th grade should make an impact, Maze Gusa and Abigail Guza.

Breckenridge benefits from moving out of a hellish mid-Michigan region.  They’d undoubtedly be in a battle with Carson City for the final spot there, and it would be a shame to leave out a top-15 team.  Annie Laurenz must be extremely athletic.  She’s a record-setting hurdler for their track team, then turns around to run cross and be an excellent front runner.  Watch out for Elizabeth Snow, she was able to set a significant 3200m PR, and if that carries over, she could be close to the top 10 here.

I feel Deckerville and Owendale-Gagetown both deserve a spot at State finals.  I consider myself a maps nerd and I didn’t even know the towns of Owendale or Gagetown existed.  That’s a credit to their coaches, able to build a program from a little-known area.  They’ll benefit from the Haldane family, Madelyn Haldane being the best runner of the bunch.  Madelyn was able to finish 10th here last year.  Deckerville benefits from the Sanford family.  The oldest, Abigail, has been a stud for them for her first two years.  She also pole vaults.  We saw a 100/800 double earlier, now a distance/pole vault.  Kids these days.

Riley Ford is the defending regional champion.  She finished 5th at MIS last year and dropped a significant amount of time from her 1600m, 5:41 to 5:16.

Both Makara Kramer and Haley Rowbotham qualified out of this region last year and ended up finishing All-State.

BOYS

Reg35bt

Reg35bi

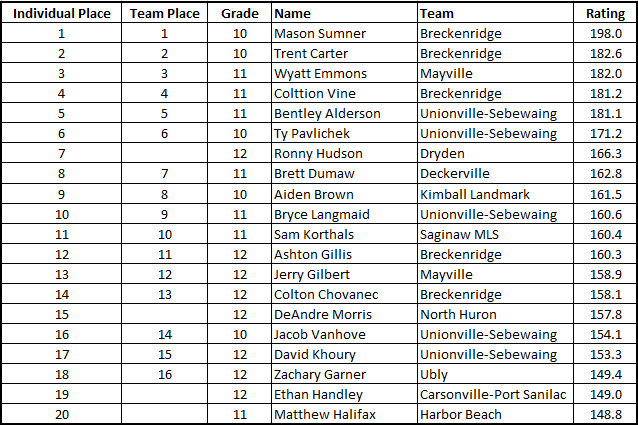
It’s no secret that I feel Breckenridge is the #1 returning team on the boys’ side of Division 4.  They’ve got state meet experience, young runners, and a coach who cares.   Mason Sumner was arguably the best freshman outside of Metro Detroit.  He nearly broke 16:00 at an early MSAC Jamboree and recorded top 10 finishes at Holly, Portage, Carson City, and States.  Not to mention taking some titles at Lancer and Shepherd’s John Bruder Classic.  Speaking of rising sophomores, don’t sleep on Trent Carter, who flirted with the 17 min. barrier in the latter stages of the year.  An athlete that could seal the deal for Breckenridge is Jonathan Markley.  Thanks to my buddy Michigan XC Nerd for pointing his track times out, 4:51 after running in the high 18’s last fall.

Unionville-Sebewaing is another top 5 team in this region.  They follow a similar pattern, a good mix of under and upperclassmen.  Ty Pavlichek had some breakout races last year, his 24th at Holly and 31st at Wagener Park stand out.  Bentley Alderson was an All-State performer, finishing 12th.  That momentum carried into track, where he dropped a 4:35 1600m.  I don’t feel Sumner is touchable here, but if he builds on that, 2nd place is within reach here.

From there, it’s between Mayville and Deckerville.  Deckerville really has the… deck stacked against them?  Tough to be placed in a region with three top 10 teams.  Deckerville has potential, one runner that could vault them into contention is Kendall Dumaw.  He won some middle school meets, Cass City and Laker.  Finished no lower than 9th on the season and broke 12:00.  I err on the extremely conservative side when projecting incoming freshman.  I currently have him as Deckerville’s 4th runner.  For comparison, his brother, Brett Dumaw, ran slightly slower in middle school and 18:14 as a freshman.    Brett Tanton is another one that has shown potential.  He’s gone under 5:20 the last two years, last year it didn’t translate, but could it happen this year?

Beating Mayville will still be tough.  Wyatt Emmons will undoubtedly be top 5 here.  Not only is he fast, he was remarkably consistent in the latter stages of the season, finishing 3rd here and 14th at MIS.  Jerry Gilbert threatens to put two runners in front of Deckerville’s first.  The race, as many do, will come down runners 3-7.

A few other runners stand out to my eye.  Ronny Hudson has dropped 3 minutes from his freshman to junior years.  He was 7th here last year.

Matthew Halifax is similar, to a lesser degree.  20:05 to 18:34 last year.  His 5:05 in track suggests he’s still on an upward trajectory.