Finally, the start of the season we’ve all been waiting for. Throw out all the fast times from September, but apply all the lessons learned through the summer and fall. Regional week is here and with it comes the many projections and previews I’ll write.
Just as last year and throughout the season, I’m projecting these using race simulations. Through a season’s worth of speed ratings, one can determine a runner’s average rating and the variability of those ratings. Both those factors are then weighed towards more recent meets, which are then simulated thousands of times using a Monte Carlo analysis (also described by TullyRunners here). Over those thousands of race simulations, one can determine a team’s average place and average score, a runner’s average place, odds on winning, and odds on qualifying.
These are useful in cross country scenarios, where you have consistent runners and those who are a bit more up and down. For example:
| Tanner Time | Tanner Rating | Tanner Avg. | Tanner StDev. |
| 15:30 | 210 | ||
| 15:45 | 205 | ||
| 16:00 | 200 | ||
| 16:15 | 195 | ||
| 16:30 | 190 | 200 | 7.91 |
| MIXCSR Time | MIXCSR Rating | MIXCSR Avg. | MIXCSR StDev. |
| 16:09 | 197 | ||
| 16:12 | 196 | ||
| 16:15 | 195 | ||
| 16:18 | 194 | ||
| 16:21 | 193 | 195 | 1.58 |
Jacob at his best might be faster than I in four of the five races during the season. I’d almost never be All-State in Division 1, but he might contend for a top-5 spot or place 60th.
If we did 20 simulations, this is how it might turn out:
| Race | Tanner Avg. | Tanner StDev | Tanner Rating | MIXCSR Avg. | MIXCSR StDev | MIXCSR Rating |
| 1 | 200 | 7.9 | 202.1 | 195 | 1.6 | 195.6 |
| 2 | 200 | 7.9 | 196.2 | 195 | 1.6 | 194.1 |
| 3 | 200 | 7.9 | 190.0 | 195 | 1.6 | 199.2 |
| 4 | 200 | 7.9 | 193.4 | 195 | 1.6 | 192.5 |
| 5 | 200 | 7.9 | 206.8 | 195 | 1.6 | 195.7 |
| 6 | 200 | 7.9 | 201.8 | 195 | 1.6 | 196.1 |
| 7 | 200 | 7.9 | 171.6 | 195 | 1.6 | 194.9 |
| 8 | 200 | 7.9 | 189.2 | 195 | 1.6 | 195.9 |
| 9 | 200 | 7.9 | 205.5 | 195 | 1.6 | 197.0 |
| 10 | 200 | 7.9 | 203.8 | 195 | 1.6 | 192.6 |
| 11 | 200 | 7.9 | 192.3 | 195 | 1.6 | 196.5 |
| 12 | 200 | 7.9 | 196.9 | 195 | 1.6 | 196.4 |
| 13 | 200 | 7.9 | 198.5 | 195 | 1.6 | 195.6 |
| 14 | 200 | 7.9 | 203.2 | 195 | 1.6 | 194.1 |
| 15 | 200 | 7.9 | 193.9 | 195 | 1.6 | 192.6 |
| 16 | 200 | 7.9 | 199.3 | 195 | 1.6 | 193.2 |
| 17 | 200 | 7.9 | 208.7 | 195 | 1.6 | 194.2 |
| 18 | 200 | 7.9 | 213.7 | 195 | 1.6 | 194.6 |
| 19 | 200 | 7.9 | 212.6 | 195 | 1.6 | 197.1 |
| 20 | 200 | 7.9 | 206.3 | 195 | 1.6 | 193.9 |
I’d win four times, but I’d never have the ability to win a title like he had in Race 18. He’s usually All-State, but may cost his team a title through his effort in Race 7.
The simulations give the possibilities of those scenarios and all the various scoring scripts. A sixth girl that can pop off on any certain day, a reliable boy who always runs 17-flat, you name it. Hopefully, they better elucidate our contenders, qualifiers, and how these races play out over the weekend.
But always remember, races aren’t run on paper or on a computer. These projections are meant to better our sport, give more attention where little is given. Although I take pride in their accuracy, this endeavor would be quite boring if it were always perfect. I look forward to these being proven wrong and I expect to hear about it as well.

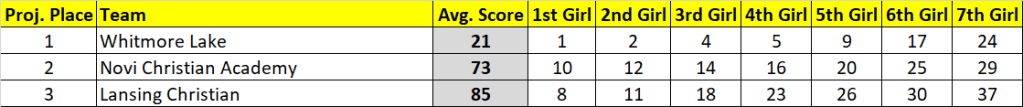
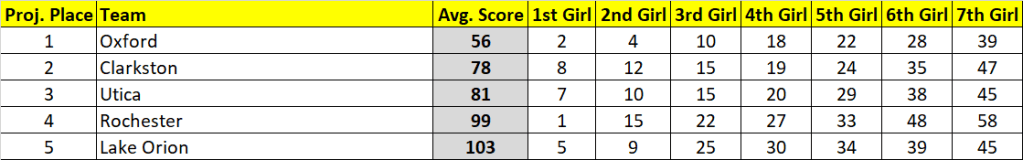
GIRLS
Ranked Teams
#11 Oxford
#17 Clarkston
#18 Utica
#23 Rochester
#26 Lake Orion
Projected Individual Qualifier Cutoff
18th place. Seems the contenders for qualifying have plenty of runners in that 5th to 15th range.
| Projected Place | Team | Avg. Score | Avg. Place | Win % | Top 3 % |
| 1 | Oxford | 56 | 1.1 | 94 | 95+ |
| 2 | Clarkston | 78 | 2.5 | 5 | 90 |
| 3 | Utica | 81 | 2.8 | 90 | |
| 4 | Rochester | 99 | 4.2 | 13 | |
| 5 | Lake Orion | 103 | 4.5 | 7 | |
| 6 | Rochester Adams | 147 | 6.4 | ||
| 7 | Troy | 157 | 6.7 | ||
| 8 | Bloomfield Hills | 192 | 7.9 | ||
| 9 | Utica Ford | 309 | 9.5 | ||
| 10 | Troy Athens | 314 | 9.6 | ||
| 11 | Sterling Heights Stevenson | 348 | 11.0 | ||
| 12 | Waterford Mott | 376 | 12.2 | ||
| 13 | Warren Cousino | 392 | 13.2 | ||
| 14 | Warren Mott | 405 | 13.9 | ||
| 15 | Waterford Kettering | 415 | 14.7 |
| Projected Place | Grade | Name | Team | Avg. Place |
| 1 | 11 | Lucy Cook | Rochester | 1.1 |
| 2 | 11 | Mallory Bigelow | Oxford | 2.1 |
| 3 | 12 | Braydee Elling | Oxford | 3.9 |
| 4 | 12 | Hannah DeRoeck | Lake Orion | 4.8 |
| 5 | 10 | Addison Herr | Bloomfield Hills | 5.1 |
| 6 | 10 | Audrey Hamilton | Troy | 7.3 |
| 7 | 9 | Emma Brown | Utica | 8.2 |
| 8 | 9 | Linda Lopez | Lake Orion | 8.9 |
| 9 | 10 | Siene Muraszewski | Utica | 9.6 |
| 10 | 11 | Taylor Brodeur | Oxford | 10.4 |
| 11 | 12 | Alexandra Brigham | Clarkston | 12.2 |
| 12 | 9 | Avery DeGrendel | Clarkston | 15.3 |
| 13 | 12 | Anna Reineck | Clarkston | 15.6 |
| 14 | 10 | Taylor Parsons | Rochester | 15.9 |
| 15 | 9 | Addison Brigham | Clarkston | 16.1 |
| 16 | 10 | Brooke McFarland | Utica | 16.7 |
| 17 | 11 | Norah Lesner | Utica | 18.3 |
| 18 | 9 | El McMahan | Rochester Adams | 18.5 |
| 19 | 12 | Aubrey Mery | Oxford | 20.5 |
| 20 | 11 | Jamie Patterson | Oxford | 20.9 |
| 21 | 10 | Sydney Fischer | Clarkston | 21.3 |
| 22 | 11 | Kaitlyn Kauppila | Rochester Adams | 23.4 |
| 23 | 11 | Stephanie Bulat | Rochester | 23.5 |
| 24 | 11 | Madie Miller | Troy | 26.1 |
| 25 | 11 | Mia Snellgrove | Rochester | 26.3 |
| 26 | 9 | Mary Graves | Lake Orion | 27.4 |
| 27 | 10 | Laila Bodell | Oxford | 27.7 |
| 28 | 9 | Olivia Jenny | Bloomfield Hills | 28.0 |
| 29 | 11 | Sophia Aquino | Utica | 29.9 |
| 30 | 9 | Annie Roraff | Rochester | 32.5 |
Anything Intriguing?
I’ve been really impressed with Utica’s ability to handle adversity this season. Missing their top runner for the past two months may have derailed a weaker team, but these girls have come together stronger. They’ll face qualifying challenges from a Clarkston, who had the race of their lives at last fall’s regional and a young Rochester squad.
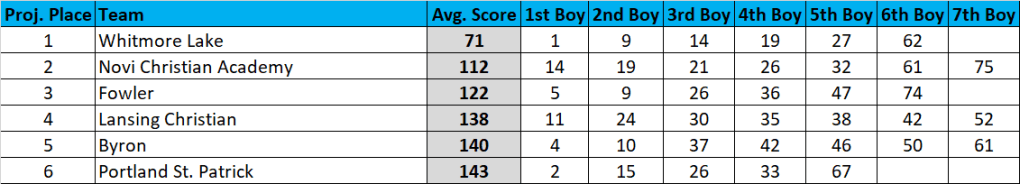
BOYS
Ranked Teams
#7 Oxford
#9 Troy
#16 Clarkston
#18 Utica
#26 Lake Orion
Projected Individual Qualifier Cutoff
15th to 16th place.
| Projected Place | Team | Avg. Score | Avg. Place | Win % | Top 3 % |
| 1 | Oxford | 69 | 1.7 | 54 | 95+ |
| 2 | Troy | 75 | 2.0 | 23 | 95+ |
| 3 | Clarkston | 82 | 2.7 | 22 | 76 |
| 4 | Utica | 97 | 3.8 | 26 | |
| 5 | Lake Orion | 124 | 4.9 | ||
| 6 | Troy Athens | 174 | 6.8 | ||
| 7 | Rochester Adams | 175 | 6.9 | ||
| 8 | Rochester | 178 | 7.1 | ||
| 9 | Utica Ford | 252 | 9.6 | ||
| 10 | Warren Cousino | 254 | 9.6 | ||
| 11 | Bloomfield Hills | 280 | 10.8 | ||
| 12 | Sterling Heights Stevenson | 353 | 12.2 | ||
| 13 | Waterford Kettering | 367 | 13.0 | ||
| 14 | Waterford Mott | 391 | 13.9 | ||
| 15 | Warren Mott | 494 | 15.3 | ||
| 16 | Auburn Hills Avondale | 500 | 15.7 |

| Projected Place | Grade | Name | Team | Avg. Place |
| 1 | 12 | Vishvaa Ravishankar | Troy | 1.9 |
| 2 | 11 | Taye Levenson | Bloomfield Hills | 2.2 |
| 3 | 11 | Kian Schneeweis | Troy | 3.1 |
| 4 | 11 | Alexander McArthur | Oxford | 4.3 |
| 5 | 10 | Harper Wesley | Utica | 4.5 |
| 6 | 11 | James Cusick | Oxford | 8.0 |
| 7 | 12 | Bryce Nowik | Clarkston | 9.7 |
| 8 | 11 | Raymond Lucero II | Lake Orion | 10.1 |
| 9 | 12 | Louis D’Souza | Troy | 12.8 |
| 10 | 11 | Cayden DeGrendel | Clarkston | 13.3 |
| 11 | 12 | Ethan Muraszewski | Utica | 14.2 |
| 12 | 11 | Max Myrand | Oxford | 15.1 |
| 13 | 12 | Jacob Esser | Troy Athens | 17.0 |
| 14 | 10 | Ryan Barnes | Clarkston | 17.1 |
| 15 | 10 | Nate Linden | Troy Athens | 17.3 |
| 16 | 12 | Aiden Janes | Rochester Adams | 17.8 |
| 17 | 12 | Lucas Ames | Oxford | 19.6 |
| 18 | 11 | Luke Morehouse | Utica | 19.8 |
| 19 | 11 | Napolean Lino | Rochester | 21.0 |
| 20 | 11 | Blake Peardon | Lake Orion | 21.6 |
| 21 | 12 | Cass Feeney | Oxford | 22.2 |
| 22 | 10 | Dylan Pascoe | Rochester | 22.7 |
| 23 | 12 | Andrew Floros | Clarkston | 22.9 |
| 24 | 12 | Oliver House | Lake Orion | 23.0 |
| 25 | 11 | Akshat Arora | Troy | 24.2 |
| 26 | 12 | Silas Smith | Utica | 26.8 |
| 27 | 11 | Joshua Ellingsworth | Clarkston | 27.5 |
| 28 | 11 | Reynold Wei | Rochester Adams | 28.1 |
| 29 | 12 | Dylan Esser | Troy Athens | 28.8 |
| 30 | 12 | Johnathan Mitchell | Utica Ford | 28.9 |
Anything Intriguing?
You could make arguments for any combination of these top four teams to be the state squad. Utica pulled a major upset last year, Clarkston is on their home course, Oxford has stepped up to the plate in large invites, and Troy looks to capitalize on their potential shown at Jackson and re-write the wrongs of the County and OAA Red championships. Whatever it is, a top-15 squad is likely staying home and three other top-15 squads are moving on.