Blog

Uncategorized

Times DO NOT Matter

Okay, they matter. But not how you think they do.

Seth is a great follow for NBA stats in non-numbers way.

Came across this tweet the other day and it hit me pretty hard. Although I’ve posted a few times my methodology, it sometimes feels the word isn’t getting across. Which is 100% my fault, not that I’m seeking sympathy, but just giving myself an honest appraisal. I can explain it to myself in my head and in person to others, but usually in a convoluted ramble.

I’ll go into why times DO NOT matter but they really do kind of matter in a bit, but first a reminder of how ratings are created:

Boys Allendale Falcon 2018
X axis = number of runners
Y axis = time (in seconds)

On my summer post, I mentioned how I was looking for a baseline. It wasn’t a Eureka! moment, but Allendale Falcon 2018 seemed to fit the bill. In comparison between that race and MIS 2018, the difference between the two ratings was very minimal (on both boys & girls), stdev of that difference also low.

AF 2018 was the baseline for races this year. It may be the baseline for races next year. Other reasons I like it are that it’s in the middle of the season, reasonably healthy competition, and has a large sample of runners.

That large sample helps smooth out the graph. The graph is an S-curve, which you’ll get in almost all races. Extend that out to almost 500 runners, it gives you some pretty identifiable patterns. I drew a line through the mid-section of runners. Why the mid-section? These are your “average” runners, and with a greater number/less variability between “average” runners, one can begin to make an assumption between the difference between two races.

That line hits the Y-intercept at 997 seconds. Invitationals of a decent size (>150) and of comparable quality can then rated against this.

Here’s the graph from Holly this year:

Holly’s line hits the Y-intercept at 1031 seconds. The difference between the two is 34 seconds, and that is the course adjustment FOR THAT DAY. There are some drawbacks to merging races across a day, but I’m strapped for time as is, so that’s what we’re going with for now.

So, Carter Solomon ran 15:26.3 at Holly.
15:26.3 = 926.3
The formula for ratings calculation is: (1560 minus (time minus adjustment))/3
(1560-(926.3-34))/3 = 222.6

You may notice his rating this year was 221.6. AF2018 was listed in 2018 as 3 seconds faster than the baseline that year. I decided to try to keep the numbers consistent through the years, so the formula for Solomon’s race was actually (1560-(926.3-31))/3 = 221.6

TIMES DO NOT MATTER

Let’s say someone missed a turn at Holly and led everyone on a path to make the course 300m long. Every single runner in the boys races added exactly a minute to their time. Carter Solomon runs 16:26.3 in this example. Here’s the graph:
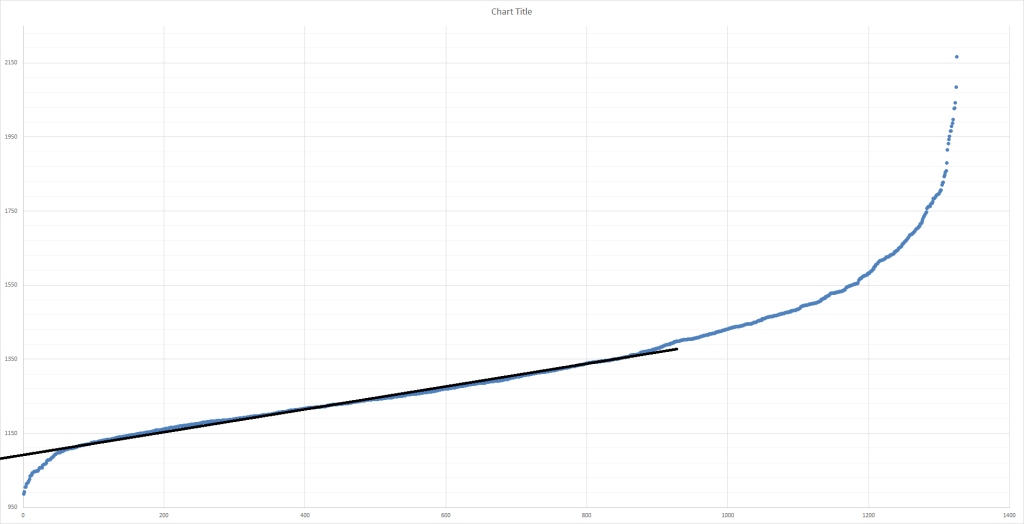
The line hits the Y-intercept at 1091 seconds. 1091-997 = 94. With the 3 second adjustment, then the difference is 91 seconds.

16:26.3 = 986.3
(1560-(986.3-91))/3 = 221.6

You can repeat this exercise for adding 10 minutes, 3 hours, subtracting 5 minutes.

A runner’s individual time, independent of everything else DOES NOT MATTER.

But you said time does matter. Yes, it does. The time it takes a runner to finish a course in and of itself doesn’t. The time it takes a runner to finish a course compared to other runners on that same course the same day does matter. For every runner in every race ever run, there is a time differential between that runner and every other runner in the race (this is the reason you can still make ratings if you start the clock when the first runner crosses the line – it would just be in a different format).

Comparing runners against one another

AthleteTeamHollyDifference (WS vs Others)
Peter BaraccoFarmington987.8-73.9
Adam HillRoyal Oak1006.6-55.1
Connor MyattRoyal Oak1077.315.6
Jakar DhillonBloomfield Hills1057.2-4.5
Weston SchroederRoyal Oak1061.70
Ian DunnFarmington1065.13.4
Kemp WinklerRoyal Oak1046.9-14.8
Kevin MillerFarmington1077.916.2
Bryan HanesRoyal Oak1049.1-12.6
Jack RickleRoyal Oak1081.920.2

The chart here shows 10 runners that ran at Holly. Third column is their time in seconds, fourth column is the difference between their time and Weston Schroeder’s time. Adam Hill ran 55.1 seconds faster than Schroeder here.

Now at the OAA White Jamboree the next week:

AthleteTeamOAA White 2Difference
Peter BaraccoFarmington1001.5-59.5
Adam HillRoyal Oak1009.1-51.9
Connor MyattRoyal Oak1046.1-14.9
Jakar DhillonBloomfield Hills1046.6-14.4
Weston SchroederRoyal Oak1061.00.0
Ian DunnFarmington1061.20.2
Kemp WinklerRoyal Oak1068.37.3
Kevin MillerFarmington1069.28.2
Bryan HanesRoyal Oak1071.610.6
Jack RickleRoyal Oak1085.324.3

Same format as before, now Adam Hill ran 51.9 seconds faster than Schroeder. Now Adam’s rating would still being higher, having run the faster time. But relative to one another between races, Schroeder would cut the gap between the two.

This is a tiny example of using reference runners. That is a different, yet still viable method of rating. I’ll get into it next week, but I believe around 100 runners ran at Holly and OAA White 2. The average time difference between the two had OAA White 2 around 24 seconds faster than Holly.

SUMMARY (or just a section where I use another source that might explain it better)

I’m stealing this from the Godfather, TullyRunners. Meylan’s explanations are much longer but cover all the bases:

Uncategorized

State of the Rate 2019

Well, it’s been a grind, but I’ve gotten through this year in one piece.  This couldn’t be done without support from others.  I have an undying desire to crunch numbers, analyze data, and perform comparisons.  That would likely wane without the response from others.  The tweets, likes, messages, and all-around curiosity keeps me motivated.

Background

Speed ratings became an idea way back in 2007 when I was helping my uncle coaching at Woodhaven.  At the time, I was an avid Dyestat poster and knew of a fellow forum member doing the same thing out in Washington.  For a season, I was spitting out ratings and rankings and posting on the chaotic MLive forums (RIP).  Although I’m in all accounts a nerd, at that time I had little computer knowledge, it became impossible to balance ratings/life/running/school.  

In 2017, I came into work one day at Hansons and found that the person closing the night before had left a list of times from other schools competing for that D1 state title.  Comparing times is no way to evaluate cross country.  School was out of the equation, I’m definitely not running as much, so why not?  This is something I’ve wanted to do, forgot that I wanted to, remembered about, then had the impetus to get it going again. 

The Site

Not a blog.  If it were a blog, you’d know my personal thoughts on “issues”.  Heck, if you follow my twitter, you’re unfortunately privy to my thoughts on issues.  I’m never wrong and have to get the last word in, oh well. 

Anyhow, the site was launched in August 2018.  Enough of the story, you’re getting stats:

Month/Year Views Visitors
August 2018 2,281 958
September 2018 4,657 1,607
October 2018 4,391 1,326
August 2019 15,091 3,835
September 2019 18,507 3,799
October 2019 32,493 5,870
Season Views Visitors
XC 2018 11,329 3,891
XC 2019 66,091 13,504

Visitors are likely the better metric in tracking growth (more content, more individual page views). 

2018 vs. 2019 = 3.47x visitors, 5.83x page views. 

I should also mention this site will NEVER partner with a RunnerSpace or a MileSplit.  Not that there were any offers.  I value my independence and that stubbornness would be an issue.

Accuracy

An area I struggle with is getting across is that the ratings and projections are not predictions.  They’re not the determining factor in one’s team.  They’re just another data point, one using past results, to hopefully compare one performance against another.  One performance then becomes many performances, those many performances turned into what I look to be an accurate depiction of how championship races will score. 

How accurate were the ratings in 2019?

Category 2018 Overall 2018 % 2019 Overall 2019 %
Team Qualifiers 188 of 216 87.0% 190 of 216* 88.0%
Individual Qualifiers 881 of 1080 81.6% 892 of 1080 82.6%
All-State 191 of 240 79.6% 187 of 240 78.3%
Proj. Place vs. Actual Place 2.35 place difference   2.27 place difference  

*(eliminated those additional qualifiers for comparison sake, but I did have 2 of the 3 finishing 4th)

Improving on three of four ain’t bad.  But you know me, I’m competitive, especially with myself.  I’ll keep plugging away in order to get those numbers higher.

What’s often is heard is that Americans love the story of the underdog.  Miracle on Ice, 1969 Michigan vs. OSU (can we get a repeat of that, please?), I might even throw MSU’s Big Ten winning girls XC team into that mix.  I love when the projections are wrong, it gives greater life to the stories of runners like Jason Millis and Anna Petr, coming through in the final stretch of their final races for their teams.  The projections can’t capture the heart and the tales of great performances.  That’s perfect. 

Stories

In all, there were 50+ races projected this season.  Initially, I believed I could review those immediately, very soon I learned that just wasn’t going to happen.  We have a long, arduous winter ahead of us, and what better to do but look back at those races, interspersed with the stories of those who competed. 

I’ve had many interactions with coaches, parents, supporters, and athletes over the season.  We often lament kids for what we perceive to be negative attributes, they’re the same as when we were kids.  They have more stimuli, more expectations, less time, more stress.  Yet they’re still out here training and hitting pain levels in races that we wouldn’t dare experience.  Their stories need to be told. 

MGoBlog, Spencer Hall, and The Athletic are some of my favorite online reads when it comes to sports.  I grew up listening to Keith Jackson call college football games.  Here you get Spencer Hall writing about Keith Jackson.  I can’t even read the entire article without getting emotional.  Can I write on that level?  Probably not.  Will I try?  Yes.

You ever listen to those old British announcers calling a track meet?  I can hear it now, “Baumann’s a whiiiirlwind on the last lap”, “Gammoudi is bankrupt, so too is Prefontaine”.  Numbers and facts are great, but we can do a better job of crafting a tale. 

Logo

The site desperately needs a unique logo.  With zero design experience, I’m opening this up to you.  I’d prefer it to be minimal, but announce that the site is covering XC in Michigan.  If there are enough submissions, I’ll make it a contest.  If you win said contest, you’ll get free t-shirts/hats/hoodies/other swag.  Yes, I want to make shirts. 

This leads me to…

Money

I will likely place ads on the site.  I really want to be careful with this, for two reasons.  One, they get in the way of everything and diminish the online experience.  Gaudy and cumbersome ain’t gonna happen, minimal will be the way to go. The other is when runners see ads on a site, they see ads for buying running shoes online.  You really need to go support your local running shop.  If the ads start to head into that realm, I’ll pull them.  But I’m an adult, there’s bills to pay, and operating this is a major opportunity cost when it comes to earning money. 

The hope is at some time get to a point where there’s a subscription, but the content isn’t there yet.  See kenpom (easiest $20 spent every year), UMHoops for examples. 

If you want, you can always donate.  I have a paypal link in the bottom right corner.  That money will go towards awards (more on that tomorrow).  Since I’ve been running for awhile and work at one of those local running shops, the awards will be various items that I find useful and humorous. 

Winter Projects

  • Figuring out how to code

If I can find a way to cut into the time needed to produce ratings, they’ll be done more accurately.  Manually pulling results, compiling them, then graphing takes a little time.  I’d like to find a method that does this all a bit quicker.  This would also help in the whole website building world.

  • Finding a suitable Monte Carlo simulator

Monte Carlo simulations take the speed ratings and then generate thousands of projected races given those ratings. It’s something that gives added value to a consistent runner and takes into account someone who alternates “good” and “bad” races. When you simulate thousands of examples, it helps to eliminate the sample size issue inherent with many of the projections.

  • Evaluating incoming freshmen, year to year improvements, track times

You won’t be seeing middle school ratings.  But they’ll secretly be done in order to fully get a grasp of what we can expect from newcomers.  My assumption is that there’s more variability in the length of middle school courses.  I did work on year to year improvement during last winter, but I think I have a better method for determining that this year.  Same with how to add track times into the preseason projections.  Why do all this?

  • Regional suggestions

There’s no way Pittsford girls or Pinckney boys should miss out on the state meet.  When you’re arguably a top-10 team in the state, you should be running in November.  I know there are other many other considerations.  We’ve improved from the days of Pioneer, Huron, Saline, Bedford, and Monroe being in the same region.  I know you can’t quantify summer training and coaching.  But maybe we can nail down who is expected to be good and have a good baseline to go from to ensure the best 27 teams are competing on the first Saturday in November.  I’d love to get in that site selection room at some point.  Maps and XC?  You’re really not gonna find a guy more interested in the two than I am. 

  • Sub 5/Sub 6 Challenge

Found this on ILXCTF and figured it would be a good idea for Michigan.  Will release details on that before indoor track starts up. 

Thanks for reading all of my rambling.  As I stated, this little project of mine wouldn’t be where it is without you.  And obviously, as I interact with so many, you get a voice.  Please e-mail or message me with suggestions, concerns, encouragement.  I listen even if it’s not immediately apparent. 

I will take a little, tiny break from content, but I’ll be back to evaluate the MITCA race, who to look for at MidEast MOC, and I’ll scout as much as I can so we can get as many FootLocker qualifiers as possible.    

Thank you,

Matt

Uncategorized

All Division Hypothetical Meet

It is what it sounds like. All divisions in one hypothetical meet. Of course, the course became a little tougher throughout the day and the ratings reflect that.

Ratings

Adjustments:

DivisionGirls AdjustmentBoys Adjustment
D1-13-8
D2-17-9
D3-5-6
D4-5-6

Girls adjustment always tend to be a little higher due to more time spent on the course for mid-pack runners. The adjustments ended up being pretty consistent, although the Girls D1/D2 split could be a few seconds off. Maybe the pack got out a little harder in the D1 race? Whatever it is, the course deteriorated a bit throughout the day, but maybe not to the extent we imagined. It also ran about 4-5 seconds faster in general than 2018.

I listed through the top 75. If you’re not listed and you’re interested to find out where you are, feel free to message me (Twitter, Instagram, Facebook, email, anything works).

GIRLS

PlaceTeamScore
1 East Grand Rapids 110
2 Ann Arbor Pioneer 155
3 Petoskey 204
4 Traverse City Central 211
5 Saline 355
6 Brighton 377
7 Bay City Western 436
8 Northville 450
9 Holland West Ottawa 460
10 Otsego 542
11 Troy 574
12 Romeo 575
13 Hart 638
14 Cadillac 713
15 Forest Hills Eastern 721
16 Temperance Bedford 743
17 Grand Blanc 780
18 Frankenmuth 785
19 Clarkston 795
20 Caledonia 801
21 Rockford 804
22 Jenison 815
23 Fenton 843
24 Forest Hills Northern 847
25 Plymouth 860
26 Holland Christian 879
27 Salem 887
28 Plainwell 889
29 Dearborn Divine Child 895
30 Spring Lake 921
31 Grand Rapids Christian 924
32 Shepherd 925
33 Tecumseh 930
34 Highland-Milford 964
35 Grandville Calvin Christian 974
36 Birmingham Seaholm 1009
37 Bloomfield Hills 1034
38 Howell 1043
39 Traverse City St. Francis 1047
40 Flint Powers Catholic 1053
41 Rochester Hills Stoney Creek 1114
42 Freeland 1123
43 Pewamo-Westphalia 1161
44 Rochester Adams 1165
45 Warren Regina 1202
46 Okemos 1262
47 Allendale 1272
48 Ithaca 1295
49 St. Johns 1316
50 Coldwater 1338
51 Benzie Central 1388
52 Grand Rapids South Christian 1411
53 Linden 1475
54 Whitehall 1508
55 St. Louis 1509
56 Mason 1511
57 Clare 1520
58 McBain 1586
59 Grand Rapids Covenant Christian 1601
60 Royal Oak 1611
61 Bridgman 1665
62 Harbor Springs 1705
63 Mt. Pleasant Sacred Heart 1739
64 Macomb Lutheran North 1779
65 Charlevoix 1824
66 Bloomfield Hills Marian 1839
67 Pontiac Notre Dame Prep 1876
68 Byron 1879
69 Kent City 1885
70 Reese 1980
71 Sterling Heights Stevenson 1991
72 Zeeland East 2015
73 Marysville 2086
74 Galesburg-Augusta 2107
75 Jackson Lumen Christi 2113

BOYS

PlaceTeamScore
1 Brighton 216
2 Dexter 238
3 Fremont 261
4 Clarkston 307
5 Saline 319
6 Traverse City Central 341
7 Rochester Hills Stoney Creek 354
8 Romeo 364
9 Ann Arbor Pioneer 394
10 Detroit Catholic Central 435
11 Caledonia 476
12 Fenton 509
13 Ann Arbor Skyline 570
14 Plymouth 584
15 Hartland 594
16 Zeeland West 618
17 Otsego 662
18 Cedar Springs 677
19 Walled Lake Central 696
20 Rockford 752
21 Haslett 760
22 Dearborn Divine Child 780
23 Chelsea 832
24 Northville 839
25 Grand Rapids Christian 863
26 Davison 924
27 East Grand Rapids 959
28 Hanover-Horton 993
29 Port Huron Northern 994
30 Royal Oak 1003
31 Breckenridge 1013
32 Saginaw Heritage 1015
33 Yale 1044
34 St. Johns 1046
35 Linden 1142
36 Grandville Calvin Christian 1177
37 Holland Christian 1180
38 Grandville 1183
39 Charlevoix 1231
40 Sparta 1242
41 Traverse City St. Francis 1248
42 Petoskey 1255
43 Hart 1259
44 Dearborn 1267
45 Adrian 1271
46 Benzie Central 1292
47 St. Clair 1381
48 St. Louis 1413
49 Troy 1473
50 Spring Lake 1492
51 Hastings 1520
52 Harbor Springs 1533
53 Unionville-Sebewaing 1554
54 Caro 1556
55 Armada 1583
56 Saugatuck 1585
57 Berrien Springs 1604
58 Pewamo-Westphalia 1637
59 Shepherd 1638
60 Montrose 1678
61 Mt. Pleasant Sacred Heart 1683
62 Battle Creek Harper Creek 1688
63 Warren DeLaSalle 1700
64 Bloomingdale 1711
65 Carson City-Crystal 1712
66 Lake Fenton 1741
67 Flint Powers Catholic 1743
68 East Jordan 1756
69 Goodrich 1764
70 Marshall 1772
71 Grand Rapids Covenant Christian 1794
72 Alma 1806
73 Parchment 1818
74 The Potter’s House 1919
75 Allendale 1944