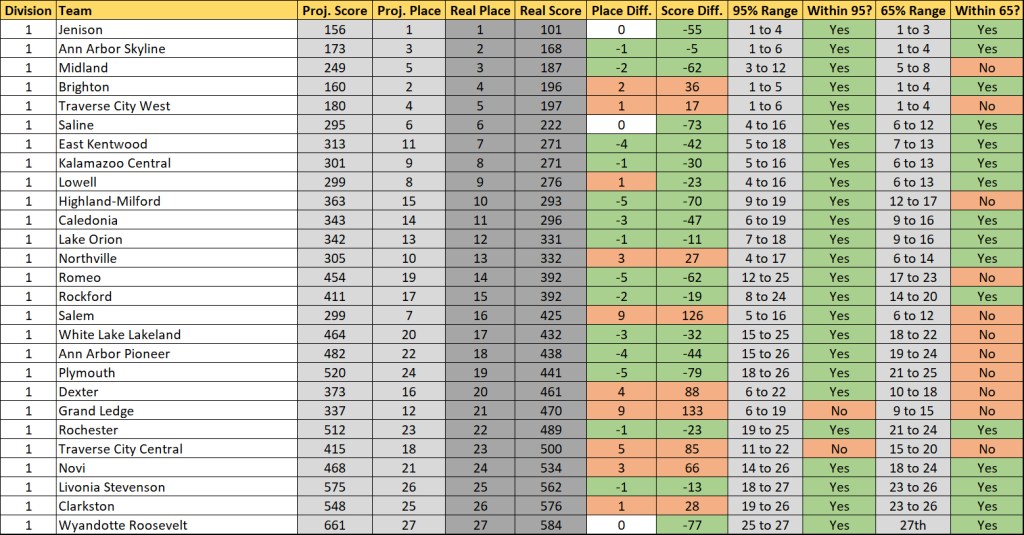
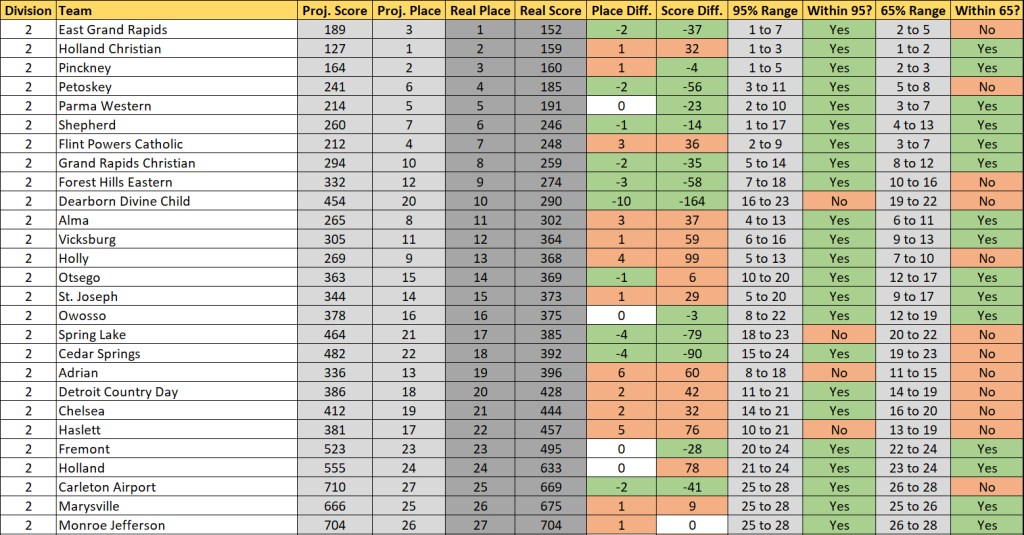
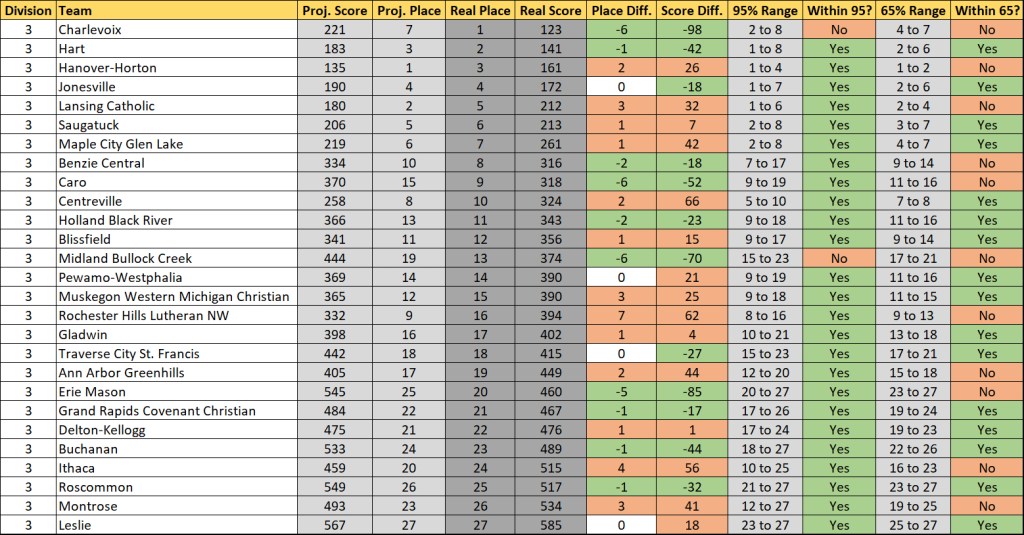
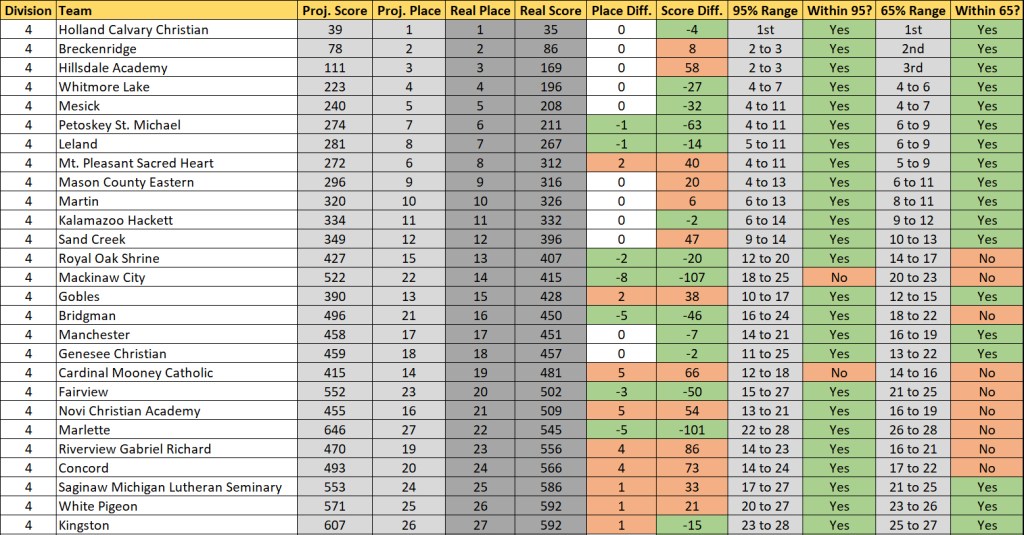
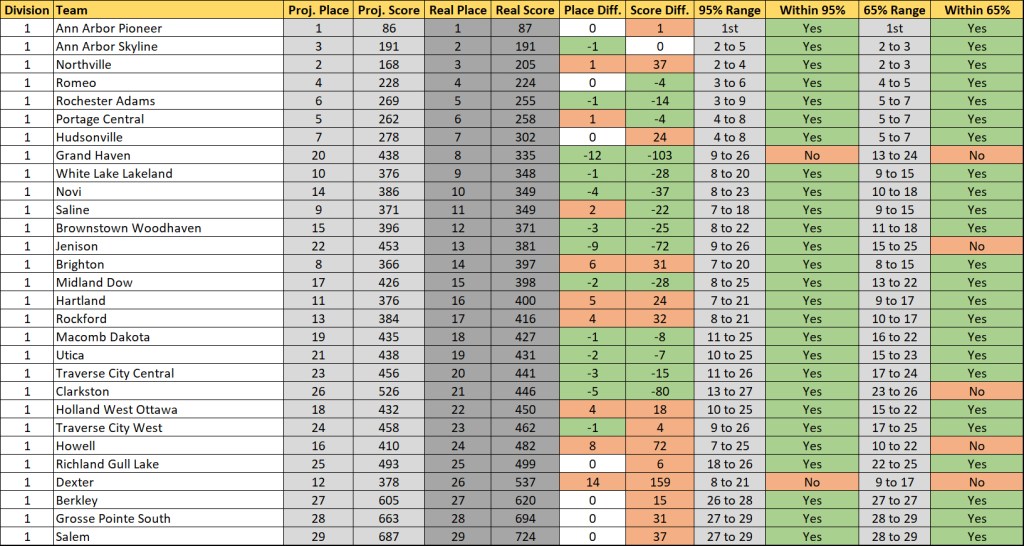
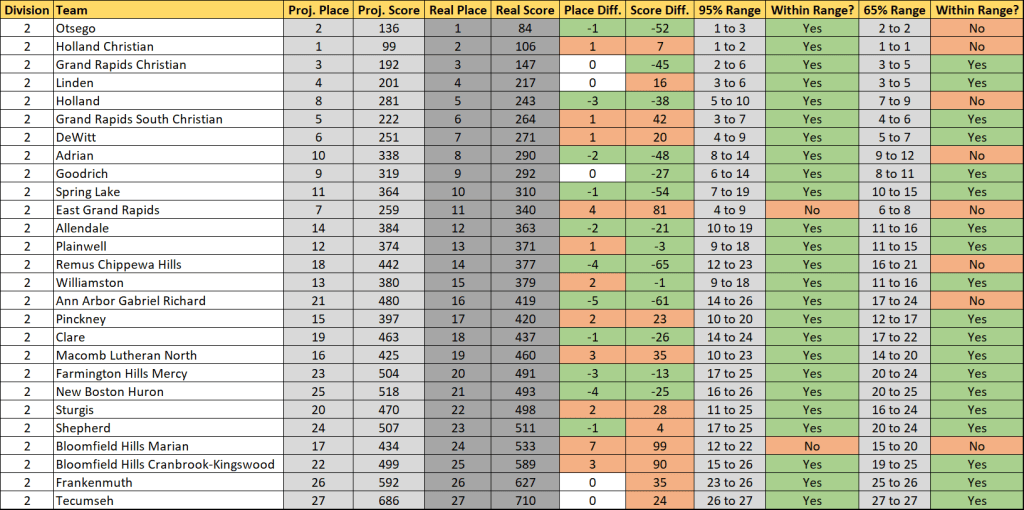
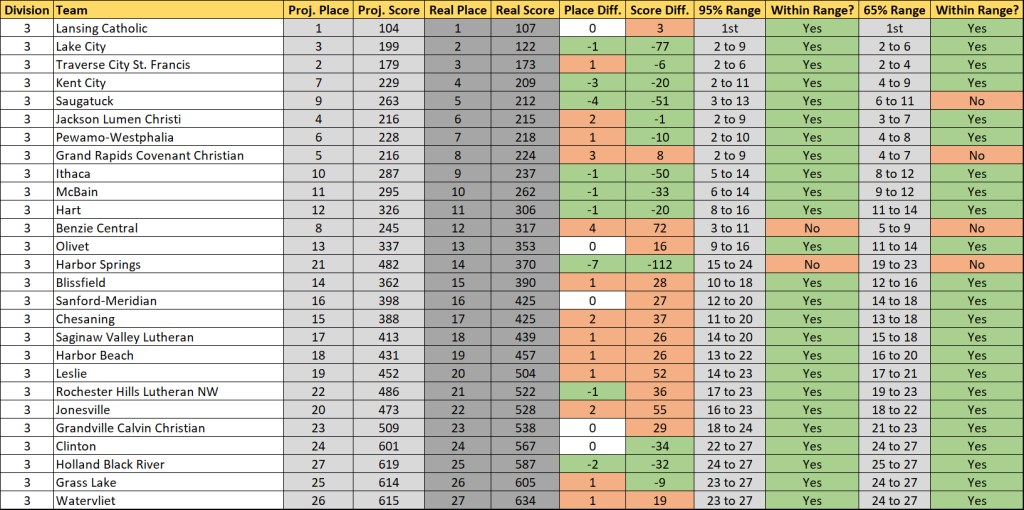
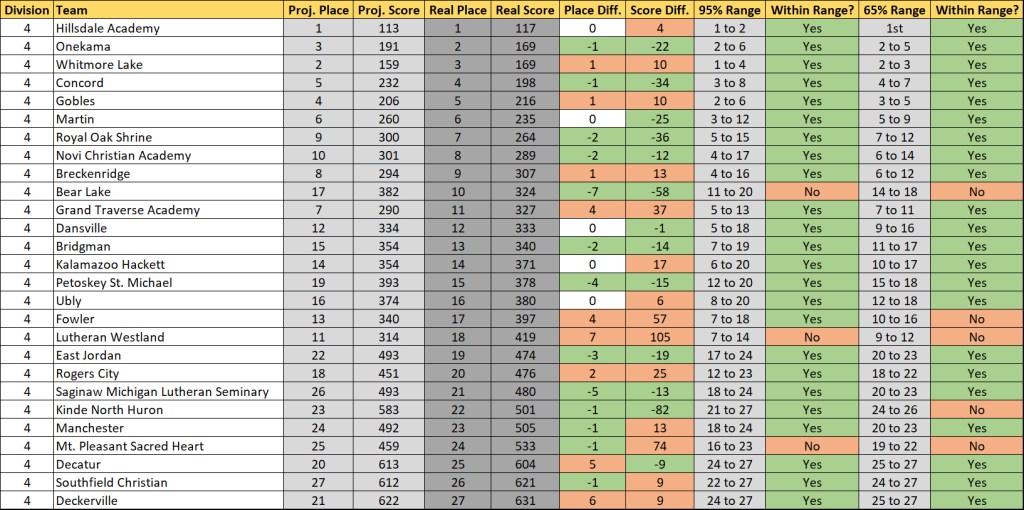
Before I get deep into analysis, highlighting the many deserving kids and teams from yesterday, some charts that show who proved the projections wrong.
In the More Predictions and Expected Outcomes post from Saturday, I outlined just how many projections I’d look to be “right” based on their percentages.
For the team champions, that was 6.63 teams. In reality, 5 teams were correct. Meh performance from MIXC.
For the podium teams, expectation was to be correct on 12.8 teams. In reality, 10 teamswere correct. Another ho-hum performance from MIXC.
For the top-10 teams, I wanted to be right on 70 teams. The projections nailed 71 teams. This is pretty good!
The projected ranges bring in anything but the outliers, the middle 95% and 65% of the places a team could get. The expectation is then that those would be correct on 95% and 65% of the teams. They were correct on 91.4% of the teams and 70% of the teams. Not the greatest, but okay.
You can also track the average place difference between the projections and reality. That was 2.27 places this year. Much lower than anything pre-2024, but not as accurate as the previous two years.
Overall, I’d give the projections a B- (which was kinda like my grades!). If the projections were completely accurate on everything ever, there’d be so few stories, teams, and individuals to highlight. I’m always motivated too, looking to return to 2025 levels. So you’re stuck with me for another year.
With MITCA on the horizon and much time spent there, more writeups will come in future weeks. We’ll hopefully see you in Shepherd on Saturday.
If I told you that after Saturday, the Michigan Wolverines would have a 40% chance of beating Michigan State, a 10% chance of beating Oregon, a 20% chance of beating UCLA, and a 10% chance of beating Ohio State – the expectation would be that they’d win 1 game. Yes, they’d be underdogs in each, but 0.4 + 0.1 + 0.2 + 0.1 = 0.8, which is closer to 1 than 0. Yes, they’re that bad and will hopefully move on from a coach who looks like he’s had a deer in the headlights all fall.
With odds given to the winners, podium, and top-10, I don’t expect to be 100% correct on every projection ever. We saw this in the regional setting, where the expectation was that I’d predict 199 of the top-3 teams. I was correct on 197 of ‘em, within 1%. If that latter number was well above 200, then I wasn’t favoring the favorites enough, if it were much lower, the same can be said for the underdogs.
Anyhow, adding the percentages of the winners gives 6.63 teams, the podium 12.8, the top-10 70.3, and 192 of the potential 240 All-Staters. In essence, the projections will be accurate if they’re wrong on 1-2 winning teams, 3 podium teams, 10 top-10 teams, and 48 All-State earners.
Projected All-State Cutoffs
Running race simulations, one can project everything that’s been shown, and it can also show where 30th place lies in each race. The average ratings of the 30th place finishers were:
Peering at the weather, I’d expect the course to run a little slower than in previous years, but not overwhelmingly so. I’d guess the adjustment will be around +15, which would make the projected 30th place times:
Obviously, heed your coach’s strategy over these times. And if the weather suddenly turns horrific, block these out of your memory. These are all a prediction that I’m posting beforehand.
Looking Back to Summer
I take a little pride in the summer previews being close to correct. I’m still gonna write ‘em, cause how better to keep the sport at the attention of many than to constantly give coverage, but they’ve gotta be somewhat accurate along the way. From 2019 to 2025, I’ve been 33/56 on predicting the state champion.
2026’s Summer Preview had:
Division 1 Boys: Ann Arbor Skyline Division 2 Boys: Holland Christian Division 3 Boys: Saugatuck Division 4 Boys: Holland Calvary Christian
Division 1 Girls: Ann Arbor Pioneer Division 2 Girls: Holland Christian Division 3 Girls: Lansing Catholic Division 4 Girls: Hillsdale Academy
Last season was rough (but gave for some great stories). Hopefully the trend flips, however if not, I guess I’ll have a ton of winter writing.
In Closing
This is the culmination of training, preparing, parenting, coaching, and guiding for you. This is the end of writing and projecting for me. I’ll be out there tomorrow in my traditional Speed Rating shirt. If you see me, say hi, understand that I probably won’t recognize you, so just introduce yourself! It’ll be a blast for us all, collectively watching or participating in the greatest sport in the world.
State Week has arrived. Just as previous weeks and the Regional Projections, you get a ton of math and a little preview. Simulations and odds and stats and projections are the vehicle for talking about the best sport in the world, which will be on display Saturday at MIS.
An explanation from previous years that still holds true:
Through a season’s worth of speed ratings, one can determine a runner’s average rating and the variability of those ratings. Both those factors are then weighed towards more recent meets, which are then simulated thousands of times using a Monte Carlo analysis (also described by TullyRunners here). Over those thousands of race simulations, one can determine a team’s average place and average score, a runner’s average place, odds on winning, and odds on qualifying.
These are useful in cross country scenarios, where you have consistent runners and those who are a bit more up and down. For example:
Tanner Time
Tanner Rating
Tanner Avg.
Tanner StDev.
15:30
210
15:45
205
16:00
200
16:15
195
16:30
190
200
7.91
MIXCSR Time
MIXCSR Rating
MIXCSR Avg.
MIXCSR StDev.
16:09
197
16:12
196
16:15
195
16:18
194
16:21
193
195
1.58
Jacob at his best might be faster than I in four of the five races during the season. I’d almost never be All-State in Division 1, but he might contend for a top-5 spot or place 60th.
If we did 20 simulations, this is how it might turn out:
Race
Tanner Avg.
Tanner StDev
Tanner Rating
MIXCSR Avg.
MIXCSR StDev
MIXCSR Rating
1
200
7.9
202.1
195
1.6
195.6
2
200
7.9
196.2
195
1.6
194.1
3
200
7.9
190.0
195
1.6
199.2
4
200
7.9
193.4
195
1.6
192.5
5
200
7.9
206.8
195
1.6
195.7
6
200
7.9
201.8
195
1.6
196.1
7
200
7.9
171.6
195
1.6
194.9
8
200
7.9
189.2
195
1.6
195.9
9
200
7.9
205.5
195
1.6
197.0
10
200
7.9
203.8
195
1.6
192.6
11
200
7.9
192.3
195
1.6
196.5
12
200
7.9
196.9
195
1.6
196.4
13
200
7.9
198.5
195
1.6
195.6
14
200
7.9
203.2
195
1.6
194.1
15
200
7.9
193.9
195
1.6
192.6
16
200
7.9
199.3
195
1.6
193.2
17
200
7.9
208.7
195
1.6
194.2
18
200
7.9
213.7
195
1.6
194.6
19
200
7.9
212.6
195
1.6
197.1
20
200
7.9
206.3
195
1.6
193.9
I’d win four times, but I’d never have the ability to win a title like he had in Race 18. He’s usually All-State, but may cost his team a title through his effort in Race 7.
The simulations give the possibilities of those scenarios and all the various scoring scripts. A sixth girl that can pop off on any certain day, a reliable boy who always runs 17-flat, you name it. Hopefully, they better elucidate our contenders, qualifiers, and how these races play out over the weekend.
The regional projections were pretty solid this year. Adding up all the odds from the projected top-3 teams, you’d get 199 correct qualifiers. There were 197, essentially coming within a percentage point.
A change I made last year to shore up the projections was to filter out less important meets. These conference and weekday meets are great for building the database and showing the development of athletes who may not even run at the regional level, but they often are home to a runner’s slower efforts. All the important weekend meets are included. This same methodology is present here in 2026. One thing I noticed from looking back at ’25 is that early season meets weren’t adjusted highly enough. That has changed for 2026, although I’m not sure it’ll be a huge factor as those meets aren’t weighted that heavily at this point in the season.
The entries reflect those that are listed on athletic.net.
1000 simulations were run, which allows for various stats and odds to be calculated. I have a bunch listed, more than ever before:
Proj. Place = sorting from the lowest average score to the highest Avg. Score = the average team score across all simulations Win% = odds that a team will win Podium % = odds that a team will receive a trophy Top-10% = odds that a team will place in the top-10 95% Range = 95% of the outcomes will fall in this range, so for each division there should be around one outlier. I’d call this a fully confident chance. 65% Range = 65% of the outcomes will fall in this range, so for each division there should be around ten outliers. I’d call this a solid bet. Podium Order % = the odds that the top-2 will fall in exactly that order Top-5 Order % = the odds that the top-5 will fall exactly in that order
I also have an individual’s odds of winning and receiving All-State, though I’ll decline to post those until afterward.
As always, enjoy the writings. May they be a boost of confidence or a spur of motivation. Either way, they’re done out of love for the great competitors in Michigan. I’ll see you on Saturday.
BOYS TEAM
Back in August at the culmination of the Summer Preview, the thought was we might have new blood at the top of Division 1. Ann Arbor Skyline headed the pre-season list, a slight favorite for a new champion. One part was correct – there might be a changing of the guard. Another was vastly incorrect – many teams have entered the fray.
At various points in the fall, outfits from Jenison, Ann Arbor Skyline, Brighton, and Traverse City West have stated their claim for D1 supremacy.
Kicking off the year hot was Jenison, the Wildcats heading east to Northville to tackle the non-stop hills at Cass Benton. Jenison’s top-five men all covered the course in 16:45 or faster, a great omen for the rest of their season.
Traverse City West’s Titans met the Wildcats at Ottawa Hills, a true early season clash. Late in the day at Riverside, the TCW top-two were able to bring forth a gap, then the TCW depth was able to hold off Jenison.
A week later on the mud-soaked Holly hills, Ann Arbor Skyline and Brighton had their own battle, a close contest with a three-point separation, caused by Brighton’s excellent mid-pack racing.
A week later, surely motivated by the close defeat, Skyline took to much nicer conditions at Sharp Park. The Eagles unleashed what may have been the best team performance of the season, their top-five averaging a 15:40, all scorers sub-16 on the historic Jackson course.
At the end of the regular season, these four units descended upon Portage for a State preview. Through a mile, Skyline took an early lead. During the mid-section of the race, Brighton began to take over, climbing to a slight lead over Traverse City West. Over the final mile of the Portage West MS course, the Bulldogs extended their lead, setting the stage for state heroics and daring anyone to come after the black n’ orange.
Proj. Place
Team
Proj. Score
Win %
Podium %
Top-10 %
1
Jenison
156
27
65
95+
2
Brighton
160
33
57
95+
3
Ann Arbor Skyline
173
21
42
95+
4
Traverse City West
180
18
33
95+
5
Midland
249
2
94
6
Saline
295
69
7
Salem
299
67
8
Lowell
299
61
9
Kalamazoo Central
301
61
10
Northville
305
61
11
East Kentwood
313
60
12
Grand Ledge
337
32
13
Lake Orion
342
28
14
Caledonia
343
29
15
Highland-Milford
363
8
16
Dexter
373
18
17
Rockford
411
7
18
Traverse City Central
415
19
Romeo
454
20
White Lake Lakeland
464
21
Novi
468
22
Ann Arbor Pioneer
482
23
Rochester
512
24
Plymouth
520
25
Clarkston
548
26
Livonia Stevenson
575
27
Wyandotte Roosevelt
661
Proj. Place
Team
95% Range
65% Range
1
Jenison
1 to 4
1 to 3
2
Brighton
1 to 5
1 to 4
3
Ann Arbor Skyline
1 to 6
1 to 4
4
Traverse City West
1 to 6
1 to 4
5
Midland
3 to 12
5 to 8
6
Saline
4 to 16
6 to 12
7
Salem
5 to 16
6 to 12
8
Lowell
4 to 16
6 to 13
9
Kalamazoo Central
5 to 16
6 to 13
10
Northville
4 to 17
6 to 14
11
East Kentwood
5 to 18
7 to 13
12
Grand Ledge
6 to 19
9 to 15
13
Lake Orion
7 to 18
9 to 16
14
Caledonia
6 to 19
9 to 16
15
Highland-Milford
9 to 19
12 to 17
16
Dexter
6 to 22
10 to 18
17
Rockford
8 to 24
14 to 20
18
Traverse City Central
11 to 22
15 to 20
19
Romeo
12 to 25
17 to 23
20
White Lake Lakeland
15 to 25
18 to 22
21
Novi
14 to 26
18 to 24
22
Ann Arbor Pioneer
15 to 26
19 to 24
23
Rochester
19 to 25
21 to 24
24
Plymouth
18 to 26
21 to 25
25
Clarkston
19 to 26
23 to 26
26
Livonia Stevenson
18 to 27
23 to 26
27
Wyandotte Roosevelt
25 to 27
27th
The model sees Jenison as a slight favorite over Brighton, with Ann Arbor Skyline and Traverse City West barely trailing the two. Jenison has run at a consistently high level all season long, which gives the Wildcats a high floor and very few scenarios where they finish far down the standings. Skyline perhaps has the highest ceiling, Traverse City West blending the two. Brighton has the big wins.
This is a wide open race, rarely seen at the MHSAA championship level. Commonly, there’s a favorite or two teams in true contention. The teams aren’t that far off in their characteristics. Traverse City West is likely the strongest up front. Jenison has found a four-deep pack at the front, combined with a fifth runner among the state’s most steady. Brighton and Skyline spread their advantages all throughout their lineup, each spot hardly rivaled in comparison to others throughout the state.
As I’ve done with other divisions, I’ll throw out race numbers that produced different champions:
Race #25 went to Skyline. The Eagles conquered TCW’s top-two, held serve with Jenison’s depth, and Brighton had an off race.
Race #250 went to Brighton. The Bulldogs overwhelmed the field early, placing four boys in the top-40, making XC math easily work out in their favor.
Race #670 was had by Jenison. The Wildcats used a similar strategy to Brighton, placing four in the top-40. Their fifth wasn’t the fastest in the field, but he didn’t tumble down the leaderboard.
Race #991 went the way of Traverse City West. The Titans took their momentum from the Delta College regional and applied it to MIS, running in a very similar manner. Serious strength up front, their depth close behind.
A hidden factor always to consider, where the rest of the field fits. How these teams navigate packs and bubbles will play a major role, especially with these small margins. Every place will matter.
Podium Order
Podium Order %
1. Brighton, 2. Jenison
18.7
1. Jenison, 2. Brighton
11.5
1. Ann Arbor Skyline, 2. Jenison
10.6
1. Jenison, 2. Ann Arbor Skyline
8.3
1. Traverse City West, 2. Jenison
8.2
1. Brighton, 2. Ann Arbor Skyline
7.5
1. Ann Arbor Skyline, 2. Brighton
7.3
1. Brighton, 2. Traverse City West
5.8
1. Jenison, 2. Traverse City West
5.7
1. Traverse City West, 2. Brighton
5.6
1. Traverse City West, 2. Ann Arbor Skyline
4.4
1. Ann Arbor Skyline, 2. Traverse City West
3.3
Top-5 Order
Top-5 Order %
1. Brighton, 2. Jenison, 3. Ann Arbor Skyline, 4. Traverse City West, 5. Midland
2.7
1. Ann Arbor Skyline, 2. Brighton, 3. Jenison, 4. Traverse City West, 5. Midland
2
1. Traverse City West, 2. Jenison, 3. Brighton, 4. Ann Arbor Skyline, 5. Midland
2
1. Brighton, 1. Jenison, 3. Traverse City West, 4. Ann Arbor Skyline, 5. Midland
1.7
1. Ann Arbor Skyline, 2. Jenison, 3. Brighton, 4. Traverse City West, 5. Midland
1.5
1. Jenison, 2. Brighton, 3. Ann Arbor Skyline, 4. Traverse City West, 5. Midland
1.5
1. Jenison, 2. Brighton, 3. Traverse City West, 4. Ann Arbor Skyline, 5. Midland
1.5
1. Brighton, 2. Ann Arbor Skyline, 3. Jenison, 4. Traverse City West, 5. Midland
1.5
1. Traverse City West, 2. Brighton, 3. Jenison, 4. Ann Arbor Skyline, 5. Midland
1.5
1. Jenison, 2. Ann Arbor Skyline, 3. Brighton, 4. Traverse City West, 5. Midland
1.4
1. Brighton, 2. Jenison, 3. Ann Arbor Skyline, 4. Midland, 5. Traverse City West
1.3
1. Brighton, 2. Jenison, 3. Ann Arbor Skyline, 4. Traverse City West, 5. Salem
1.1
GIRLS TEAM
Winning is hard, repeating might be tougher. Having experience at the latter can be key when transitioning to a new year with many of the same faces. In 2026, Ann Arbor Pioneer has embraced those circumstances. Natasza Dudek, with her season that could lengthen into December, began her fall campaign later than most. That late opening led to new faces to conquer races. Keira Von Blon has embraced her newfound frontrunnin’ role, winning early at Holly and Centerville, then blasting into the 16’s this past week. Sienna Klemmer opened the season crossing the tape at Benzie, racing to the first sub-17 of her career. Development amongst the depth has also occurred, with Eliza Selcer dropping a minute over the past year, on the cusp of breaking into the 18’s. New challenges allow for growth, which the Pioneers have surely done.
Proj. Place
Team
Proj. Score
Win %
Podium %
Top-10 %
1
Ann Arbor Pioneer
86
95+
95+
95+
2
Northville
168
73
95+
3
Ann Arbor Skyline
191
25
95+
4
Romeo
228
2
95+
5
Portage Central
262
95+
6
Rochester Adams
269
95+
7
Hudsonville
278
95+
8
Brighton
366
48
9
Saline
371
33
10
White Lake Lakeland
376
30
11
Hartland
376
35
12
Dexter
378
33
13
Rockford
384
24
14
Novi
386
26
15
Brownstown Woodhaven
396
14
16
Howell
410
20
17
Midland Dow
426
8
18
Holland West Ottawa
432
4
19
Macomb Dakota
435
20
Grand Haven
438
8
21
Utica
438
3
22
Jenison
453
6
23
Traverse City Central
456
24
Traverse City West
458
5
25
Richland Gull Lake
493
26
Clarkston
526
27
Berkley
605
28
Grosse Pointe South
663
29
Salem
687
Proj. Place
Team
95% Range
65% Range
1
Ann Arbor Pioneer
1st
1st
2
Northville
2 to 4
2 to 3
3
Ann Arbor Skyline
2 to 5
2 to 3
4
Romeo
3 to 6
4 to 5
5
Portage Central
4 to 8
5 to 7
6
Rochester Adams
3 to 9
5 to 7
7
Hudsonville
4 to 8
5 to 7
8
Brighton
7 to 20
8 to 15
9
Saline
7 to 18
9 to 15
10
White Lake Lakeland
8 to 20
9 to 15
11
Hartland
7 to 21
9 to 17
12
Dexter
8 to 21
9 to 17
13
Rockford
8 to 21
10 to 17
14
Novi
8 to 23
10 to 18
15
Brownstown Woodhaven
8 to 22
11 to 18
16
Howell
7 to 25
10 to 22
17
Midland Dow
8 to 25
13 to 22
18
Holland West Ottawa
10 to 25
15 to 22
19
Macomb Dakota
11 to 25
16 to 22
20
Grand Haven
9 to 26
13 to 24
21
Utica
10 to 25
15 to 23
22
Jenison
9 to 26
15 to 25
23
Traverse City Central
11 to 26
17 to 24
24
Traverse City West
9 to 26
17 to 25
25
Richland Gull Lake
18 to 26
22 to 25
26
Clarkston
13 to 27
23 to 26
27
Berkley
26 to 28
27 to 27
28
Grosse Pointe South
27 to 29
28 to 29
29
Salem
27 to 29
28 to 29
Cross country math is a beautiful subject area. With Natasza Dudek, Keira Von Blon, and Sienna Klemmer climbing to the top of the leaderboard in every race, the math becomes simple. Their single-digit points, plus two other Pioneer competitors. This creates a high floor! Even if Pioneer had the lowest-placing runners in the remainder of the field, they’d end up around 400 points, typically good enough for a 15th place finish. The trouble for the 28 other teams toeing the line on Saturday afternoon is that Pioneer has more than capable depth pieces. The 4th-7th girls from the purple-clad crew have all had fast moments of glory, all with SB’s at 19:15 or faster. This creates a tough math equation for the rest of the field, as there aren’t enough points to gain at the most consequential spots in the lineup.
A fun battle however might be for the second podium spot. Ann Arbor Skyline and Northville have each had moments that show they deserve to step on that stage. For Skyline, that came at Jackson, where all five scoring Eagles crossed the line under 18:50, giving their crosstown rivals some serious run. Skyline hasn’t replicated that since, but they showed last November that they can surprise on the state platform, thus I wouldn’t count the west Ann Arbor crew out. The apex of the Mustang season thus far may have been at Portage. The emerging Brynn Somers gives such an advantage, allowing Northville to score miniscule points at a spot where a majority of the competitors score much more. Her 18:09 there was good for 11th place, one of three Mustangs near the front, leading to a runner-up placing behind Pioneer and ahead of Skyline.
Podium Order
Podium Order %
1. Ann Arbor Pioneer, 2. Northville
72.2
1. Ann Arbor Pioneer, 2. Ann Arbor Skyline
25.3
1. Ann Arbor Pioneer, 2. Romeo
1.8
Top-5 Order
Top-5 Order %
1. Ann Arbor Pioneer, 2. Northville, 3. Ann Arbor Skyline, 4. Romeo, 5. Portage Central
18
1. Ann Arbor Pioneer, 2. Northville, 3. Ann Arbor Skyline, 4. Romeo, 5. Rochester Adams
12.8
1. Ann Arbor Pioneer, 2. Northville, 3. Ann Arbor Skyline, 4. Romeo, 5. Hudsonville
8.7
1. Ann Arbor Pioneer, 2. Ann Arbor Skyline, 3. Northville, 4. Romeo, 5. Portage Central
6.8
1. Ann Arbor Pioneer, 2. Northville, 3. Ann Arbor Skyline, 4. Portage Central, 5. Romeo
5.7
1. Ann Arbor Pioneer, 2. Northville, 3. Ann Arbor Skyline, 4. Rochester Adams, 5. Romeo
5.2
1. Ann Arbor Pioneer, 2. Ann Arbor Skyline, 3 Northville, 4. Romeo, 5. Rochester Adams
4.4
1. Ann Arbor Pioneer, 2. Northville, 3. Romeo, 4. Ann Arbor Skyline, 5. Portage Central
3.9
1. Ann Arbor Pioneer, 2. Ann Arbor Skyline, 3. Northville, 4. Romeo, 5. Hudsonville
3.3
1. Ann Arbor Pioneer, 2. Northville, 3. Romeo, 4. Ann Arbor Skyline, 5. Rochester Adams
3.3
BOYS INDIVIDUAL
It’s coming to a head on the grass for the vaunted 2027 class. This group of senior harriers has accomplished so much. Combined with the elites of other divisions, they’ve brought forth:
8 sub-15’s on the cross course this fall
7 sub-1:55 800m athletes
17 sub-4:20’s in the 1600m this past spring
13 sub-9:15’s over eight laps in the 3200m
Some reside in other divisions – Bobby Jazwinski, Hunter Eaton, Ezekiel Baltierra to name a few.
Most compete here in D1, all in contention for this victory. Anyone can make a case, all with strong resumes and positive past experiences. We’ve got:
Kamari Ronfeldt – the defending champion, sub-15 in each of the past three seasons, coming off his fastest mark of the season
Caden Livermore – unbeaten on the year, owner of the fastest time in D1, capable of contending in the 1600m all the way to the 5k
Jack MacGregor – defending indoor 3200m champion, 3x Region 4 winner
Brandon Cloud – defending 3200m outdoor champion who always brings another gear for the State Finals
Luka Hammond – twice the 1600m champion, owner of the fastest 3200m mark from the spring season
Samuel Baker – twice All-State, Region 3 and SMAC Champion that went sub-15 at Portage
Marshall Huhn – sub-15 at Ottawa Hills, runner-up to Baker last week
Matii Tarekegn – recent addition to this elite level, enough massive improvement to notch two sub-15’s this fall.
This all doesn’t even mention those who will be here for a little longer. Xavier Solgot dropped a 14:55 to win Region 9. He also proved last fall that he can jump up a level at MIS. Archer VerHage is on a path to becoming our next great miler, though he’s taken a detour to extend his range to cross, barely trailing Livermore and Hammond to run a 14:51 at the OK Red Final. This past spring, ranking as Michigan’s top 1600m and 3200m amongst 10th graders was Gavin Katic, who’s backed it up on the cross courses with multiple low-15’s and a Region 2 win.
Many contenders with one final run, a few with the juice to upend the hegemony. We’re in for a treat.
Proj. Place
Grade
Name
Team
Avg. Place
1
12
Caden Livermore
Grandville
1.9
2
12
Jack MacGregor
Howell
4.8
3
12
Kamari Ronfeldt
Ann Arbor Pioneer
5.0
4
12
Luka Hammond
Grand Haven
5.6
5
12
Samuel Baker
Kalamazoo Central
7.7
6
12
Brandon Cloud
Northville
8.4
7
12
Matii Tarekegn
East Kentwood
9.6
8
10
Archer VerHage
Grand Haven
9.7
9
12
Marshall Huhn
Lowell
11.0
10
11
Gavin Katic
Fenton
12.3
11
12
Austin Mercado
Salem
13.4
12
12
Jacob Szalay
Saline
13.8
13
11
Xavier Solgot
L’Anse Creuse North
16.5
14
12
Liam Wierzba
Traverse City West
19.0
15
12
Logan Gessford
Midland
22.8
16
12
Justin Johnson
East Kentwood
22.9
17
11
Sean Thompson
Caledonia
25.6
18
11
Alexander Allen
Alpena
26.1
19
11
Cooper McNaughton
Clarkston
26.3
20
11
Mourad Algahmi
Dearborn Fordson
27.5
21
11
Roman Stilwell
Ann Arbor Skyline
31.0
22
10
Grant Kulesza
Brighton
32.7
23
10
Tanner Smith
Zeeland West
34.6
24
12
Coen Hill
Dexter
34.9
25
11
Finn Frost-Grayson
Traverse City West
35.4
26
11
Caleb Conner
Jenison
36.5
27
11
Kilian Boulware-Lopez
East Lansing
37.7
28
12
Ethan Burks
Jenison
39.5
29
11
Chase Sherman
Jenison
42.6
30
11
Carter Cooke
Jenison
43.1
31
11
Marcus Essling
Portage Central
43.2
32
12
Nick Martens
Dexter
44.4
33
11
Johnathan Elsea
Mount Pleasant
45.2
34
11
Lucas Campbell
Rochester
45.4
35
11
Nikhil Ball
South Lyon East
46.3
36
12
Jack Hanner
Salem
46.5
37
10
Josh Keillor-Beale
Brighton
47.2
38
11
Karson Lewis
Battle Creek Lakeview
47.7
39
10
Jackson Pant
Richland Gull Lake
47.7
40
11
Rylen Richey
Grand Ledge
48.5
41
12
Caelan Marsh
Grand Ledge
48.6
42
12
Colin Stawasz
Lowell
48.7
43
10
Aiden Doggett
Highland-Milford
48.9
44
12
Devin Lau
Farmington
50.5
45
10
Tucker Asman
Brighton
50.8
46
11
Luke Bultman
Rockford
52.1
47
12
Cody Bromley
Lowell
52.9
48
12
Connor O’Reilly
Davison
53.5
49
11
Martin Gehrke
Ann Arbor Skyline
53.8
50
9
Cody Lam
Kalamazoo Loy Norrix
54.4
51
11
Rem Piper
Holt
56.2
52
11
Todd Tobin Jr
Highland-Milford
57.5
53
12
Emmet Gardella
Detroit U-D Jesuit
59.3
54
11
Roarke MacArthur
Brighton
59.4
55
10
Tommy McCormick
Grand Blanc
61.5
56
11
Elijah Demlow
Battle Creek Lakeview
62.3
57
11
Aidan Schwalbach
Rochester Hills Stoney Creek
63.8
58
11
Oskar MacArthur
Ann Arbor Skyline
63.9
59
10
Lucas Naspinsky
White Lake Lakeland
64.1
60
11
Wes Rogan
Saline
65.1
61
11
Brady Glon
Detroit Catholic Central
65.9
62
10
Hudson Doll
Ann Arbor Skyline
66.0
63
12
Trevor Baptist
Novi
66.7
64
12
Aduet (Jimma) Atem
East Kentwood
67.6
65
11
Elliot King
Midland
68.3
66
10
Bryson Hassevoort
Zeeland West
68.6
67
10
Wyatt DelValle
Gibraltar Carlson
69.2
68
11
Wesley LaFever
Macomb Dakota
70.6
69
11
Lucas Brumo
Livonia Stevenson
71.5
70
9
Braden Millar
Northville
75.4
71
11
Brendan Williams
Brighton
75.7
72
12
Brady Winther-MacInnis
Kalamazoo Central
76.2
73
12
Samuel Batt
Salem
77.9
74
12
Austin Taft
Traverse City West
78.7
75
11
Ricardo Guajardo
Lake Orion
79.9
76
12
Matthew Guikema
Ann Arbor Skyline
82.7
77
11
Pascal Rasmussen
Saginaw Heritage
83.1
78
9
Hans Templeton
Jenison
83.8
79
10
Emmett Duggar
Traverse City West
85.5
80
11
Adam Shorb
Portage Northern
86.1
81
11
Joseph DuGuay
Traverse City Central
86.2
82
10
Alex Pelliccia
Midland
87.3
83
10
Luis Nava
Lake Orion
88.7
84
11
Asa Konwinski
Troy
91.3
85
12
Nolan Lounds
Grand Ledge
91.3
86
12
Evan Fox
Traverse City Central
91.5
87
9
Jack Klein
White Lake Lakeland
92.8
88
10
Austin Hughes
Traverse City West
93.7
89
12
Vincent Jones
Brownstown Woodhaven
95.2
90
11
Bradley Chesney
Midland
99.6
91
12
Garrett Comer
Ann Arbor Skyline
101.5
92
11
Colby Bartells
Kalamazoo Central
103.1
93
11
Manny Coates
Northville
103.3
94
12
Josiah Derksen
Rockford
103.3
95
10
Davin MacDonald
Ann Arbor Skyline
103.6
96
12
Bradley Smies
Hudsonville
104.4
97
10
Avery Clinton-Barnett
Lake Orion
106.6
98
10
Jaden Hill
Allen Park
108.9
99
9
Dane Jadallah
Plymouth
109.2
100
11
Zachary Greene
Wyandotte Roosevelt
110.8
GIRLS INDIVIDUAL
Returning to the epicenter of Division 1 girls running is state champion, MIS record holder, and national champion – Natasza Dudek.
Dudek set fire to this course last year, kicking the race off with a torrential pace, hitting the mile at 5:09. At two, she’d barely let up, splitting 10:28, coming through with a 30+ second margin over the field. By the finish, she had crossed the course in 16:09, nearly 20 seconds faster than the previous record (set by former Pioneer legend, Rachel Forsyth). The record-breaking day was one just notch in the history book, as her season extended into December, culminating in crowns at NXN and at Brooks Nationals.
Given the prospect of a season that might finish in over a month’s time, her racing schedule has been lightened. She’s raced five times, each finishing time of the sub-17 variety. What’s remarkable has been her consistency – from the four major meets, her speed ratings have all been between 186 and 187. A seriously high level that has rarely been hit amongst the history of this site.
This all seems normal, which speaks volumes of her accomplishments to date. We have to remind ourselves that these 16:xx efforts are rare, state records typically don’t drastically falter, that national champions aren’t an everyday occurrence. That’s a tough task with which Natasza has continually brought to the table.