Regional Week is here! All week, I’ll be posting these projections. I’ll start with the Friday regions, then work on the Saturday ones.
These are a bit different than they’ve been in the past. I’m trying to project as always, but changing it up a bit in terms of the methodology. In the past, I’ve just sorted out by the ratings, then scored as if they’re a cross country meet. Here, I’m doing the same thing, but running simulations. Essentially, given a runner’s ratings and the variance in their ratings throughout the season, I’m able to generate a large sample of “races” and not just one scenario. The thought is that this will give a better depiction of what may occur. If an athlete is consistent, that will be represented. If an athlete is polarizing, but has a chance at greatness, that will be represented. Both aren’t possible when just throwing out one race. The Macomb County projections were done in the same manner and TullyRunners explains it here.
By simulating many races, I can hand out odds and percentages as well. The team projections have odds of winning and odds of placing in the top three. The individual ones have an athlete’s average place. I do have odds on an athlete winning and getting top-15, but I’m not gonna post that ahead of time. Maybe after and we can see who came through in a huge way on the huge stage.
What I’ve learned from the past is that I write way too much in the previews early in the week, then worry I’ll run out of time mid-week, running on fumes and puttering out by Thursday. The writing is the time-consuming part, the maths are actually easy. I’ll save the writing chops for next week, where penning four previews is easier on the brain than thirty-six.
Always remember, races aren’t run on paper or on a computer. These are meant to better our sport, give more attention where little is given. Although I take pride in their accuracy, this endeavor would be quite boring if it were always perfect. I look forward to these being proven wrong and I expect to hear about it as well.
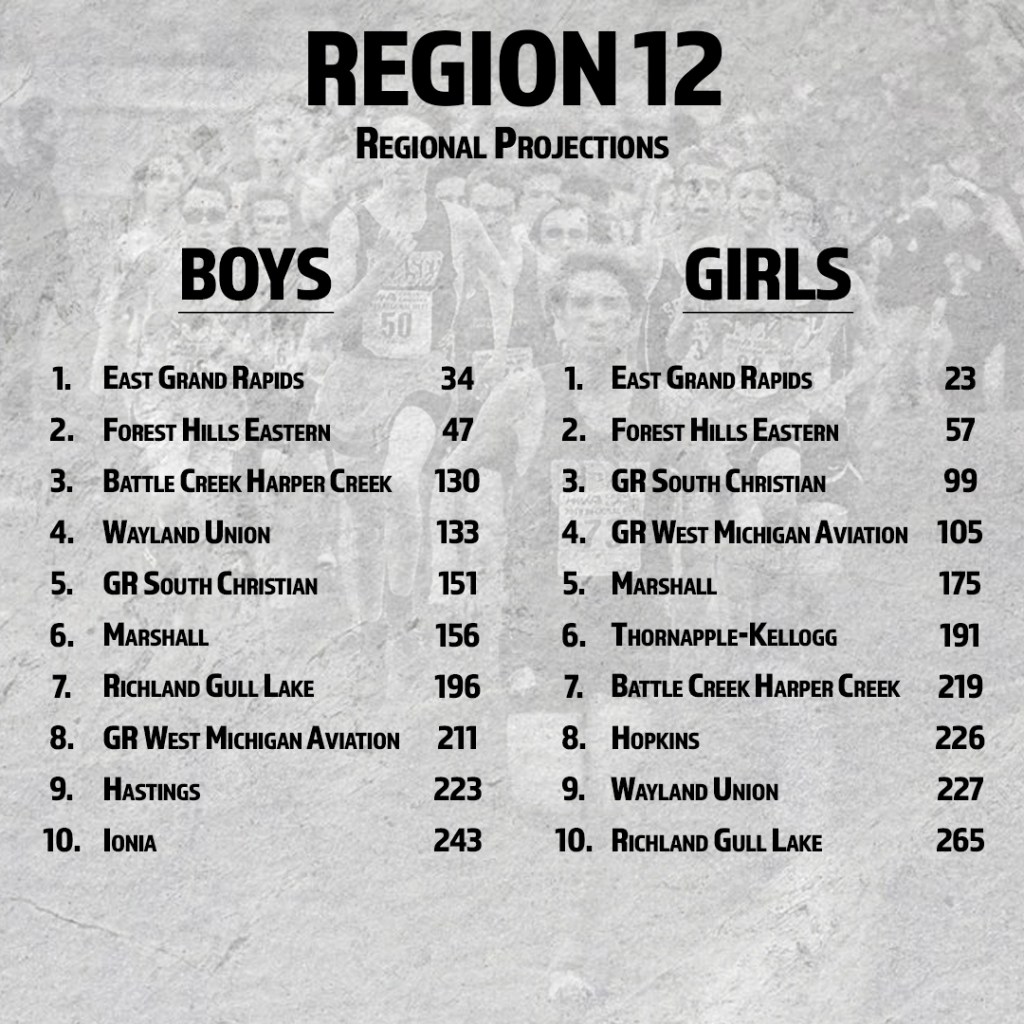
Boys
| Place | Team | Avg. Score | Win % | Top 3 % |
| 1 | East Grand Rapids | 34 | 92 | 95+ |
| 2 | Forest Hills Eastern | 47 | 8 | 95+ |
| 3 | Battle Creek Harper Creek | 130 | 59 | |
| 4 | Wayland Union | 133 | 39 |
| Place | Grade | Name | Team | Avg. Place |
| 1 | 12 | Aiden Sullivan | Forest Hills Eastern | 1.02 |
| 2 | 11 | Ryan Brinker | East Grand Rapids | 2.23 |
| 3 | 11 | Alex Thole | East Grand Rapids | 3.49 |
| 4 | 12 | Caleb Boes | Grand Rapids South Christian | 5.41 |
| 5 | 12 | Elijah Robinson | East Grand Rapids | 5.45 |
| 6 | 10 | Dominic Lowrie | Battle Creek Harper Creek | 6.90 |
| 7 | 9 | Jonah Workman | East Grand Rapids | 7.60 |
| 8 | 11 | Brendan Hoving | Forest Hills Eastern | 8.78 |
| 9 | 12 | Devin Weaver | Wayland Union | 11.89 |
| 10 | 12 | Jack DeVries | GR West Michigan Aviation | 12.23 |
| 11 | 12 | Alex Parker | Forest Hills Eastern | 12.59 |
| 12 | 10 | Jack Bidwell | Marshall | 12.87 |
| 13 | 12 | Joseph VanderKooi | Grand Rapids South Christian | 12.96 |
| 14 | 11 | Liam Hinman | Forest Hills Eastern | 13.55 |
| 15 | 10 | Henry Dixon | Forest Hills Eastern | 14.23 |
| 16 | 11 | Cooper Jacobsen | Forest Hills Eastern | 14.53 |
| 17 | 11 | Davis Christy | East Grand Rapids | 15.49 |
| 18 | 11 | Jacob Montgomery | Ionia | 16.99 |
| 19 | 11 | William O’Dell | Battle Creek Harper Creek | 19.38 |
| 20 | 11 | Maxwell McCarty | Belding | 19.64 |
| 21 | 10 | Dylan Pallett | Wayland Union | 20.44 |
| 22 | 11 | Brian O’Dell | Battle Creek Harper Creek | 21.71 |
| 23 | 12 | Wyatt McComb | Richland Gull Lake | 23.32 |
| 24 | 12 | Davis Head | East Grand Rapids | 24.06 |
| 25 | 12 | Ryan McMahon | East Grand Rapids | 24.79 |
| 26 | 11 | Riley Shults | Hastings | 25.38 |
| 27 | 11 | Lucas Van Meter | Middleville Thornapple-Kellogg | 28.39 |
| 28 | 11 | Tate Miller | Forest Hills Eastern | 28.77 |
| 29 | 12 | Travis Koon | Wayland Union | 29.12 |
| 30 | 11 | Connor Griffith | Marshall | 29.13 |
Girls
| Place | Team | Avg. Score | Win % | Top 3 % |
| 1 | East Grand Rapids | 23 | 95+ | 95+ |
| 2 | Forest Hills Eastern | 57 | 95+ | |
| 3 | Grand Rapids South Christian | 99 | 76 | |
| 4 | GR West Michigan Aviation | 105 | 24 |
I swear, I didn’t plan those average places from the Lynn twynns.
| Place | Grade | Name | Team | Avg. Place |
| 1 | 11 | Drew Muller | East Grand Rapids | 1.00 |
| 2 | 10 | Sadey Seyferth | East Grand Rapids | 3.39 |
| 3 | 11 | Addison Washler | Forest Hills Eastern | 4.82 |
| 4 | 9 | Gracie Lynn | East Grand Rapids | 5.00 |
| 5 | 9 | Reese Lynn | East Grand Rapids | 5.00 |
| 6 | 12 | Sarah Dixon | Forest Hills Eastern | 7.48 |
| 7 | 11 | Emma DeVries | GR West Michigan Aviation | 8.53 |
| 8 | 11 | Camille DeCola | Marshall | 8.85 |
| 9 | 10 | Ava Crews | Middleville Thornapple-Kellogg | 9.16 |
| 10 | 12 | Ellory Clason | Forest Hills Eastern | 10.02 |
| 11 | 12 | Camryn Bodine | East Grand Rapids | 11.44 |
| 12 | 12 | Olivia Barabas | Wayland Union | 11.57 |
| 13 | 11 | Ashlyn Smith | Forest Hills Eastern | 12.21 |
| 14 | 11 | Sophia Lado | East Grand Rapids | 12.52 |
| 15 | 11 | Ellia Agar | Grand Rapids South Christian | 13.74 |
| 16 | 9 | Chloe Rinzema | Grand Rapids South Christian | 15.93 |
| 17 | 10 | Desiree Duque-Rico | GR West Michigan Aviation | 16.80 |
| 18 | 11 | Brooklyn Springvloed | Grand Rapids South Christian | 18.71 |
| 19 | 12 | Halle Overmire | Grand Rapids South Christian | 20.73 |
| 20 | 12 | Megan Leneman | Ionia | 21.90 |
| 21 | 12 | Abigail Petr | East Grand Rapids | 22.21 |
| 22 | 12 | Kayla Barna | GR West Michigan Aviation | 23.66 |
| 23 | 12 | Kate Laidlaw | Forest Hills Eastern | 24.25 |
| 24 | 12 | Belinda Vrielink | GR West Michigan Aviation | 25.48 |
| 25 | 12 | Madison Berning | Battle Creek Harper Creek | 26.02 |
| 26 | 12 | Neveah Helderop | Hopkins | 27.01 |
| 27 | 12 | Zariah Ozuzu | Marshall | 27.22 |
| 28 | 10 | Mackenzie Zahm | Belding | 28.56 |
| 29 | 11 | Katie Behnke | Battle Creek Harper Creek | 28.79 |
| 30 | 9 | Jillian Clason | Forest Hills Eastern | 29.54 |